The old open clusters Saurer A, B and C revisited††thanks: Based on observations carried out at ESO La Silla. All the photometry is available at WEBDA database: http://obswww.unige.ch/webda/navigation.html
Abstract
We report on deep (V 24.0) CCD photometry of
3 fields centered in the regions of the old
open clusters Saurer A, B and C. In the case of Saurer A,
which is considered one of the oldest known open cluster,
we also provide a comparison field. From the analysis
of the photometry we claim that Saurer A is as old as M 67
( 5 Gyrs),
but more metal poor (Z=0.008). Moreover it turns out to be
the open cluster with the largest galactocentric distance
so far detected.
As for Saurer B, it closely resembles NGC 2158,
and indeed is of intermediate-age (1.8-2.2 Gyrs)
and significantly reddened. In this case we revise both the age and
the distance with respect to previous studies, but we are not able to
clearly establish the cluster metal abundance.
Finally, Saurer C has an age of about 2 Gyrs, but we emphasize
that the precise determination of its properties is hampered by the heavy field
stars contamination.
keywords:
Open clusters and associations: general – open clusters and associations: individual: Saurer A, B and C - Hertzsprung-Russell (HR) diagramThe open clusters Saurer A, B and C
1 Introduction
Saurer et al. (1994) identified 6 star concentrations by
inspecting POSS or ESO/SERC atlas, which they suggest might
represent hitherto uncatalogued star clusters, which
to date have not been included in any open clusters
catalog (Dias et al. 2002).
Preliminary photometry of all these star concentrations
have been recently published by Frinchaboy & Phelps (2002, FP02 hereinafter).
Their results can be summarized as follows:
-
Saurer A, B and C are old open clusters with ages greater than 2.5 Gyr. In particular Saurer A is marked as a very promising target for further studies due to the combination of his very large distance and age;
-
Saurer E is probably not a physical cluster;
-
Saurer D and F finally are intermediate age open cluster, with ages between 1 and 2 Gyr.
Due to the relevant importance of the oldest open clusters
for our understanding of the formation and early evolution
of the Galactic disk (Janes & Phelps 1994,
Carraro & Chiosi 1994, Friel 1995, Carraro et al. 1998,
Bragaglia et al. 2000),
we decided to obtain new, better quality
and deeper photometry of the oldest clusters in this sample,
namely Saurer A, B and C (see Table 1), to better constrain their
fundamental parameters.
Moreover, instead of deriving ages from a so-called Morphological
Age Indicator (MAI, Janes & Phelps 1994),
we are presenting a different approach to the determination
of all the clusters basic parameters, which is based on the
comparison of the photometry with theoretical models.
The plan of the paper is as follows. Sect. 2 illustrates the observation and reduction strategies. Sections 3 to 5 are dedicated to the discussion of our data for Saurer A, B and C, respectively. In these Sections we derive estimates of radii, distances, ages and reddenings. Finally, Sect. 6 summarizes our findings.
| Saurer A | 07:20:56 | +01:48:29 | ||
| Field | 07:18:18 | +01:53:43 | ||
| Saurer B | 08:25:28 | -39:38:02 | ||
| Saurer C | 10:41:25 | -55:18:20 |
2 Observations and Data Reduction
CCD observations were carried out with the new EMMI read arm camera on board NTT at ESO, La Silla, in the photometric night of December 9, 2002 and in sub-arcsec seeing conditions. The new camera has a mosaic of two 2048 4096 pixels CCDs which samples 9.9 9.1 arcmin in the sky having a pixel scale of ( binning).
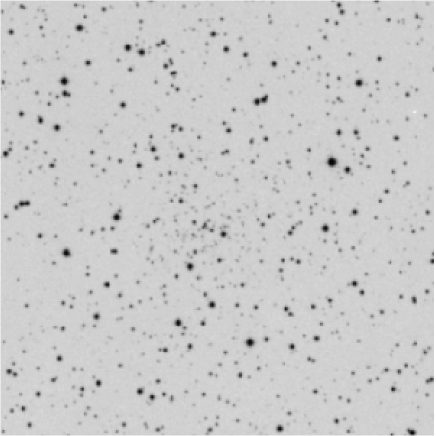
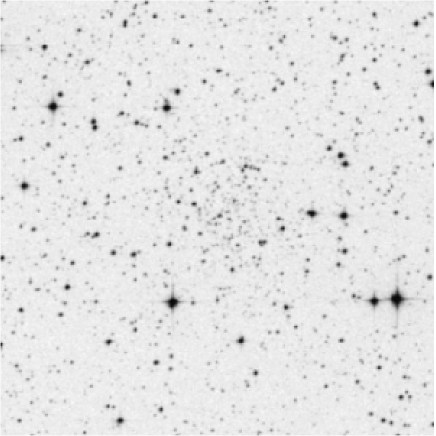
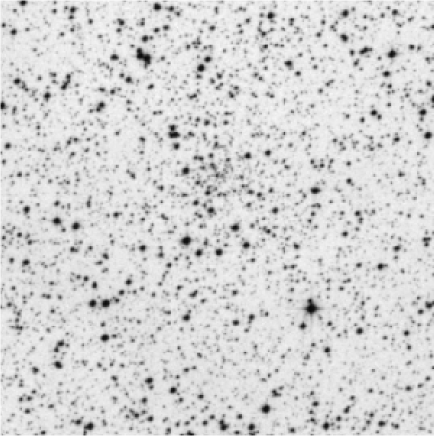
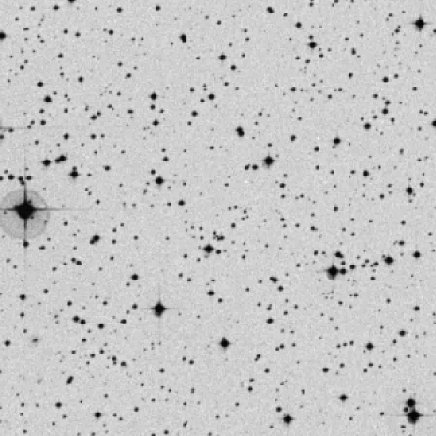
Details of the observations are listed in Table 2 where the observed fields are reported together with the exposure times, the typical seeing values and the air-masses. Figs. 1 to 4 show the finding charts for Saurer A, B, C and the comparison field, respectively, taken from the DSS-2111Second generation Digitized Sky Survey, http://cadcwww.dao.nrc.ca/cadcbin/getdss archive. The data has been reduced with the IRAF222IRAF is distributed by NOAO, which are operated by AURA under cooperative agreement with the NSF. packages CCDRED, DAOPHOT, and PHOTCAL using the point spread function (PSF) method (Stetson 1987). The calibration equations obtained by observing Landolt (1992) PG 0918+029, SA 098-562, SA 101-424 and PG 0942-029 fields observed along the night, are:
| Field | Filter | Exposure time | Seeing | Airmass | ||
|---|---|---|---|---|---|---|
| [sec.] | [] | |||||
| Saurer A | V | 1 | 30 | 360 | 0.9 | 1.175 |
| I | 1 | 30 | 300 | 0.9 | 1.182 | |
| Saurer A (Field) | V | 1 | 30 | 360 | 0.9 | 1.180 |
| I | 1 | 30 | 300 | 0.9 | 1.188 | |
| Saurer B | V | 1 | 30 | 360 | 1.0 | 1.027 |
| I | 1 | 30 | 300 | 1.0 | 1.031 | |
| Saurer C | V | 1 | 30 | 360 | 0.9 | 1.205 |
| I | 1 | 30 | 300 | 0.9 | 1.219 | |
| PG 0918+029 | V | 15 | 1.0 | 1.278 | ||
| I | 10 | 1.0 | 1.274 | |||
| PG 0942-029 | V | 15 | 1.0 | 1.267 | ||
| I | 10 | 1.0 | 1.263 | |||
| SA 098-562 | V | 15 | 0.9 | 1.143 | ||
| I | 10 | 0.9 | 1.143 | |||
| SA 101-424 | V | 15 | 1.0 | 1.148 | ||
| I | 10 | 1.0 | 1.147 | |||
| = -0.5600.023 -(0.0580.023) + 0.135 |
| = -0.2580.066 -(0.0630.070) + 0.048 |
where are standard magnitudes, are the instrumental ones,
and is
the airmass. The standard
stars in these fields provide a very good color coverage.
For the extinction coefficients, we assumed the
typical values for La Silla observatory.
The photometry turns out to be quite accurate with global
errors (zero point, PSF fitting and aperture correction errors)
amounting to less than 0.10 mag in magnitude
and 0.15 mag in colour down to V 23.0.
The final photometric data are
available in electronic form at the
WEBDA333http://obswww.unige.ch/webda/navigation.html site.
Our photometry extends down to V = 14, and therefore results to be about 2 mag deeper than FP02. The photometric accuracy, excellent seeing conditions and good pixel scale allow us to properly study very faint and contaminated objects like those ones in the present study.

3 The open cluster Saurer A
3.1 Cluster radius
Saurer A appears as a very weak concentration of stars (see Fig. 1), with a size of a few arcmin. In order to infer a more robust estimate of the cluster radius, we performed star counts by using our CCD data (1500 stars). We derived the surface stellar density by performing star counts in concentric rings 15 arcsecs in size (46 pixels) around the visual cluster center, and then dividing by their respective surfaces. Our aim is to find the region where the cluster clearly emerges over the field. The result is shown in Fig. 5. Here we plot the radial density profile for the cluster (solid symbols) as a function of the limiting magnitude. We performed star counts also in the comparison field, by simply computing the density of field stars down to the same limiting magnitude. The cluster does not emerge much from the field when considering , which means that the cluster is very poorly populated by bright stars. At dimmer magnitudes, the cluster clearly emerges from the field up to R 1.3 arcmin, that we shall consider as the cluster radius in the following analysis.


3.2 The Colour-Magnitude Diagram
In Fig. 6 we present the CMDs of Saurer A (left panel)
and the comparison field (right panel).
The two CMDs look like quite similar, and there is no
signature of a star cluster by considering the stars
in the two fields altogether. The only significant
difference is the blue edge of the Main Sequence between
19 and 22 mag, which is much more populated in the
cluster than in the field, and which can be interpreted as
a cluster sequence.
To clarify this point, we consider only the stars in a
circle 1.7 arcmin in radius (somewhat larger than the cluster radius)
wide centered in the cluster center,
and we compare the derived CMD with its counterpart
in the field. These regions have been selected to match
the circles in Fig. 1 in FP02.
The result is shown in Fig. 7, from which
we see that actually a cluster exists, and the CMD
looks like that one from FP02,
although we have more stars, and
the MS is 1 mag more extended. The exact shape of the CMD
is however difficult to understand,
at the point we are not able to
distinguish neither a Red Giant Branch nor a clump.
In particular the detection of a clump at =16.7,
= 1.15 by FP02 is suspicious, provided the almost
similar stars distribution of the cluster and the field
in the upper part of the CMD.
It is therefore clear that from this CMD it is not possible
to derive reasonable estimates of the cluster parameters.
To better deal with field stars contamination we then consider only the stars confined within 0.8 arcmin from the cluster center. (see Fig. 8) Here the cluster appears very nicely and the contamination of foreground stars is negligible (see also the field CMD in the right panel). The MS turn off (TO) is located at =19.0, =0.80, as in FP02. The MS extends for 3.5 mag, and shows two probable gaps at =19.25 and =21.0 A sequence of binary is also visible red-ward the MS. There are still a few interlopers, but the upper part of the CMD appears now sufficiently clear, although poorly populated. It is in fact possible to see some RGB stars and a probable clump populated by 3 stars at =16.9, =1.1 .


3.3 Basic parameters
We derive Saurer A fundamental properties by comparing
the CMD with theoretical isochrones from Girardi et al. (2000).
The choice of this set of models is motivated by the need
to keep the age, distance and reddening determinations
in the same scale of a series of previous papers on the same subject
(see for instance Carraro et al. 2002 and references therein).
This is quite a basic constraint, especially
when old open clusters are used as tracers of the Galactic
disk properties and evolution (see the discussion in Carraro
et al. 1998), where the homogeneity of the sample
is a fundamental need.
In the following analysis
we are going to consider only the stars within 48 arcsecs.
The best fit isochrone solution is shown in Fig. 9,
where we over-imposed a 5 Gyr isochrone for
Z = 0.008 metallicity. We have tried several combinations
of ages and metallicities, but none provides a reasonable
fit like this.
For the sake of illustration we over-plot in Fig. 9
also the solar metallicity isochrone which provides the most
reasonable fit (dashed line). This isochrone is for an age of 6.3 Gyrs,
and has been shifted by E=0.09
and =15.6. However, while the TO is nicely reproduced,
both the MS and the most evolved region of the CMD are poorly
accounted for.
To better bracket the metal content of the cluster we also
over-imposed the Z=0.004 isochrone which better fits
the data, although this metallity would be quite low
and unexpected for population I objects. The best fit
(dotted line in Fig. 9) is obtained for an age of 4.5
Gyrs, a reddening E=0.20, and a distance modulus
=16.2 . The fit is good also in this case, the MS
is actually a bit bluer, and in principle one could
increase a bit the age to lower the distance between
the TO and the RGB bottom, but in this way the clump would
become too bright. Notice (see Fig. 9) that the theoretical
clump is already brighter than the oserved one at 4.5 Gyrs.
Therefore we opted for a half solar metal abundance.
The fit with the Z=0.008 isochrone
has been obtained by shifting the isochrone
by E = 0.18 and = 16.0 . These values are in nice agreement
with FB02. To get an estimate of the age uncertainty we have
over-imposed to the data a younger and older isochrone
for Z=0.008 metallicity. The result is shown in Fig. 10.
In this figure the solid line is the 5 Gyr best fit isochrone,
whereas the dotted line and the dashed line are a 4 and 6 Gyr
isochrones, respectively. By keeping the isochrone close
to the cluster TO, the evolved region shows what one expects,
namely a bluer RGB at older ages, and a dimmer clump
at younger ages.
From this figure we estimate an age uncertainty
less than 1 Gyr.
FB02 uses the clump as distance indicator, by assuming that the clump really exists and that its position does not depend neither on age nor on metallicity. The fact that the clump can be used as distance indicator is quite well known. However we restrain to use it mainly because - as shown by Girardi &Salaris (2001) - the clump position is a function of age and metallicity. This latter parameter in particular cannot be robustly constrained with the available data.
We get an absoulte distance modulus =15.6.
As a consequence,
Saurer A turns out to be 13.2 kpc far from the Sun,
and by adopting =8.5 kpc, its rectangular
coordinates are: X = 19.3, Y= -7.4
and Z = 1.7 kpc, respectively.
Therefore Saurer A is the most peripheral
open cluster to date, and lies very high on the Galactic plane
for an open cluster.
In conclusion, from our photometry we better constrain Saurer A basic parameters. In particular we refine the size and the age of the cluster, we suggest that it is metal poor, and basically confirm the reddening and distance already found by FB02. As for the age, this is not an unexpected result. It is very well known that MAI (Janes & Phelps 1994) tends to over-estimate the age of a cluster, and can be used only as a qualitative indication of the relative age between two or more clusters (see the discussion in Carraro et al. 1999 and FB02).
4 The open cluster Saurer B
4.1 Cluster radius
Saurer B appears as a faint concentration of stars as Saurer A (see Fig. 2), although somewhat more extended and loose. In order to infer a more robust estimate of the cluster radius, we performed star counts by using our CCD data (2200 stars). We derived the surface stellar density by performing star counts in concentric rings 15 arcsecs in size around the visual cluster center, and then by dividing by their respective surfaces. In this case we do not have a comparison field, so it is more cumbersome to derive a firm estimate. However, by looking at Fig. 11, one can conclude along the same vein of the discussion for Saurer A that the cluster emerges over the field as a group of faint stars, and that the cluster radius is 1.5 arcmin, a value which confirms the visual inspection of Fig. 2.
4.2 The Color-Magnitude Diagram
In Fig. 12 we present various CMDs of Saurer B as a function
of the distance from the cluster center. In the upper left
panel the CMD for all the detected stars is shown. Here
the cluster is barely visible and the CMD is dominated by the
MS of the Galactic disk population. At odds with Saurer A,
this cluster is in fact located quite low in the Galactic disk.
Having estimated a radius of 1.5 arcmin, we present
also the CMD for the star in this region (upper right panel),
which basically shows the same features of the previous CMD,
although an important fact can be noticed:
while the blue part of the CMD in this case becomes narrower
and better defined, the red part does not change too much,
and the evidence appears of the possible presence
of a RGB clump.
To better probe the cluster population we show in the lower
left panel the stars enclosed within 1.0 arcmin from the cluster
center. Here we see a nice MS, although significantly wide,
and a well populated RGB clump. This is confirmed
also by the CMD in the lower right panel, which comprises
the same area as in the previous panel, and it is meant to
represent the field stars population. In this CMD there
is no clump at all.
The cluster TO is located at = 20.0, = 1.8,
while the clump is centered at =18.2, =2.4.
The width of the MS is much probably not due to photometric
errors (see Fig. 5, upper panel) which at 22 amounts at
less than 0.1 mag in color. Therefore we suggest the MS is that wide
due to other two possible reasons, which however
we are not possible to quantify
with the present data: a binary population and some differential reddening
across the custer.
In conclusion Saurer B exhibits all the features of an intermediate age open cluster (Carraro et al. 1999), and resembles very much the CMD of clusters like NGC 2158 (Carraro et al. 2002) and NGC 7789 (Girardi et al. 2000).


4.3 Basic parameters
We derive Saurer B fundamental parameters in the same way as for Saurer A.
In Fig. 13 we plot all the stars lying within 1 arcmin from the adopted
cluster center, and we show the best fit isochrone solution.
Again we use a Z=0.008 isochrone (solid line),
but for the age of 1.8 Gyrs,
which nicely fits both the TO region and the RGB clump.
The fit has been obtained by shifting the isochrone by
E=1.38 and =17.4, and the corrected distance modulus turns
out to be =14.1.
In order to derive an estimate of the cluster metal content,
also in this case we tried a fit with a solar
metallicity isochrone (dashed line), and find an age of 2.2 Gyrs,
a reddening E=1.30, an apparent distance modulus =17.2,
and corrected distance modulus turns
out to be =14.08.
The quality of the CMD - in particular the region
of the TO is probably still affected by some contamination -
does not allow us to firmly establish the
metallicity of the clusters and, indeed, the derived parameters
are pretty similar.
In this case, however, the cluster clump is clearly visible, and placed at V=18.2. Therefore we derive (Girardi & Salaris 2001) that for an age of 1.8 Gyrs and a metallicity of Z=0.008, the absolute clump magnitude is = 0.542, and therefore = 17.7. In the case of solar abundance, the clump magnitude at 2.2 Gyrs is = 0.578, hence = 17.6. Also with this method we basically obtain the same distance modulus, stressing again our inability to discriminate between different metallicity models.
As a consequence of these outcomes, Saurer B is placed 6.6 kpc far from the Sun,
and its rectangular coordinates are: X = 9.8, Y= -6.5
and Z = -0.1 kpc, respectively.
To summarize, with respect to the study of FB02, we obtain a much larger distance from the Sun, and a significantly younger age, a result which confirms the trend that the MAI predicts systematically older ages.

5 The open cluster Saurer C
5.1 Cluster radius
Saurer C appears as a faint concentration of stars in a very rich Galactic field (see Fig. 3). In order to achieve an estimate of the cluster radius, we performed star counts by using our CCD data (4500 stars). We derived the surface stellar density by performing star counts in concentric rings half an arcmin in size around the visual cluster center, and then by dividing by their respective surfaces. The results are shown in Fig. 14. In this case we find an over-density of faint stars up to a radius of 2 arcmin, while the bright stars profile keeps flat, showing that the cluster does not contain a significant amount of bright stars. By combining together the shape of the density profile and the appearance of the cluster in Fig. 3, we suggest that the cluster radius is around 2 arcmin.
| Saurer A | 1.3 | 0.18 | 0.14 | 15.6 | 19.3 | -7.4 | 1.6 | 5.01.0 |
| Saurer B | 1.5 | 1.30-1.38 | 1.05-1.10 | 14.1 | 9.8 | -6.6 | -0.1 | 1.8-2.2 |
| Saurer C | 2.0 | 0.98 | 0.76 | 14.9 | 11.0 | -9.3 | 0.5 | 2.0 |
5.2 The Color-Magnitude Diagram
In Fig. 15 we present several CMDs of Saurer C as a function of the distance from the cluster center. In the upper left panel the CMD for all the detected stars is shown. Here there is no cluster appearance and the CMD is dominated by the Galactic disk field stars population. If we consider only the stars located inside the cluster radius (upper right panel), the situation does not change too much, the only improvement being that the red part of the CMD is better defined, and a RGB clump seems to be present. However, if we consider the more central part of the cluster (lower left panel), the clump becomes poorly populated, rendering very difficult the interpretation of the CMD. Fortunately, when considering a field area (lower right panel) of the same size of the cluster central part, we find that there is no hint for a clump, thus making us more confident with the interpretation of the CMD in the lower left panel.
5.3 Basic parameters
Although the field stars contamination is very severe in the field
of Saurer C,
we still tried to find an isochrone solution, which of course has to
be considered preliminary. The result is shown in Fig. 16,
where we plot all the stars within 1 arcmin from the cluster radius.
The fit has been obtained by shifting the isochrone by
E=0.98 and =17.2, and the corrected distance modulus turns
out to be =14.9.
Since the clump is placed at =18.0,
we derive (Girardi & Salaris 2001) that for an age of 1.8 Gyrs
and a metallicity of Z=0.008, the absolute clump magnitude
is = 0.540, and therefore = 17.46, in fine agreement
with that derived from the isochrone fitting
As a consequence, Saurer C is placed 9.6 kpc far from the Sun,
and its rectangular coordinates are: X = 11.0, Y= -9.3
and Z = 0.5 kpc, respectively.

6 Conclusions
We have presented deep CCD photometry study of the old open clusters Saurer A, B and C. The CMDs we derive allow us to constrain quite well the cluster basic parameters, which are listed in Table 3. In summary, we find that:
-
Saurer A is an M 67 like old open cluster and it is the most distant open cluster to date; it would be of extreme interest to have a spectroscopic confirmation of its metal abundance. RGB stars at are indeed easily affordable with present day 8m class telescopes;
-
Saurer B turns out to be a very reddened NGC 2158 like, intermediate-age open cluster;
-
Saurer C is as well an intermediate-age open cluster, but it remains a very difficult object due to the heavy field stars contamination toward its direction.
Acknowledgements
We are pleased to thank John Willis for his kind introduction at ESO NTT, and for useful suggestions during the reduction of the data presented in this paper. This study has been financed by the Italian Ministry of University, Scientific Research and Technology (MURST) and the Italian Space Agency (ASI), and made use of Simbad and WEBDA databases.
References
- [1] Bragaglia, A., Tosi M., Marconi G., Carretta E., 2001, in The Evolution of the Milky Way: stars versus clusters, Kluwer Academic Publishers, ISBN 0-7923-6679-4, p.281
- [2] Carraro G., Chiosi C., 1994, A&A 287, 761
- [3] Carraro G., Girardi L, Chiosi C., 1999, MNRAS 309, 430
- [4] Carraro G., Ng Y.K., Portinari L., 1998, MNRAS 296, 1045
- [5] Carraro G., Girardi L, Marigo P., 2002, MNRAS 332, 705
- [6] Dean J.F., Warren P.R., Cousins A.W.J., 1978, MNRAS 183, 569
- [7] Dias W.S., Alessi B.S., Moitinho A., Lepine J.R.D., 2002, A&A 389, 871
- [8] Friel E.D., 1995, ARA&A 33, 381
- [9] Frinchaboy P.M., Phelps R.L., 2002, AJ 123, 2552
- [10] Girardi L., Bressan A., Bertelli G., Chiosi C., 2000, A&AS 141, 371
- [11] Girardi L., Mermilliod J.-C., Carraro G., 2000, A&A 354, 892
- [12] Girardi L., Salaris M., 2001, MNRAS 323, 109
- [13] Janes K.A., Phelps R.L., 1994, AJ 108, 1773
- [14] Landolt A.U., 1992, AJ 104, 340
- [15] Stetson P.B., 1987, PASP 99, 191