Unraveling the cooling trend of the Soft Gamma Repeater, SGR
Abstract
SGR 162741 was discovered in 1998 after a single active episode which lasted weeks. We report here our monitoring results of the decay trend of the persistent X-ray luminosity of the source during the last 5 years. We find an initial temporal power law decay with index 0.47, reaching a plateau which is followed by a sharp (factor of ten) flux decline days after the source activation. The source spectrum is best described during the entire period by a single power law with high absorption ( cm-2); the spectral index, however, varies dramatically between spanning the entire range for all known SGR sources. We discuss the cooling behavior of the neutron star assuming a deep crustal heating initiated by the burst activity of the source during 1998.
1 Introduction
Soft gamma repeaters (SGRs) are a rare subclass of neutron stars characterized by their emission of randomly recurring outbursts of hard X- and soft -rays. There are currently four SGRs identified in our galaxy and one in the Large Magellanic Cloud (LMC), three of which have been found to pulse with periods ranging between s (for a review see Kouveliotou 2004). The very rapid secular increase of these periods, (spin down of s/s), argues for angular momentum loss from a highly magnetized neutron star ( G). This idea was developed by Duncan and Thompson (1992, henceforth DT92) and, subsequently, by Paczynski (1992), following the detection of the most intense high energy transient observed to date, the giant flare of 1979 March 5 (from SGR in the LMC), which gave a lower limit of the source magnetic field of G. DT92 dubbed such sources “magnetars”.
SGR 162741 was discovered with the Burst And Transient Source Experiment (BATSE) on the Compton Gamma-Ray Observatory (CGRO) in June 1998 (Kouveliotou et al. 1998), when it emitted over 100 bursts within an interval of 6 weeks (Woods et al. 1999); no further burst emission has been observed to date (July 2003). Roughly 20% of all events, representing of the total burst-emitted energy (20 -150 keV), were bunched in an interval of three days, 1998 June . The X-ray counterpart to SGR 162741, SAX J, was discovered in a BeppoSAX/Narrow Field Instrument (NFI) observation on 1998 August 7, at and (J2000) with an error circle of radius 1′ (95% confidence level; Woods et al. 1999). In Wachter et al. (2003) we report an improved (error radius ) source location recently derived with the Chandra X-Ray Observatory, together with results of our near-infrared searches for a counterpart. A search for coherent pulsations in the BeppoSAX dataset, when the source intensity was higher, showed marginal evidence ( confidence level) near 6.4 s; to date the source spin period remains unknown.
During their quiescent periods, SGRs have been identified as persistent X-ray sources with luminosities of ergs/cm2s. When active, their outbursts last anywhere from days to a year, with different burst frequency and intensity per source and per outburst. SGR bursts have typical durations of 0.1 s and their spectra are usually best-fitted to an optically thin thermal bremsstrahlung function with keV. The burst size distributions follow a power law of index , with peak luminosities of events ranging from the small, common bursts at 5 erg/s to the rare, giant flares (only two have been observed) at erg/s.
The enhancing effect of the SGR bursting activity on the flux level of their persistent emission is well documented for SGR where the flux was shown to increase by a factor of 700 after the giant flare of 1998 August 27. The flux from the source decayed within days according to a power-law, (Woods et al. 2001). For the next several months, the burst activity and persistent/pulsed flux level gradually declined. The SGR was not observed to reach its quiescent flux level of erg/cm2s until 2000 April, approximately two years after the burst reactivation of the SGR, though extrapolation of the 40-day decay after 1998 August 27 suggests that it may have done so between observations. The source has been intermittently active ever since, resulting in erratic flux decay behaviour.
In contrast, SGR 162741 has remained dormant after a single active episode thus being a better long term target for SGR cooling studies. We present here (Sections 2, 3, 4, and 5) the results of our monitoring of the flux decay of the quiescent X-ray counterpart of SGR 162741 obtained with imaging instruments (BeppoSAX, ASCA and Chandra) spanning an interval of roughly five years. In Section 6 we discuss the source’s atypical decay within the framework of neutron star crust cooling and its implications on the properties of SGR progenitors.
2 BeppoSAX Observations
Since 1998, we have observed the source four times with the BeppoSAX/NFI. Results from the first two observations were presented in Woods et al. (1999). Here, we present results from a refined analysis of the earlier data together with the two subsequent observations in August 1999 and September 2000. For all BeppoSAX data sets, we followed the data extraction procedure described in Woods et al. (1999). A log of the observations and spectral fit results is given in Table 2. Due to the significant contribution to the background from the Galactic ridge, we are using contemporaneous data from a concentric annulus around our source position for our background spectrum. An energy dependent multiplicative factor has been applied to the background spectrum to correct for reduced efficiency at off-axis angles in both the LECS and MECS. From these earlier BeppoSAX observations, where the higher source intensity allowed for better statistics, we have determined using XSPEC (v11.2; Arnaud 1996) that, in all cases, a single power-law (PL) model is the best fit spectral function for the data.
3 ASCA Observations
SGR 162741 was observed by the Advanced Satellite for Cosmology & Astrophysics (ASCA) on 1999 February 26-28. Onboard ASCA are four independent X-ray telescopes and four independent X-ray detectors; the latter are two Gas Imaging Spectrometers (GIS) and two Solid-State Imaging Spectrometers (SIS). For the present analysis, we have extracted all available GIS and SIS data sets and applied the standard screening criteria111http://heasarc.gsfc.nasa.gov/docs/asca/screening.html. We reduced the data separately for each GIS and for each SIS detector in 1-CCD mode, and extracted spectra using XSELECT (v2.1) from circular regions centered on the SGR with radii of and for GIS and SIS, respectively. Since the source was faint, we used a smaller region than the recommended ASCA source extraction region to reduce the background. Finally, the background was taken from neighboring regions on each detector.
To derive an accurate measure of the source flux, we generated off axis GIS ancillary response files, dead-time corrected the GIS data, and included only the high and medium bit rate SIS data. We then generated response files (using FTOOLS v5.2 tasks ascaarf and sisrmg) for each detector separately. We combined all the SIS data into a single data set, (similarly the GIS data), weighting in each case the response functions by their individual effective live times. We grouped the data into energy channels that contained at least 25 events each.
We performed independent fits to the SIS and GIS data (using XSPEC) of a PL model including the effects of Galactic absorption. We note that the final flux we measure for the SGR (see also section 5 and Table 2) is significantly lower than the value reported earlier ( ergs/cm2 s) by Hurley et al. (2000). This discrepancy is due to the low source count rate in the GIS detectors, which results in a critical dependence of the measured flux on the selected background region. For example, choosing a background region several arcminutes away from the SGR, where the detector count rate is much lower, we find a flux comparable to the value reported by Hurley et al. (2000). In contrast, we have selected a background region close in angle to the SGR, which resides in an area of the sky that contains significant diffuse emission. This choice is justified by the fact that the flux we measure with the GIS is in good agreement with the flux measured by the SIS detectors (within 10%), which do not suffer from this issue due to their smaller field-of-view.
4 Chandra observations
We observed SGR 162741 with Chandra on 1999 September 20 (Obs1) and on 2003 March 24 (Obs2). In both observations the SGR fell on ACIS-S3 (operating in Timed Exposure mode), a back-illuminated CCD with good spectral resolution. We used calibration products from Chandra CALDB (v2.21). Using the standard CIAO (v2.3) tools, we applied the appropriate gains, CTI corrected the events, and filtered the data to include events with grades=0,2-4,6. We selected a circular extraction region of radius centered on the SGR for the source spectra. We collected the background spectrum from annular regions centered on the SGR with inner and outer radius of and , respectively. The keV background-subtracted source count rates were 0.0049 cnt/s (Obs1) and 0.0058 cnt/s (Obs2) (the background contributed only to the total count rate for each observation). We then generated the response files using standard CIAO tools and corrected the ancillary response files to account for the time dependent degredation of the ACIS quantum efficiency. We have investigated bremsstrahlung, blackbody, and PL models using XSPEC and find that the PL model gives the least C-statistic for both data sets (fitted individually or simultaneously). We have, therefore, adopted the absorbed PL model as the preferred continuum model for the Chandra observations. Our spectral fit results to the ungrouped data using the C statistic are given in Table 1. A simple ratio of the two data sets indicates that Obs2 has a softer spectrum, as also indicated by the spectra in Table 1.
| Parameter | OBS1 | OBS2 | OBS1OBS2d |
|---|---|---|---|
| atoms cm | 9(2)a | 10(2) | 9.6(1.1) |
| Index | 2.2(5) | 3.3(6) | 2.3(4), 3.1(4) |
| Fluxb | 0.33 | 0.44 | 0.34, 0.39 |
| C-Stat (Goodnessc) | 447.9 (86.6%) | 369.1 (92.6%) | 817.3 (95.2%) |
a Uncertainties are given at the 68% confidence level for 1 parameter b Unabsorbed 2-10 keV flux in units of ergs/cm2s
c Percentage of 1000 realizations of the model in which C-stat is less then that listed in table d Obs1 and Obs2 are simultaneously fitted with forced to have the same value for both data sets and the remaining parameters are kept free
5 Joint Spectral Analysis–Source energetics
In Sections 2-4, each of the seven data sets was fit independently to a PL model attenuated by interstellar absorption. Motivated by the consistency of the measured spectral parameters from all seven observations, we performed a simultaneous fit to all data sets linking the Hydrogen column density, . We have kept the value of linked assuming that there is no obvious physical reason for the intrinsic source absorption to change while the source is in quiescence. For all observations, the fit was statistically acceptable (). We measure the (linked) effective hydrogen column to be cm-2. Table 2 lists all other fit parameters.
| Mission | Date | Exposure | Photon | Fluxa |
|---|---|---|---|---|
| (MJD) | (ksec) | Index | (10-12 ergs/cm2s1) | |
| BeppoSAX | 51032.25 | 44.9 | 2.54(16) | 6.56 |
| BeppoSAX | 51072.52 | 30.4 | 2.77(21) | 4.94 |
| ASCA | 51235.20 | 67.9 | 3.24(24) | 2.76 |
| BeppoSAX | 51399.78 | 80.4 | 3.77(30) | 2.29 |
| BeppoSAX | 51793.59 | 61.3 | 2.99(29) | 1.86 |
| Chandra | 52182.50 | 48.9 | 2.17(30) | 0.267 |
| Chandra | 52505.00 | 25.7 | 2.95(36) | 0.266 |
a Unabsorbed keV flux
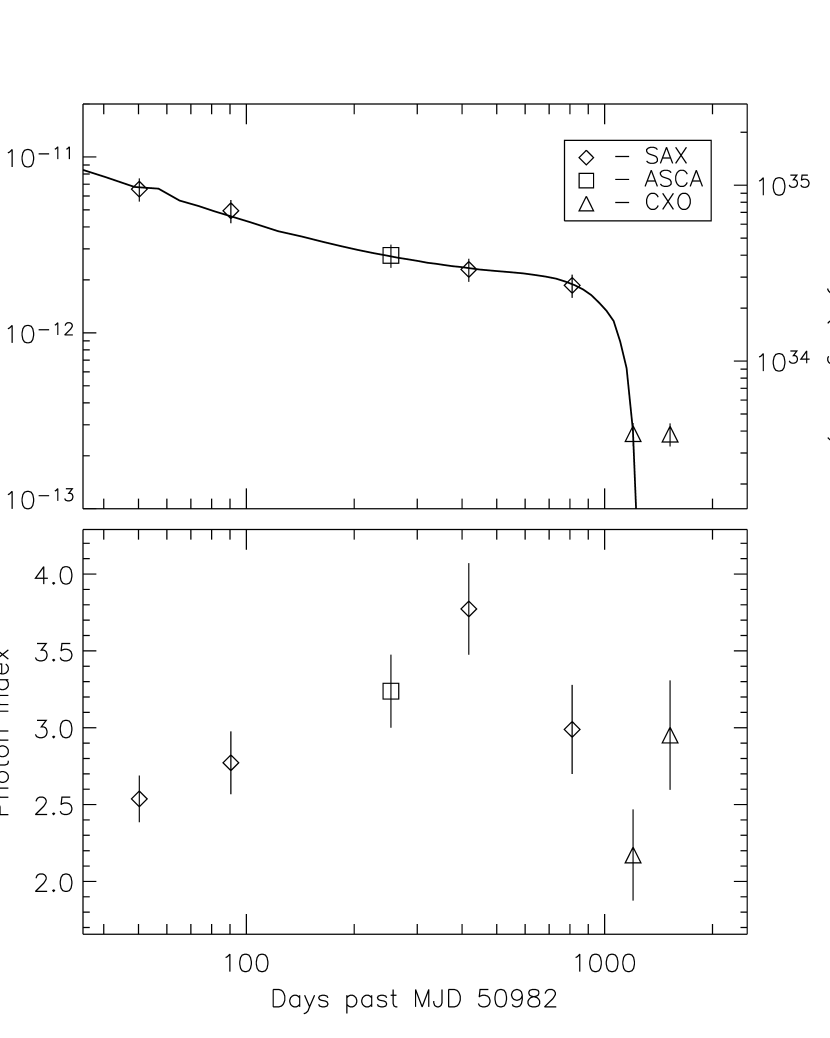
Figure 1 displays the evolution of the source flux (upper panel) and spectral index (lower panel) since its activation. During the first 800 days following the 1998 outburst, the flux from SGR 162741 decayed monotonically as a power-law with exponent . The last BeppoSAX observation indicated that the source might have reached a plateau, approximately two years after activation. However, the two subsequent Chandra observations (at 1200 and 1500 days after the outburst) are significantly below (almost a factor of ten) the extrapolated decay trend. The photon index does show significant changes in the years following the 1998 outburst; the probability that the observed variability is due to statistical fluctuations is 7.1 10-4. We discuss these results further in the next section.
While the spectra of SGRs and are relatively hard, with indices between 2.0 and 2.5, SGR is much softer with a spectral index of 3.5. Interestingly, the spectral index range of SGR 162741 () spans all other SGR sources observed at their quiescent states, although we do not see the blackbody (bb) component observed in SGR . This is not unexpected, given that the bb contribution in the unabsorbed flux of 190014 is of the order of 20%; since the column density along the line of sight for SGR 162741 is almost 10 times higher, extreme absorption between 0.1 - 2.0 keV would hinder the detection of any bb component that contributes less than at least 50% of the (unabsorbed) flux.
Near the source activation the flux was ergs/cm2s, corresponding to a source luminosity of ergs/s (assuming a source distance of 11 kpc; Corbel et al. 1999). The luminosity decayed slowly to before it plummeted to its current value of erg/s. In comparison, the persistent luminosity levels of SGRs , and are , 4.1 and ergs/s, respectively. If SGR 162741 decays further below its current luminosity level, it may well provide the first direct link between SGRs and Isolated Neutron Stars, whose luminosities it seemed to be approaching pretty rapidly through day 1200 (Figure 1).
6 Interpretation and Discussion
The study of the afterglow following an SGR episodic energy release is complicated by the fact that both the magnetosphere and the surface are subject to change, and by the unpredictable nature of reheating by additional, later bursts. Conventional wisdom, though still somewhat tentative, would suggest that the surface radiation is reprocessed and non-thermalized by resonant scattering in the magnetosphere (Thompson, Lyutikov and Kulkarni 2002) This suggests that sharp spectral changes would signify changes in the magnetospheric configuration; conversely, an ordered, gradual decline in intensity with a constant spectrum indicates a decline in the thermal surface emission. To study the latter, a period of gradual decline is needed uninterupted by new events that reheat the surface. It was not obvious a priori that all these factors could be unraveled.
The 40-day afterglow following the 1998 August 27 giant flare of SGR was extremely well fit by a crustal cooling model (Lyubarsky, Eichler and Thompson 2002, hereafter LET), despite the existence of many small bursts that took place during that period. Ironically, the luminosity of this source was seen to increase and behave erratically over the following year, when there was relatively little SGR burst activity. In other words, SGR bursts do not necessarily heat the crust significantly and, moreover, there may be other kinds of sporadic heating that is not expressed in SGR bursts.
Encouraged by the success of our outer crust cooling model for the 40-day afterglow of SGR , we attempt here to understand the three year monotonic decline of SGR 162741 as cooling after a single deep crustal heating event coinciding with the burst activity of 1998. Details of our calculational methods can be found in LET. In particular, the leveling of the flux during the third year followed by its sharp decline are curious features that beg for an explanation within this model.
We present in Figure 2 our numerical calculations of the temperature evolution (cooling) of the neutron star crust with depth, , assuming an initial energy injection to the crust of the order of 1044 ergs (estimates of the total energy released in bursts during the activation of SGR 162741 range between ergs; here we assume that the conversion efficiency of the total energy released during the activation into soft gamma-rays is considerably less than 100%). The general shape of the initial temperature profile was chosen under the assumption that the energy density of deposited heat varies with height more slowly than the specific heat: thus, in the outer crust, where the specific heat increases with depth, the initial temperature (i.e. immediately after the heating event) declines with depth. In the inner crust, on the other hand, the specific heat rises even more rapidly with the onset of neutron drip, but only if these neutrons are unpaired. (Paired neutrons do not represent new degrees of freedom because they are condensed into a superfluid.) Below , the temperature below which neutrons pair, the specific heat of the crust material is small, and it rises dramatically near as free, unpaired neutrons appear. It is thus reasonable to choose the initial temperature to be near in the lower crust. The theoretically predicted behavior of as a function of density can vary from one model to the next, but the qualitative feature is that it increases with density and then decreases as the nature of the pairing changes, hence we put a bump in the initial temperature profile at m. The exact shape of the bump is not very important as it gets washed out before it affects the surface temperature.
We also assume that the core temperature is very low. This is justified if the mass of the neutron star exceeds and the density, therefore, is high enough at the core to cool it via the direct URCA process. The assumption of a high mass neutron star makes the additional prediction of a thin crust, quite independently of the low core temperature, and this is reflected in the relatively rapid timescale (a few years) for cooling of the inner crust. If our interpretation of the transient cooling is correct, we thus determine the mass of SGR 162741 via two independent considerations to be above .

The time behavior of the surface luminosity is displayed in Figure 1 (upper panel), where we have plotted the data points together with the theoretical curve. It is seen that the plateau between days 400 and 800 is fit very accurately. The reason is that the sharp rise in the specific heat near neutron drip and above makes this region in the depth temperature plane a very large heat reservoir, which keeps the temperature at neutron drip very stable. The duration of the plateau is determined primarily by the time required for the inner cooling wave to propagate outward to the neutron drip point. Most of the heat in the inner crust is conducted to the center of the star. The surface lightcurve is insensitive to many other details of the inner initial temperature profile, because by the time the surface feels the latter, the spatial variations within it are largely washed out.
This model is unable, of course, to explain the March 2003 data point, which showed that the flux did not decay further, and, moreover, showed a softening of the spectrum. One could argue that the apparent flux “ledge” reflects a persistent, baseline luminosity that is observed only when the star is sufficiently cool. Other SGRs in fact have larger persistent luminosities, which are temporarily buried by enhanced, transient afterglows that typically follow major bursting episodes. In the other cases, (such as with SGR ), the persistent luminosity was attributed (LET) to a hot core (temperature K). In the case of SGR 162741 however, the “observed” (based, for the time being, on only two data points) persistent emission cannot be attributed to a hot core according to our model: we calculated that any core hot enough to account for observable persistent emission at the level of the last two points in Figure 2, would keep the bottom of the crust warm and thus smear out the observed sharp ledge in the light curve. Further, the surface temperature would not have dropped fast enough to have accounted for the first Chandra data point. However, if the persistent emission is from a small hot spot at the surface, it does not affect the cooling of the deep crust and can be considered superimposed onto the theoretical cooling curve. If this low level component is ever found to be pulsed, it would support our conjecture that the baseline emission is heating at the surface rather than at finite crustal depth. More closely spaced and longer observations are certainly needed to establish the current level and nature of the source emission.
References
- (1)
- (2) Arnaud, K. A., 1996, Astronomical Data Analysis Software and Systems V, A.S.P. Conference Series, 101, 17
- (3)
- (4) Corbel, S., Chapuis, C., Dame, T. M. & Durouchoux, P. 1999, ApJL, 526, 29
- (5)
- (6) Duncan, R. & Thompson, C. 1992, ApJL, 392, 9
- (7)
- (8) Hurley, K., et al. 2000, ApJL, 528, 21
- (9)
- (10) Kouveliotou, C., et al. 1998, IAUC, 6944
- (11)
- (12) Kouveliotou, C. 2004, in Proceedings of the Jan van Paradijs Memorial Symposium, eds. E.P.J. van den Heuvel, L. Kaper, R.A.M.J. Wijers & E. Rol., Publications of the Astronomical Society of the Pacific, in press.
- (13)
- (14) Lyubarsky, Y., Eichler, D. & Thompson, C. 2002, ApJL, 580, 69
- (15)
- (16) Paczyński, B., 1992, Acta Astron., 42, 145
- (17)
- (18) Thompson, C., Lyutikov, M., & Kulkarni, S.R., 2002, ApJ, 574, 332
- (19)
- (20) Wachter, S., et al. 2003, ApJL, submitted
- (21)
- (22) Woods, P.M., et al. 1999, ApJL, 519, 139
- (23)
- (24) Woods, P.M., et al. 2001, APJL, 552, 748
- (25)