XMM-Newton observation of the Chandra Deep Field-South: Statistical treatment of faint source spectra
Abstract
We present first results of the X-ray spectral analysis of the 500 ksec deep survey obtained with XMM-Newton on the Chandra Deep Field South (CDFS). Statistical distributions of spectral index and intrinsic absorption are derived for a sample containing 70 sources with a count limit of 100 (flux limit in the [2-10] keV band of 8.9 erg cm-2 s-1), of which 44 have redshift identification. We observe a separation between the type-1 and the type-2 AGN in diagnostics involving different X-ray parameters. Using the subsample with known , we show that this separation between the AGN populations is a consequence of different absorption column densities. The two populations have the same average spectral index, . We present integrated spectrum for the most distant type-2 QSO with strong X-ray absorption and a clear soft excess; we obtained the best fit for these objects with two different models: a scattering model and a double power law model. We also confirm a progressive hardening for the combined integrated spectra for faint objects which at first was noted by [14]. Our results shown a clear evolution of decrease of with decreasing flux in the hard 2-10 keV band. However, we detect not only a regular increase of for different subsamples of fluxes in comparison with Chandra results, but also an internal discrepancy of the values, if we fitted in the different energy bands.
1 INTRODUCTION
Recent deep X-ray surveys with the Chandra and XMM-Newton observatories indicate that the bulk of the cosmic X-ray background (XRB) in the range 0.1-10 keV is the result of the integrated emission of discrete unresolved sources and accretion onto supermassive black holes over cosmic time. Such deep surveys allowed to reach extremely low flux levels and to resolve 80-90% of the XRB below 10 keV. From optical indentifications we know that the dominant population in these surveys is a mixture of obscured and unobscured AGN with an increasing fraction of obscuration at lower flux level (e.g. [15], [10], [2], [1] and [11]). Now, after resolving the majority of the XRB, the most interesting problem is to understand the physical nature of these sources, their X-ray and optical properties, relation, influence and cosmological evolution of their different parameters.
To this aim we have performed an X-ray spectral analysis of the CDFS faint sources with the purpose to characterize and classify the X-ray properties of different AGN populations. We search for relations between different X-ray physical parameters using the full X-ray sample, with additional analysis for the known subset.
2 X-RAY OBSERVATIONS
The Chandra Deep Field-South (CDFS) is a 0.1 deg2 area of the sky in the southern hemisphere has been studied intensively by means of a megasecond dataset from the Chandra Observatory ([3], [4], [10], [14], [15]). Recently the same field has been observed with the XMM-Newton Observatory. The XMM-Newton dataset has some specific advantages. In particular, the EPIC cameras have a larger field-of-view than ACIS allowing for the detection of a number of new diffuse sources just outside the Chandra field-of-view. The EPIC instruments have unprecedent high sensitivity in the hard X-ray band, and in the [5-10] keV band our dataset is comparable to the 1Ms Chandra image. Analysis of the Lockman Hole (LH; [7]) has also confirmed the idea that X-ray spectroscopy of a large number of sources is very powerful with XMM-Newton. The observed field was centered on the sky position RA 3:32:28 and DEC -27:48:30 (J2000). The CDFS was selected for its low galactic neutral hydrogen column density cm-2 ([10]), and a lack of bright foreground stars. The field has been observed with XMM-Newton for a total of 500 ksec in July 2001 and January 2002 in guaranteed observation time (PI: J.Bergeron), but due to high background conditions and flares, some data were lost and the exposure time for good quality observation added up to 370 ksec. The used dataset of the CDFS is the result of the coaddition of 8 individual exposures with aimpoints only a few arcsec from each other.
A large optical spectroscopic identification program has been carried out with the ESO Very Large Telescope (VLT) and the complete results of this campaign will be presented in [13].
3 X-RAY SAMPLE
We selected from our data a sample of 70 X-ray sources with more than 100 counts in the 0.2-10 keV energy band, of which 44 have been spectroscopicaly identified. Our full sample includes 29 Type-1 AGN (including 12 Type-1 QSOs), 10 Type-2 AGN (including 3 Type-2 QSOs), 28 unidentified sources, one normal galaxy and one star. The used classification scheme is the same as described in [13]. This work includes analysis of EPIC-pn data only.
The distribution of the CDFS sources peak at redshift below 1. This distribution confirm the already remarked disagreement between the prediction from X-ray background population synthesis models ([5]), with a maximum around , and the recent observations. Such a discrepancy was already noted for the 100 ksec observation of the Lockman Hole with XMM-Newton [8] and for the 1 Msec Chandra survey of the CDFS [10].
4 SPECTRAL ANALYSIS
We use an automated procedure to extract individual X-ray spectra and used XSPEC (v11.2) for the spectral fitting analysis. Initially, we fit the data with a model consisting of a power law with an intrinsic absorption (wabs or zwabs, if the redshift was known) component, with an additional photoelectric absorption component (wabs) that was fixed at the Galactic column density of cm-2. We used a scattering model when there was an unambiguous soft X-ray excess, which was present in several of the type-2 AGN.
4.1 Photon index and column density
From our model fits, we computed the slope of a power law spectrum (photon index ), an intrinsic column density , and the X-ray luminosity in the [0.5-2] and [2-10] keV rest-frame bands. The spectral analysis was performed for the both subsample with known redshifts and the remainder of the data set. Results are given in Figures 1 and Figures 2.

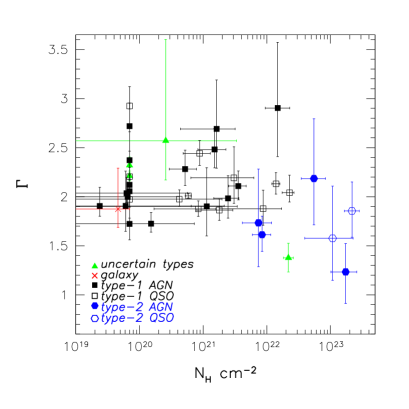
These plots show the differences between the observed values (when we assume that if we do not know redshift, and that the obtained is only a lower limit) and the proper values of in the source rest-frame (e.g. [8]).
The classical and obscured AGN populations show clearly different mean values of . We find no correlation between and the intrinsic absorption column density.
The resulting for the type-1 AGN range from 1.73 to 2.92, with the majority of the sources clustering around 2.07, i.e. close to the canonical value for broad line unabsorbed AGNs. For type-2 AGN we obtained a lower value, with average = 1.87. These results confirming the idea that the clear separation between the two AGN populations is due mostly to differences in the absorption column density, not in . In addition, the mean values of derived for both the known and unknown subsamples are approximately similar: we obtained with a large spread of . The average value of obtained from stacked technique is lower [15] because the signature of absorption is washed out (mainly a redshift effect).
All these results is consistent with similar analysis of the Lockman Hole [7].
5 INTEGRATED SPECTRA
5.1 Subsamples of the sources
As previously noted for the Chandra megasecond dataset ([14], [15] and [10] ), in both the hard (2-10 keV) and the soft (0.5-2 keV) bands the number of hard sources increases at lower fluxes. To better understand exactly how the spectrum of XRB is built up at different fluxes, [14] divided the hard-band sample into four subsamplesin in terms of the hard fluxes: bright (S 2 erg cm-2 s-1), medium ( 2 S 6 erg cm-2 s-1), faint (S 6 erg cm-2 s-1), and very faint (S 2 erg cm-2 s-1). Each of these samples was fit with an absorbed power law in the 1 to 10 keV energy range with the local absorption fixed to the Galactic value. [14] found a trends of hardening of the stacked spectra (decrease in ) with decreasing X-ray flux in the hard (2-10 keV) band. In order to investigate the behaviour of the spectral shape as a function of the hard flux, we repeated the same procedure that was used for the Chandra data set for the corresponding sources in our data set (assume that fluxes from XMM-Newton and Chandra datasets are equal). We use the catalog from [4] and fitted our data in the two energy bands: 1-8 keV (for comparison with results from the Chandra dataset) and 0.4-8 keV (include soft band). For a detailed description of the data reduction and analysis see [12]. The trend is apparent in Figure 3 where our results are compared to the corresponding results from the Chandra dataset.
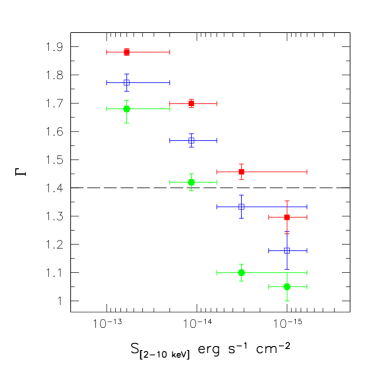
The best-fit slope of the stacked spectra for [1-8] keV is 1.773 0.031, 1.568 0.024, 1.333 0.041, and 1.178 0.031, respectively.
The average slope of the stacked spectra for [0.4-8] keV is 1.819 0.012, 1.699 0.014, 1.457 0.027, and 1.296 0.058, respectively.
We detect a significant hardening of the average spectral slope going to lower fluxes. However, we also detect not only a regular increase in with decreasing flux for different subsamples of fluxes in comparison with Chandra results, but we also see a discrepancy of the values within our own data set, if we fitted in the different energy bands.
5.2 Type-2 QSOs
The first examples of the long-sought class of type-2 QSO have been detected in two deep Chandra fields [9], [11] and in the XMM-Newton Deep survey in the Lockman Hole field [6]. In our field, at 2, there are six type-2 QSOs (XID 27, 54, 57, 202, 263, 112), the most famous of which is #202, founded and described in detail by [9]. All these objects have narrow Ly-α and CIV emission, -0.2, and faint optical magnitudes 24.0 [13].


The next step after investigating the individual spectra was to group the faint objects by source classification and combine their spectra in order to determine general spectral properties for each type of object. For the sake of brevity, we present here only the results for the Type- QSOs. The integrated spectra for the other object classes will be presented in a future paper.
All of the Type- QSO spectra were extracted simultaneously, and we assumed an average redshift for these objects of (Figures 4).
Our integrated absorbed spectrum shows a clear soft excess, which we fit by scattering model consisting of the sum of two power law components having the same spectral index but different normalizations and absorptions. One power law is absorbed by the Galactic column density only and the other is absorbed by a high intrinsic column density (a free parameter during the fit procedure). Our model yelds a good description of the data. Result is shown in Figures 5. Our spectrum (1175 EPIC-pn counts in the [0.3-8] keV band) is well fitted () by a scattering model with N cm-2, for the both component. It has L erg s-1 in the [2-10] keV rest-frame band.
We can test for self-consistency by fitting the spectra to more complicated spectral models. We chose to fit the spectrum to models consisting of two independent power-law components (), allowing their spectral parameters to vary independently, as the simplest way to test whether two components are required. If models in which the spectral ‘shapes’ differ significantly are preferred, then the observed excess low-energy fluxes are more probably due to separate components of emission than to scattering. Results are shown in Figures 6.
By fitting a double power law model we obtain: N cm-2, and for the hard component and for the soft component (). It has L erg s-1 in the [2-10] keV rest-frame band.
We can see that our more complicated spectral models not provide significantly better fits than the scattering model, which yelds a good description of the data. Thus, there is no reason to prefer a model with two components for this spectrum. In general, then, it seems that the single-component and scattering models are the simplest models which adequate describe the spectra, and assumption of more complicated models is not justified by these data.
6 CONCLUSIONS
In these proceedings, we present some of our results from an analysis of a ks XMM-Newton observation of the Chandra Deep Field-South. We have derived the X-ray spectral properties of a subsample of 70 sources, of which 44 have been spectroscopicaly identified. We exploited the known subsample using several X-ray diagnostics to characterise the different AGN populations.
The differences in parameter space between the type 1 and type 2 AGN are essentially due to variations in the absorption column density.
The average photon spectral index was found to be for both type 1 and 2 AGN.
Our analysis confirms the trend described by [15] of a hardening of the stacked spectra with decreasing X-ray flux in the hard (2-10 keV) band.
Our integral spectra for the most distant type-2 QSO shows a strong X-ray absorption and a clear soft excess, which we were able to fit well with a scattering model.
References
- [1] Barger, A. J., Cowie, L. L., Mushotzky, R. F., Richards, E. A. AJ 121 (2001) 662
- [2] Fiore, F., La Franca, F., Vignali, C., et al. New Astronomy, 5 (2000) 143F.
- [3] Giacconi, R., Rosati, P., Tozzi, P., et al. ApJ 551 (2001) 624.
- [4] Giacconi, R., Rosati, P., Tozzi, P., et al. ApJS 139 (2002) 369.
- [5] Gilli, R., Salvati, M., & Hasinger, G. A&A 366 (2001) 407.
- [6] Lehmann, I., Hasinger, G., Murray, S.S., Schmidt, M. Proceedings for X-rays at Sharp Focus Chandra Science Symposium (2002) [astro-ph/0109172]
- [7] Mainieri, V., Bergeron, J., Rosati, P., et al. A&A 393 (2002) 425.
- [8] Mainieri, V., Bergeron, J., Rosati, P., et al. Proceedings of the Symposium ‘New Visions of the X-ray Universe in the XMM-Newton and Chandra Era’ (2002), ESA SP-488, ed. F. Jansen, [astro-ph/0202211]
- [9] Norman, C., Hasinger, G., Giacconi R., et al. ApJ 571 (2002) 218.
- [10] Rosati, P., Tozzi, P., Giacconi, R., et al. ApJ 566 (2002) 667.
- [11] Stern D., Moran E.C., Coil A.L., et al. ApJ 568 (2002) 71.
- [12] Streblyanska, A., Bergeron, J., Hasinger, G., et al. (in prepatation) (2003)
- [13] Szokoly, G., Bergeron J., Hasinger, G., et al. ApJS (in prepatation) (2003)
- [14] Tozzi, P., Bergeron J., Borgani, S., Rosati, P., et al., Proceedings of the XXI Moriond Astrophysics Meeting (2001)
- [15] Tozzi, P., Rosati, P., Nonino, M., et al. ApJ 562 (2001) 42.