Reaching to the Edge of the Milky Way Halo with SDSS
Abstract
We discuss a sample of over 3000 candidate RR Lyrae stars selected by various methods using Sloan Digital Sky Survey data for about 1000 deg2 of sky. These stars probe the halo structure out to 100 kpc from the Galactic center. Their spatial and radial velocity distributions are very inhomogeneous, with the most prominent features tracing the Sgr dwarf tidal stream. Outside the Sgr dwarf tidal stream, the spatial distribution in the 5–60 kpc range of Galactocentric radius is well described by an power law.
1 Princeton University Observatory, Princeton, NJ 08544
2 University of Zagreb, Dept. of Physics, Bijenička cesta 32, 10000 Zagreb, Croatia
3 University of Chicago, Astronomy & Astrophysics Center, 5640 S. Ellis Ave., Chicago, IL 60637
4 University of Washington, Dept. of Astronomy, Box 351580, Seattle, WA 98195
1. Introduction
1.1. RR Lyrae Stars as a Probe of Galactic Halo
Studies of substructures, such as clumps and streams, in the Galactic halo can help constrain the formation history of the Milky Way (Helmi, White & Springel 2003, and references therein). Hierarchical models of galaxy formation predict that these substructures should be ubiquitous in the outer halo, where the dynamical timescales are sufficiently long for them to remain spatially and dynamically coherent (e.g. Johnston et al. 1996). Among the best tracers to study the outer halo are RR Lyrae stars because
-
•
They are nearly standard candles ( mag) and thus it is straightforward to determine their distance
-
•
They are sufficiently bright to be detected at large distances (5-100 kpc for ).
-
•
They are sufficiently numerous for detailed tracing of the halo structure (more so than e.g. C and M giants)
1.2. The Selection of Candidate RR Lyrae Stars Using SDSS Data
The Sloan Digital Sky Survey (SDSS; York et al. 2000, Azebajian et al. 2003, and references therein) is revolutionizing studies of the Galactic halo by providing homogeneous and deep () photometry in five passbands (, , , , and , Fukugita et al. 1996, Gunn et al. 1998) accurate to 0.02 mag (Ivezić et al. 2003a); ultimately, up to 10,000 deg2 of sky in the Northern Galactic Cap will be observed. The survey sky coverage will result in photometric measurements for over 100 million stars and a similar number of galaxies. Astrometric positions are accurate to better than 0.1 arcsec per coordinate (rms) for sources with (Pier et al. 2003), and the morphological information from the images allows robust star-galaxy separation to 21.5m (Lupton et al. 2001).
There are several methods for selecting candidate RR Lyrae stars using SDSS. While RR Lyrae stars are best found by obtaining well-sampled light curves, Ivezić et al. (2000) demonstrated that candidates can be efficiently and robustly found even with two-epoch data, using the accurate multi-band SDSS photometry. The robustness of their sample and efficiency estimates were later confirmed by the QUEST survey (Vivas et al. 2001). Furthermore, even when multiple SDSS imaging observations are unavailable, candidate RR Lyrae stars can be selected by comparing SDSS imaging and spectro-photometric magnitudes (Smolčić et al. 2003), SDSS imaging and POSS magnitudes (Sesar et al. 2003), and even by color selection from single-epoch data (Ivezić et al. 2003b). In this contribution we discuss over 3,000 candidate variable stars selected by comparing SDSS imaging data to another imaging epoch, or to spectro-photometric measurements, which are the most robust methods. For a subset of 700 of these stars SDSS also provides radial velocity measurements.
2. The Selection and Analysis of the SDSS RR Lyrae Candidates
2.1. Variability-selected Candidate RR Lyrae Stars
We used multiple SDSS imaging data and SDSS spectrophotometric measurements to select 3,127 RR Lyrae candidates in 1,000 deg2 of sky. The details of the selection are described in detail by Ivezić et al. (2000) and Smolčić et al. (2003). The sample completeness is about 35%, and its efficiency (the estimated fraction of true RR Lyrae stars) is about 90%.
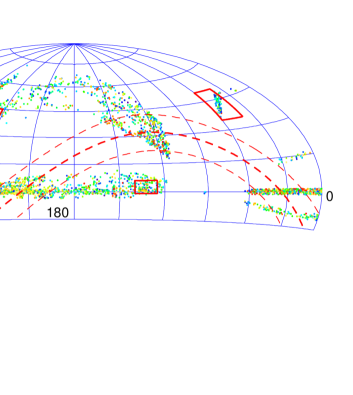
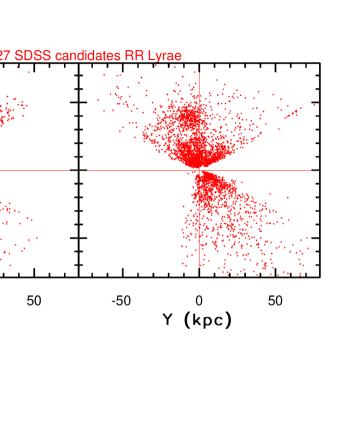
The overall distribution of the selected candidates on the sky is shown in Figure 1. The most significant feature, found at (R.A.218o, Dec0o), is the well-known clump associated with the Sgr dwarf tidal stream (Ivezić et al. 2000, Yanny et al. 2000, Vivas et al. 2001). It is easily visible in Figure 2 which shows two projections of the Galactic distribution for the same sample. The clump is at (X20 kpc, Y-10 kpc, Z40 kpc).
2.2. The Properties of the Sgr Dwarf Tidal Stream
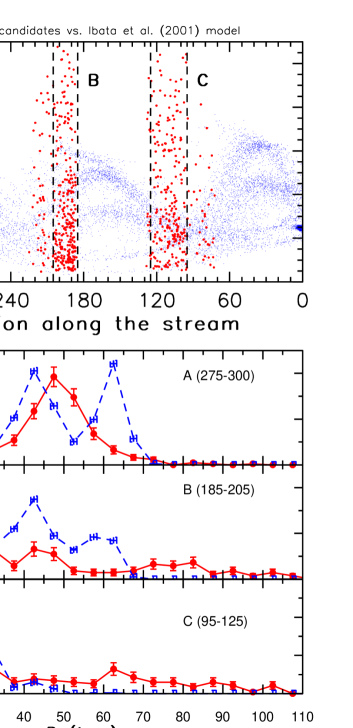
We select 1,157 stars that probably belong to the Sgr dwarf tidal stream by using a 20 degree wide strip along the great circle of its orbit, as shown in Figure 1. The distribution of distances along the stream (the origin corresponds to the main body of Sgr dwarf galaxy) is shown as large dots in the top panel of Figure 3. For an analogous plot showing other data, see Fig. 18 in Majewski et al. (2003, hereafter M03). The model prediction for the stellar distribution in this diagram by Ibata et al. (2001) is shown by small dots. The bottom panel shows marginal distance distributions for three segments (A, B, C), as marked in the panels. While there are some detailed disagreements between model and data, the model captures well the overall appearance of the data distribution. Most notably, there is good correspondence between multiple peaks in a given segment, suggesting that multiple streams are projected onto the great circle on the sky. However, this interpretation is not conclusive because such clumps may also be consistent with statistical fluctuations predicted by Bullock, Kravtsov & Weinberg (2001, BKW01).
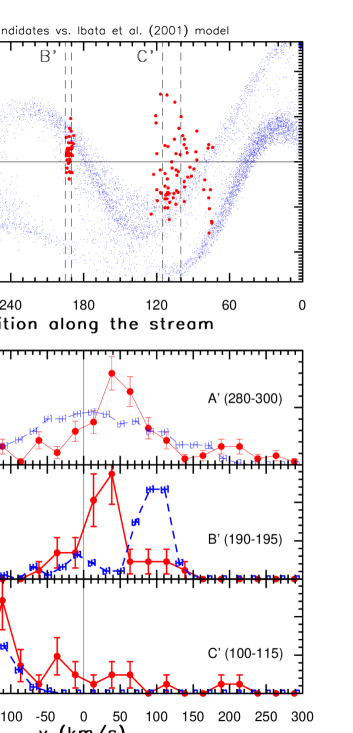
SDSS spectra, and thus radial velocity measurements (accurate to 20-30 km/s), are available for a subsample of 680 stars. The radial velocity distribution for the 305 stars that probably belong to the Sgr dwarf tidal stream is shown in Figure 4. Similar to the comparison of distance distributions, the model provides a good qualitative description of the data but fails to quantitatively match the peaks in the data distributions.
2.3. The Density Profile Outside the Sgr Dwarf Tidal Stream
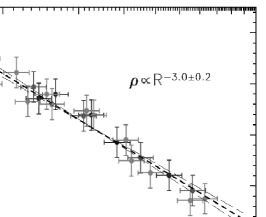
In order to estimate the density profile outside the Sgr dwarf tidal stream, we select four pencil beams marked in Figure 1. They contain 400 stars and span a large range of orientations with respect to the Galactic center. The Galactocentric density distribution along these four beams is shown in Figure 5. Remarkably, outside the Sgr dwarf tidal stream the density profile is well described by power law out to 60-70 kpc from the Galactic center, in agreement with previous work that probed inner 30 kpc (Wetterer & McGraw 1996, WMG96).
3. Discussion and Conclusions
SDSS is producing a large and robust catalog of distant RR Lyrae stars which allow detailed investigation of the halo out to 100 kpc. Only a few years ago there were no more than a handful of known RR Lyrae stars at distances greater than 30 kpc, (WMG96), and now there exists a sample of 500 confirmed halo RR Lyrae stars discovered by the QUEST survey (Vivas et al. 2001), and over the 3,000 probable RR Lyrae stars discussed here. These large and accurate samples are bound to enhance our understanding of the Galactic halo.
The spatial and radial velocity distributions of candidate RR Lyrae stars discussed here confirm that the Sgr Dwarf tidal stream is the most pronounced feature in the outer halo, in agreement with M03. The new data presented here are consistent with multiple perigalactic passages of the Sgr Dwarf, but a more detailed analysis of models such as those proposed by BKW01 is needed before definitive conclusions can be drawn. Models for the Sgr Dwarf tidal stream provide a good qualitative description of the data, but there is room for quantitative improvement. Outside this stream, an power law is a good description of the spatial distribution in the 5–60 kpc range of Galactocentric radius . Further out, in the range 60-100 kpc, the spatial distribution appears rather clumpy (see Figure 2), in qualitative agreement with predictions by BKW01.
Funding for the creation and distribution of the SDSS Archive has been provided by the Alfred P. Sloan Foundation, the Participating Institutions, the National Aeronautics and Space Administration, the National Science Foundation, the U.S. Department of Energy, the Japanese Monbukagakusho, and the Max Planck Society. The SDSS Web site is http://www.sdss.org/.
References
Azebajian, K., et al. 2003, AJ, in press
Bullock, J.S., Kravtsov, A.V., & Weinberg, D.H. 2001, ApJ, 548, 33 (BKW01)
Fukugita, M., et al. 1996, AJ, 111, 1748
Gunn, J.E., et al. 1998, AJ, 116, 3040
Helmi, A., White, S.D.M., & Springel, V. 2003, MNRAS, 339, 834
Ibata, R.A., et al. 2001, ApJ, 551, 294
Ivezić, Ž., et al. 2000, AJ, 120, 963
Ivezić, Ž., et al. 2003a, astro-ph/0301400
Ivezić, Ž., Vivas, A.K., Lupton, R.H. & Zinn, R. 2003b, submitted to AJ
Johnston, K.V., Hernquist, L., & Bolte, M., 1996, ApJ, 465, 278
Lupton, R.H. et al. 2001, ASP Conference Proceedings, Vol.238, p. 269.
Majewski, S. et al. 2003, astro-ph/0304198 (M03)
Pier, J.R. et al. 2003, AJ, 125, 1559
Sesar, B., et al. 2003, in prep.
Smolčić, V., et al. 2003, in prep.
Vivas, A.K. et al. 2001, ApJL, 554, L33
Yanny, B., et al. 2000, ApJ, 540, 825
York, D.G., et al. 2000, AJ, 120, 1579
Wetterer, C.J., & McGraw, J.T. 1996, AJ 112, 1046 (WMG96)