11email: jls@astrax.fis.ucm.es 22institutetext: The Pennsylvania State University, Department of Astronomy and Astrophysics, 525 Davey Laboratory, University Park, PA 16802, USA
Rotational modulation of the photospheric and chromospheric activity in the young, single K2-dwarf PW And ††thanks: Based on observations made with the 2.2m telescope of the German-Spanish Astronomical Centre, Calar Alto (Almería, Spain), operated by the Max-Planck-Institute for Astronomy, Heidelberg, jointly with the Spanish National Commission for Astronomy, with the Nordic Optical Telescope (NOT), operated on the island of La Palma jointly by Denmark, Finland, Iceland, Norway and Sweden, in the Spanish Observatorio del Roque de Los Muchachos of the Instituto de Astrofísica de Canarias, with the Isaac Newton Telescope (INT) operated on the island of La Palma by the Isaac Newton Group in the Spanish Observatorio del Roque de Los Muchachos of the Instituto de Astrofísica de Canarias, with the Italian Telescopio Nazionale Galileo (TNG) operated on the island of La Palma by the Centro Galileo Galilei of the INAF (Istituto Nazionale di Astrofisica) at the Spanish Observatorio del Roque de Los Muchachos of the Instituto de Astrofisica de Canarias and with the Hobby-Eberly Telescope (HET) operated by McDonald Observatory on behalf of The University of Texas at Austin, the Pennsylvania State University, Stanford University, Ludwig-Maximilians-Universität München, and Georg-August-Universität Göttingen. ††thanks: Tables 1, 3, and 4, and Figures 4, 7, 8, 14, 16, 18, 19, and 21 only available in electronic form at the CDS via anonymous ftp to cdsarc.u-strasbg.fr (130.79.128.5) or via http://cdsweb.u-strasbg.fr/cgi-bin/qcat?J/A+A/
High resolution echelle spectra of PW And (HD 1405) have been taken during eight observing runs from 1999 to 2002. The detailed analysis of the spectra allow us to determine its spectral type (K2V), mean heliocentric radial velocity ( km s-1) rotational velocity ( km s-1), and equivalent width of the lithium line ((Li I) = 273 mÅ). The kinematic (Galactic Velocity (,,)) confirms its membership of the Local Association moving group, in agreement with the age (30 to 80 Myrs) inferred from the color magnitude diagram and the lithium equivalent width. Photospheric activity (presence of cool spots that disturb the profiles of the photospheric lines) has been detected as changes in the the bisectors of the cross correlation function (CCF) resulting of cross-correlate the spectra of PW And with the spectrum of a non active star of similar spectral type. These variations of the CCF bisectors are related to the variations in the measured radial velocities and are modulated with a period similar to the photometric period of the star. At the same time, chromospheric activity has been analyzed, using the spectral subtraction technique and simultaneous spectroscopic observations of the H, H, Na i D1 and D2, He i D3, Mg i b triplet, Ca ii H&K, and Ca ii infrared triplet lines. A flare was observed during the last observing run of 2001, showing an enhancement in the observed chromospheric lines. A less powerful flare was observed on 2002 August 23. The variations of the chromospheric activity indicators seem to be related to the photospheric activity. A correlation between radial velocity, changes in the CCF bisectors and equivalent width of different chromospheric lines is observed with a different behaviour between epochs 1999, 2001 and 2002.
Key Words.:
stars: activity – stars: chromospheres – stars: spots – stars: late-type – stars: flare – stars: rotation1 Introduction
In spite of the fact that PW And (HD 1405) is a relatively bright star with a visual magnitude () of 8.6, it has not been well studied. It was included in the Henry Draper Catalogue as a G5 type star. However, other studies show that the spectral type is more similar to the Fehrenbach & Burnage (1982) classification of PW And as K3 while Christian et al. (2001) have it as a K0 type star with emission. No clear luminosity classification has been proposed but Hooten & Hall (1990) suggest it is a main sequence star due to its short-period photometric variations ( days). Christian et al. (2001) identify the EUVE source EUVE J0018+308 as PW And. This star was classified as a neighborhood Pleiades-age K2 dwarf by Ambruster et al. (1998). In this work we conclude from its position in the color magnitude diagram that PW And could be a pre-main sequence star. This is consistent with the equivalent width of the lithium line measured by Wichmann et al. (2003) and the abundance of lithium obtained by Ambruster et al. (1994), (Li i) = 3.00 dex.
With a rotational velocity () of 23.4 measured by Fekel (1997) this star is a good candidate for emission in chromospheric lines like Balmer and Ca ii H & K lines. Bidelman (1985) confirms the existence of moderate emission in the Ca ii H & K lines and Strassmeier et al. (1988) include PW And as a candidate in the first catalogue of Chromospherically Active Binary Stars. Nevertheless, studies by Fehrenbach & Burnage (1982) and Griffin (1992) fail to confirm a binary nature as the radial velocity () remains constant with a value of 11.5 and 10.5 respectively.
Space velocity components in addition to its luminosity class, rotational velocity, radial velocity as well as its chromospheric activity all indicate that PW And is a candidate for belonging to the Local Association stellar kinematic group (for a detailed reference see Montes et al. 2001a, b, hereafter M01a and M01b).
In this paper we are interested primarily in measuring the variations caused by magnetic activity in both the photospheric and chromospheric lines in the optical spectral region. At the same time we carry out a study of the fundamental properties of the star. This is accomplished using a large set of medium and high resolution echelle spectra that were obtained during eight observing runs from 1999 to 2002. This interval samples the rotational period during different epochs. The spectra analyzed here include all the optical chromospheric activity indicators from the Ca ii H & K to Ca ii IRT lines as well as the Li i 6707.8 line.
In Sect. 2 we give the details of our observations and data reduction. Stellar parameters determined by us (spectral type, luminosity class, rotational and radial velocities and age estimation) are given in Sect. 3. In Sect. 4 we present the study of the chromospheric activity indicators for each observing run, while flare events are studied in more detail in Sect. 5. Photospheric variations are discussed in Sect. 6, and Sect. 7 discusses how the photometric variations are related to the chromospheric variations. Finally in Sect. 8 we state the conclusions.
2 Observations and data reduction
The echelle spectra of PW And analyzed in this paper were obtained during eight observing runs which are described in detail in the below paragraphs.
1) 2.2m-FOCES 1999/07
This run took place on
24-29 July 1999 using the 2.2 m telescope at the German Spanish Astronomical
Observatory (CAHA) (Almería, Spain).
The Fiber Optics Cassegrain Echelle Spectrograph (FOCES)
(Pfeiffer et al. 1998)
was used with a 20482 15 LORAL11i CCD detector.
The wavelength range covers from
3910 to 9075 Å in 84 orders.
The reciprocal dispersion ranges from 0.03 to 0.07 Å/pixel
and the spectral resolution,
measured as the full width at half maximum (FWHM)
of the arc comparison lines, ranges from 0.09 to 0.26 Å.
2) NOT-SOFIN 1999/11
Observations taken on 26-27 November 1999
used the 2.56 m Nordic Optical Telescope (NOT) located
at the Observatorio del Roque de Los Muchachos (La Palma, Spain).
The Soviet Finnish High Resolution Echelle Spectrograph
(SOFIN) was used with an echelle grating (79 grooves/mm),
Astromed-3200 camera and a 1152770
pixel EEV P88200 CCD detector. The wavelength range covered is from
3525 to 10425 Å in 44 orders.
The reciprocal dispersion ranges from 0.06 to 0.17 Å/pixel
and the spectral resolution (FWHM) from 0.14 to 0.32 Å.
3) INT-MUSICOS 2000/08
Observations made on 5-11 August 2000
with the 2.5 m Isaac Newton Telescope (INT)
at the Observatorio del Roque de Los Muchachos (La Palma, Spain)
used the ESA-MUSICOS spectrograph.
This is a fibre-fed cross-dispersed echelle spectrograph,
built as a replica of the
first MUSICOS spectrograph
(Baudrand & Böhm 1992) and developed as part of
MUlti-SIte COntinuous Spectroscopy
(MUSICOS111http://www.ucm.es/info/Astrof/MUSICOS.html) project.
During this observing run,
a 10242 24 TEK5 CCD detector was used,
yielding a wavelength coverage from 4430 Å to 10225 Å in 73 orders.
The reciprocal dispersion ranges from 0.07 to 0.15 Å
and the spectral resolution (FWHM) from 0.16 to 0.30 Å.
4) NOT-SOFIN 2000/11
This run took place on 10-13 November 2000
with the 2.56 m Nordic Optical Telescope (NOT) located
at the Observatorio del Roque de Los Muchachos (La Palma, Spain).
The Soviet Finnish High Resolution Echelle Spectrograph
(SOFIN) was again used in the same configuration as in run (2).
5) 2.2m-FOCES 2001/09
These observations were made on 21-24 September
using the 2.2 m telescope at the German Spanish Astronomical
Observatory (CAHA) (Almería, Spain).
The Fibre Optics Cassegrain Echelle Spectrograph (FOCES)
(Pfeiffer et al. 1998)
was used with a 20482 24 Site1d CCD detector.
The wavelength range covers from
3510 to 10700 Å in 112 orders.
The reciprocal dispersion ranges from 0.04 to 0.13 Å/pixel
and the spectral resolution,
determined as the full width at half maximum (FWHM)
of the arc comparison lines, ranges from 0.08 to 0.35 Å.
6) SARG-TNG 2001/10
Observations were taken on 10-11 October 2001
with the 3.5 m Telescopio Nazionale Galileo (TNG) located
at the Observatorio del Roque de Los Muchachos (La Palma, Spain).
The Spectrografo di Alta Resoluzione Galileo (SARG)
was used with an echelle grating (31.6 grooves/mm, R4) and the red
cross-disperser (200 grooves/mm),
and a mosaic of two 2048X4096 CCDs with a 13.5 pixel size.
The wavelength range covers from 4960 to 10110 Å in 62 orders.
The reciprocal dispersion ranges from 0.02 to 0.04 Å/pixel
and the spectral resolution (FWHM) from 0.08 to 0.17 Å.
7) HET-HRS 2001/12 - 2002/02
Observations made on 19 December 2001 - 28 February 2002
using the 9.2 m Hobby-Eberly Telescope at McDonald Observatory
in Texas (USA) with the High Resolution Spectrograph (HRS).
The detector is a mosaic of two Marconi 4096 x 2048 CCDs with 15 micron
pixels (Tull 1998). The wavelength range covers from 5040 to 8775 Å
in 52 orders. The reciprocal dispersion ranges from 0.06 to 0.11 Å/pixel
and the spectral resolution (FWHM) from 0.15 to 0.28 Å.
8) NOT-SOFIN 2002/08
This took place on 21-29 August 2002
with the 2.56 m Nordic Optical Telescope (NOT) located
at the Observatorio del Roque de Los Muchachos (La Palma, Spain).
The Soviet Finnish High Resolution Echelle Spectrograph
(SOFIN) was used with an echelle grating (79 grooves/mm),
camera 2 and a 20522052
pixel PISKONOV Loral CCD detector.
The wavelength range covers from 3525 to 10200 Å in 42 orders.
The reciprocal dispersion ranges from 0.015 to 0.045 Å/pixel
and the spectral resolution (FWHM) from 0.05 to 0.15 Å.
The velocity resolution derived from the FWHM spectral resolution in the different observing runs ranges from 4 to 10 km s-1.
| Name | Day/Month | UT | ||
| (H&K) | (H) | |||
| 2.2m-FOCES 1999 | ||||
| PW And | 25 Jul | 04:09 | 23 | 123 |
| ” | 26 ” | 00:57 | 19 | 110 |
| ” | 27 ” | 02:25 | 13 | 85 |
| ” | 28 ” | 00:57 | 15 | 76 |
| ” | 29 ” | 03:01 | 21 | 122 |
| ” | 30 ” | 01:57 | 20 | 130 |
| GJ 706 | 25 Jul | 00:44 | 37 | 263 |
| ” | 25 ” | 20:07 | 35 | 176 |
| Oph * | 24 Jul | 23:48 | 31 | 182 |
| ” | 25 ” | 19:51 | 25 | 222 |
| ” | 25 ” | 19:55 | 25 | 268 |
| ” | 27 ” | 20:02 | 22 | 164 |
| ” | 28 ” | 19:57 | 39 | 332 |
| ” | 28 ” | 20:01 | 42 | 327 |
| ” | 29 ” | 19:46 | 32 | 314 |
| NOT-SOFIN 1999 | ||||
| PW And | 26 Oct | 20:24 | 25 | 107 |
| ” | 27 ” | 21:29 | 20 | 155 |
| HR 222 * | 26 Oct | 23:06 | 27 | 119 |
| INT-MUSICOS 2000 | ||||
| PW And | 11 Aug | 03:36 | - | 49 |
| ” | 14 ” | 03:31 | - | 69 |
| HR 222 * | 11 Aug | 03:20 | - | 119 |
| NOT-SOFIN 2000 | ||||
| PW And | 06 Oct | 01:35 | 7 | 129 |
| ” | 08 ” | 00:53 | 16 | 89 |
| ” | 09 ” | 00:03 | 8 | 101 |
| HR 222 * | 07 Oct | 01:44 | 11 | 234 |
| 2.2m-FOCES 2001 | ||||
| PW And | 23 Sep | 23:59 | 14 | 91 |
| ” | 25 ” | 02:03 | 16 | 99 |
| GJ 706 | 23 Sep | 19:52 | 23 | 149 |
| HR 166 * | 23 Sep | 23:50 | 30 | 174 |
| TNG-SARG 2001 | ||||
| PW And | 12 Oct | 04:05 | - | 65 |
| HR 222 * | 12 Oct | 04:30 | - | 136 |
| HET-HRS 2001-2002 | ||||
| PW And | 20 Dec | 04:12 | - | 239 |
| ” | 21 ” | 03:37 | - | 338 |
| ” | 22 ” | 03:44 | - | 252 |
| ” | 23 ” | 04:00 | - | 352 |
| ” | 26 ” | 03:09 | - | 184 |
| ” | 27 ” | 03:07 | - | 206 |
| ” | 28 ” | 03:31 | - | 278 |
| ” | 29 ” | 02:52 | - | 67 |
| ” | 30 ” | 02:59 | - | 101 |
| HD 92588 * | 14 Feb | 09:09 | - | 246 |
| NOT-SOFIN 2002 | ||||
| PW And | 22 Aug | 04:16 | 25 | 173 |
| ” | 23 ” | 04:24 | 21 | 161 |
| ” | 24 ” | 04:39 | 22 | 145 |
| ” | 25 ” | 01:55 | 14 | 105 |
| ” | 26 ” | 05:15 | 14 | 108 |
| ” | 26 ” | 05:37 | 12 | 77 |
| ” | 27 ” | 05:06 | 14 | 106 |
| ” | 28 ” | 04:19 | 19 | 151 |
| ” | 29 ” | 02:37 | 20 | 138 |
| HR 222 * | 22 Aug | 06:05 | 24 | 273 |
| ” | 23 ” | 06:06 | 20 | 302 |
| ” | 24 ” | 06:13 | 18 | 204 |
| ” | 25 ” | 02:31 | 32 | 277 |
| ” | 26 ” | 05:53 | 22 | 218 |
| ” | 27 ” | 06:04 | 22 | 219 |
| ” | 28 ” | 05:19 | 15 | 158 |
| ” | 29 ” | 03:04 | 25 | 182 |
Non-active stars used as reference stars in the spectral subtraction technique and the radial velocity standards used in the radial velocity determinations are listed in Tables 1 and 2. In Table 1 we give the observing log. For each observation we list date, UT and the signal to noise ratio () obtained in the Ca ii H & K and H line regions. The stars marked with * in the table are standard radial velocity stars taken from Beavers et al. (1979).
| Name | HD | SpT | – | – | ||||||
| (km s-1) | (days) | (km s-1) | (km s-1) | (km s-1) | (km s-1) | |||||
| PW And | HD 1405 | K2Va | 0.74b | 1.04c | 22.60.4a | 1.75d | -11.150.05a | -5.420.33a | -28.690.63a | -17.940.74a |
| Ref. Stars | ||||||||||
| HR 4182 * | HD 92588 | K1IV | ||||||||
| GJ 706 | HD 166620 | K2V | ||||||||
| HR 222 * | HD 4628 | K2V |
a This work.
b The – color index are obtained from the relation with spectral type given by Landolt-Börnstein (Schmidt-Kaler 1982).
c From Tycho-2 Catalogue (Hg et al. 2000).
d Photometric period calculated by Hooten & Hall (1990).
The spectra have been extracted using the standard reduction procedures in the IRAF222IRAF is distributed by the National Optical Observatory, which is operated by the Association of Universities for Research in Astronomy, Inc., under contract with the National Science Foundation. package (bias subtraction, flat-field division and optimal extraction of the spectra). The wavelength calibrations were obtained by taking spectra of a Th-Ar lamp. This lamp gives a very rich emission line spectrum over a wide wavelength range and is thus very useful for high resolution echelle spectra, including enough calibration lines in each order. The calibration was performed by fitting all the orders simultaneously (in both dispersion and cross dispersion directions) and the residuals obtained in the fit are typically lower than 0.04 Å. Finally, the spectra were normalized by using a cubic spline polynomial fit to the observed continuum. The points used to fit the continuum in each order are chosen in regions judged free of spectral lines to reduce as much as possible the effects of line blending.
3 Stellar parameters
3.1 Spectral type and luminosity class
To obtain an independent estimate of the spectral type of this star, we have compared our high resolution echelle spectra with that of inactive reference stars taken during the same observing run. The spectral type of the reference stars range from G to M, and the luminosity class from III to V. The analysis makes use of the program starmod developed at Penn State University (Barden 1985) and modified more recently by us. With this program a synthetic stellar spectrum is constructed from the artificially rotationally broadened, and radial-velocity shifted spectrum of an appropriate reference star. We obtained the best fit between observed and synthetic spectra when we use a K2-dwarf spectral type standard star. The uncertainty in this classification is of one spectral subtype as is typical in the MK spectral classification. In addition, in order to constrain the spectral type and luminosity class, several temperature-and gravity-sensitive photospheric lines have been studied in more detail and lead to a very similar result.
3.2 Radial velocity and space motion
Heliocentric radial velocities were determined using the cross-correlation technique. The spectra of the star were cross-correlated order by order, using the routine fxcor in IRAF, against spectra of radial velocity standards of similar spectral types (the stars marked with * in Tables 1 and 2) taken from Beavers et al. (1979). For each order, the velocity is derived from the position of the peak of the cross-correlation function (CCF) by fitting a Gaussian to the top of the function. Radial velocity errors are computed by fxcor based on the fitted peak height and the antisymmetric noise as described by Tonry & Davis (1979). The radial velocities calculated for each order are weighted by their errors, and a mean value is obtained for each observation (see the values given in Table 7 for three representative observing runs). Orders including chromospheric features and prominent telluric lines were excluded when determining this mean velocity. Finally, a weighted mean radial velocity is determined using all the observations from all the observing runs. In Table 2 we list this average heliocentric radial velocity (Vhel) and its associated error ().
As will be discussed in detail in Section 6 the presence of star-spots in the photosphere of this active star can disturb the profile of the photospheric lines and induce variations in the peak of the CCF which cause variations in the measured radial velocity. Differences up to 3 are measured in the spectra from the same observing run (see Table 7). As this is larger than the single measurement error these variations are attributed to asymmetry variations of the absorption lines caused by the stellar activity. In addition, variations up to 6 have been found in the radial velocities measured at different epochs (from 1999 to 2002). These variations can be attributed to a) the effects on the line profiles of changing levels of stellar activity (such as changes in the spot coverage) at different epochs, b) the use of different radial velocity standard which have different errors, or c) the changes in the zero-point offset of the different observing runs and spectrographs. However, the final mean radial velocity value we have obtained ( km s-1) is very similar to those given by Fehrenbach & Burnage (1982) ( km s-1) and Griffin (1992) ( km s-1). Therefore, the radial velocity we report in this paper not only confirms the previously-measured radial velocities, but allow us to conclusively state that this star is not a chromospherically active binary, as is suggested by Strassmeier et al. (1988), since the component radial velocity amplitude of these kind of binaries are typically much lager, ranging from 20 to 100 km s-1 (see Strassmeier et al. 1993).
We have used this mean radial velocity together with the spectroscopic parallax ( from Landolt-Börstein (Schmidth-Kaler 1982) for a K2 dwarf gives a distance d = 27.54 pc) and proper motions from the Tycho-2 (Hg et al. 2000) Catalogue, to calculate the Galactic space-velocity components (, , ) in a right-handed coordinated system (positive in the directions of the Galactic center, Galactic rotation, and the North Galactic Pole, respectively), as determined by M01a. The resultant new values are given in Table 2. Its position in the Galactic-velocity diagram confirms its membership in the Local Association moving group (see also M01b and López-Santiago et al. 2003). PW And is situated inside the subgroup B4 associated with the Pleiades cluster identified by Asiain et al. (1999).
3.3 Rotational velocity
Fekel (1997) measured the rotational velocity () of PW And obtaining a value of km s-1, assuming spectral type G5. The mean value from the five Coravel traces is km s-1 and Griffin (1992) determined km s-1. To determine an accurate rotational velocity of PW And, we again make use of the cross-correlation technique in our high resolution echelle spectra by using the routine fxcor in IRAF. In each one of the observing runs the observed spectra of PW And were cross-correlated against the spectrum of the template star and the width (FWHM) of CCF determined. The calibration of this width to yield an estimation of is done by cross-correlating artificially broadened spectra of the template star with the original template star spectrum. Broadened template spectra are created for spanning the expected range of values by convolution with a theoretical rotational profile (Gray 1992) using the program starmod. The resultant relationship between and FWHM of the CCF was then fitted with a fourth-order polynomial. We have tested this method with stars of known rotational velocity and have obtained good agreement. The uncertainties on the values obtained by this method have been calculated using the parameter defined by Tonry & Davis (1979) as the ratio of the CCF height to the rms antisymmetric component. This parameter is computed by the IRAF task fxcor and provides a measure of the signal to noise ratio of the CCF. Tonry & Davis (1979) show that errors in the FWHM of the CCF are proportional to and Hartmann et al. (1986) and Rhode et al. (2001) found that the quantity provides a good estimate for the 90 confidence level of a measurement. Thus, we have adopted as a reasonable estimate of the uncertainties on our measurements.
We have determined by this method in all the spectra available of PW And. Very similar values are obtained in spectra on different nights and at different epochs. The derived by this method is not affected by the asymmetry of the CCF caused by star-spots (see Section 6), since those changes are mainly in the peak of the CCF but the determination is based on the FWHM of the CCF. The resulting error weighted mean for all the observing runs is km s-1, which is the value given in Table 2. Our value is closer to the value given by Fekel (1997). The minimum radius () calculated using our value of and the by Hooten & Hall (1990) is R⊙, which is consistent with a K2 V spectral type. Adopting a radius R⊙ for a K2 dwarf from the Schmidt-Kaler (1982) tables, we obtain the inclination of the rotation axis for PW And. This is only an estimate, since the radius could be slightly different due to the possible pre-main sequence nature of this star inferred in the next subsection.

3.4 Estimation of age: the color-magnitude diagram
We estimate the age of PW And from the color-magnitude diagram ( vs. (–)). The value of has been adopted from Landolt-Börnstein tables (Schmidt-Kaler 1982) for a dK2 type star. The color index – (listed in Table 2) has been obtained from Tycho-2 Catalogue (Hg et al. 2000) using transformations from and to Johnson indexes (section 1.3 from Hipparcos Catalogue, ESA 1997). Pre-main sequence isochrones from Siess et al. (2000) have been adopted in Fig. 1 (see López-Santiago et al. 2003). The continuous line corresponds to the ZAMS and the dotted lines are 3, 10, 30 and 80 Myrs isochrones respectively (from top to bottom). In order to estimate the error bars for we have assumed a deviation of one spectral type from the dK2 suggested here (K1 to K3). Error in – index has been calculated taking into account errors in and given by Tycho-2 and their relation with –. PW And’s position in the diagram over the 30 Myrs isochrone (see Fig. 1) suggest that it is a pre-main sequence star. Even if we take into account the errors bars (or a large estimation of these) the star continue slightly above the ZAMS.

3.5 Estimation of age: the Li i 6707.8 line
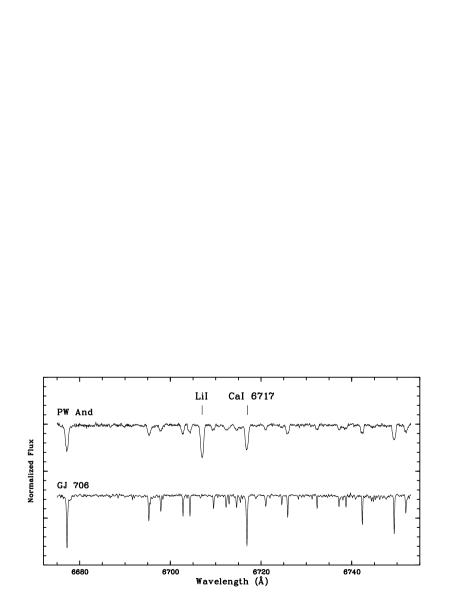
In order to further constrain the age for PW And, the equivalent width of the resonance doublet of Li i at 6707.8 Å has been measured. This line is included in our echelle spectra for all the observing runs and is an important diagnostic of age in late-type stars since the lithium is destroyed easily by thermonuclear reactions in the stellar interior. A representative spectrum in the Li i line region of the star is plotted in Fig. 2. As can be seen in this figure the Li i absorption line is very prominent in PW And in comparison with a reference star of the same spectral type. At this spectral resolution and with the rotational velocity of the star the Li i line is blended with the nearby Fe i 6707.41 Å line. We have corrected the total measured equivalent width, (Li i+Fe i), by subtracting the of Fe i calculated from the empirical relationship with (–) given by Soderblom et al. (1990). The error weighted mean value of the individual values of (Li i) measured on different nights and over different observing runs is mÅ. This value is a bit lower than that measured by Wichmann et al. (2003) of 273 mÅ and corrected for the contribution of the Fe i 6707.41 Å line. Our corrected (Li i) value has been converted into abundances by means of the curves of growth computed by Pallavicini et al. (1987). Adopting an effective temperature () of 4900 K for PW And, we have obtained (Li i) = 3.4 dex (on a scale where ). This estimation is considerably higher than the obtained by Ambruster et al. (1994) of dex, but these authors do not give any information about the temperature and the model they used.
We compare the (Li i) of PW And with those of well-known young open clusters of different ages. In the (Li i) versus spectral type diagram (Fig. 3) we have over-plotted the upper envelope of the (Li i) of IC 2602 (10-35 Myr), the Pleiades (78-125 Myr), and the Hyades (600 Myr), open clusters. For the Pleiades we adopt the upper envelope determined by Neuhäuser et al. (1997) with data from Soderblom et al. (1993) and García López et al. (1994) and the lower envelope given by Soderblom et al. (1993). In the case of IC 2602 we have adopted the upper envelope determined in M01b. Finally for the Hyades (600 Myr) we have used the upper envelope adopted by Soderblom et al. (1993).
The position of PW And close to the upper envelope of the Pleiades and under the upper envelope of IC 2602 (see Fig. 3) suggests an age similar to the stars in these clusters. Due to the large dispersion in (Li i) found for stars in young clusters, as in the case of IC 2602 (see M01b), we estimate an age for PW And between 30 to 80 Myrs, corresponding with the ages estimated for the IC 2602 and the Pleiades clusters. This is consistent with the space motion obtained in section 3.2 and the age obtained by its position in the color-magnitude diagram (Fig. 1).
| (Å) in the subtracted spectrum | ||||||||||
| MJD | Ca ii | Ca ii IRT | ||||||||
| K | H | H | H | H | H | H | 8498 | 8542 | 8662 | |
| 2.2m-FOCES 1999 | ||||||||||
| 51384.1732 | 1.780.09 | 1.170.04 | 0.310.01 | 0.270.01 | 0.290.01 | 0.470.01 | 1.390.04 | 0.490.01 | 0.630.01 | 0.520.01 |
| 51385.0401 | 1.360.16 | 0.990.06 | 0.330.02 | 0.280.01 | 0.280.01 | 0.450.01 | 1.260.03 | 0.510.01 | 0.630.01 | 0.560.01 |
| 51386.1011 | 1.980.27 | 0.930.05 | 0.320.02 | 0.260.01 | 0.290.01 | 0.510.02 | 1.350.03 | 0.500.01 | 0.660.01 | 0.530.01 |
| 51387.0396 | - | - | - | 0.280.02 | 0.270.01 | 0.440.01 | 1.230.03 | 0.470.01 | 0.620.01 | 0.550.01 |
| 51388.1258 | 1.970.12 | 0.820.02 | 0.260.01 | 0.240.01 | 0.260.01 | 0.480.01 | 1.200.03 | 0.470.01 | 0.610.01 | 0.520.01 |
| 51389.0818 | 2.180.32 | 1.680.03 | 0.330.04 | - | - | 0.470.01 | 1.360.04 | 0.490.01 | 0.680.01 | 0.530.01 |
| NOT-SOFIN 1999 | ||||||||||
| 51508.8690 | 2.430.21 | - | - | - | - | 0.710.02 | 1.580.04 | 0.580.01 | 0.780.06 | - |
| 51509.9022 | 2.360.14 | - | - | - | - | 0.710.04 | 1.540.04 | 0.530.01 | 0.910.02 | - |
| INT-MUSICOS 2000 | ||||||||||
| 51767.6572 | - | - | - | - | 0.170.01 | 0.490.01 | 1.180.02 | 0.490.01 | 0.720.02 | 0.590.02 |
| 51770.6541 | - | - | - | - | - | - | 0.840.05 | 0.790.11 | 0.660.06 | 0.890.10 |
| NOT-SOFIN 2000 | ||||||||||
| 51854.5731 | 0.980.19 | - | - | 0.200.04 | 0.280.06 | 0.510.02 | 1.390.03 | 0.490.01 | 0.730.02 | - |
| 51855.5441 | 1.200.17 | - | - | 0.250.03 | 0.230.03 | 0.540.02 | 1.330.03 | 0.470.01 | 0.760.04 | - |
| 51856.5440 | 1.040.12 | - | - | - | - | 0.600.02 | 1.200.03 | 0.450.01 | 0.650.03 | - |
| 51857.5090 | 1.190.19 | - | - | - | 0.300.05 | 0.540.02 | 1.480.04 | 0.480.01 | 0.670.02 | - |
| 2.2m-FOCES 2001 | ||||||||||
| 52176.4998 | 1.790.07 | 1.110.09 | 0.390.03 | 0.290.01 | 0.260.01 | 0.530.01 | 1.250.03 | 0.470.01 | 0.700.01 | 0.550.01 |
| 52177.5860 | 1.490.04 | 1.020.06 | 0.330.02 | 0.250.01 | 0.230.01 | 0.470.01 | 1.270.02 | 0.430.01 | 0.630.01 | 0.510.01 |
| HET-HRS 2001-2002 | ||||||||||
| 52263.6771 | - | - | - | - | - | - | 1.260.02 | 0.430.01 | 0.710.02 | 0.640.02 |
| 52264.6541 | - | - | - | - | - | - | 1.160.02 | 0.500.02 | 0.640.03 | 0.550.02 |
| 52265.6573 | - | - | - | - | - | - | 1.310.02 | 0.480.01 | 0.740.02 | 0.560.01 |
| 52266.6686a | - | - | - | - | - | - | 2.750.04 | 0.670.02 | 1.030.02 | 0.760.02 |
| 52269.6331 | - | - | - | - | - | - | 1.420.02 | 0.440.01 | 0.740.02 | 0.680.02 |
| 52270.6320 | - | - | - | - | - | - | 1.430.02 | 0.520.01 | 0.720.02 | 0.600.03 |
| 52271.6485 | - | - | - | - | - | - | 1.320.03 | 0.430.01 | 0.720.02 | 0.570.01 |
| 52272.6263 | - | - | - | - | - | - | 1.150.03 | 0.440.02 | - | 0.420.02 |
| 52273.6263 | - | - | - | - | - | - | 1.280.04 | 0.420.01 | 0.730.02 | 0.540.01 |
| NOT-SOFIN 2002 | ||||||||||
| 52508.6869 | 2.790.14 | - | - | - | - | 0.490.01 | 1.310.02 | - | - | - |
| 52509.6923a | 3.010.18 | - | - | - | - | 0.680.02 | 1.710.03 | - | - | - |
| 52510.7007 | 2.480.15 | - | - | - | - | 0.490.01 | 1.290.01 | - | - | - |
| 52511.5869 | 2.080.20 | - | - | - | - | 0.540.01 | 1.250.02 | - | - | - |
| 52512.7255 | 2.210.20 | - | - | - | - | 0.460.01 | 1.170.01 | - | - | - |
| 52512.7377b | 1.570.18 | - | - | - | - | 0.440.01 | 1.210.02 | - | - | - |
| 52513.7195 | 2.060.19 | - | - | - | - | 0.440.01 | 1.290.01 | - | - | - |
| 52514.6870 | 2.400.14 | - | - | - | - | 0.660.01 | 1.420.02 | - | - | - |
| 52515.6157 | 2.240.18 | - | - | - | - | 0.620.02 | 1.350.02 | - | - | - |
a Flare detected.
b Low S/N obtained.
| logFS (erg cm-2 s-1) | Excess Emission | |||||||||||||
| MJD | Ca ii | Ca ii IRT | ||||||||||||
| K | H | H | H | H | H | H | 8498 | 8542 | 8662 | |||||
| 2.2m-FOCES 1999 | ||||||||||||||
| 51384.1732 | 6.397 | 6.214 | 5.638 | 5.608 | 5.682 | 5.986 | 6.557 | 6.061 | 6.170 | 6.087 | 2.96 | 3.72 | 1.29 | |
| 51385.0401 | 6.280 | 6.142 | 5.665 | 5.624 | 5.667 | 5.967 | 6.514 | 6.078 | 6.170 | 6.119 | 2.80 | 3.53 | 1.24 | |
| 51386.1011 | 6.443 | 6.115 | 5.651 | 5.592 | 5.682 | 6.021 | 6.544 | 6.070 | 6.190 | 6.095 | 2.65 | 3.33 | 1.32 | |
| 51387.0396 | - | - | - | 5.624 | 5.651 | 5.957 | 6.504 | 6.043 | 6.163 | 6.111 | 2.80 | 3.52 | 1.32 | |
| 51388.1258 | 6.441 | 6.060 | 5.561 | 5.557 | 5.635 | 5.995 | 6.493 | 6.043 | 6.156 | 6.087 | 2.50 | 3.15 | 1.30 | |
| 51389.0818 | 6.485 | 6.372 | 5.665 | - | - | 5.986 | 6.547 | 6.061 | 6.203 | 6.095 | 2.89 | 3.64 | 1.39 | |
| NOT-SOFIN 1999 | ||||||||||||||
| 51508.8690 | 6.532 | - | - | - | - | 6.165 | 6.612 | 6.134 | 6.263 | - | 2.23 | 2.80 | 1.34 | |
| 51509.9022 | 6.519 | - | - | - | - | 6.165 | 6.601 | 6.095 | 6.330 | - | 2.17 | 2.73 | 1.72 | |
| INT-MUSICOS 2000 | ||||||||||||||
| 51767.6572 | - | - | - | - | 5.450 | 6.004 | 6.486 | 6.061 | 6.228 | 6.141 | 2.41 | 3.03 | 1.47 | |
| 51770.6541 | - | - | - | - | - | - | 6.338 | 6.268 | 6.190 | 6.320 | - | - | 0.84 | |
| NOT-SOFIN 2000 | ||||||||||||||
| 51854.5731 | 6.137 | - | - | 5.478 | 5.667 | 6.021 | 6.557 | 6.061 | 6.234 | - | 2.73 | 3.43 | 1.49 | |
| 51855.5441 | 6.225 | - | - | 5.574 | 5.581 | 6.046 | 6.538 | 6.043 | 6.251 | - | 2.46 | 3.10 | 1.62 | |
| 51856.5440 | 6.163 | - | - | - | - | 6.092 | 6.493 | 6.024 | 6.184 | - | 2.00 | 2.52 | 1.44 | |
| 51857.5090 | 6.222 | - | - | - | 5.697 | 6.046 | 6.584 | 6.052 | 6.197 | - | 2.74 | 3.45 | 1.40 | |
| 2.2m-FOCES 2001 | ||||||||||||||
| 52176.4998 | 6.399 | 6.192 | 5.737 | 5.639 | 5.635 | 6.038 | 6.511 | 6.043 | 6.216 | 6.111 | 2.36 | 2.97 | 1.49 | |
| 52177.5860 | 6.319 | 6.155 | 5.665 | 5.574 | 5.581 | 5.986 | 6.518 | 6.004 | 6.170 | 6.078 | 2.70 | 3.40 | 1.47 | |
| HET-HRS 2001-2002 | ||||||||||||||
| 52263.6771 | - | - | - | - | - | - | 6.514 | 6.004 | 6.222 | 6.177 | - | - | 1.65 | |
| 52264.6541 | - | - | - | - | - | - | 6.478 | 6.070 | 6.177 | 6.111 | - | - | 1.28 | |
| 52265.6573 | - | - | - | - | - | - | 6.531 | 6.052 | 6.240 | 6.119 | - | - | 1.54 | |
| 52266.6686a | - | - | - | - | - | - | 6.853 | 6.197 | 6.383 | 6.251 | - | - | 1.54 | |
| 52269.6331 | - | - | - | - | - | - | 6.566 | 6.014 | 6.240 | 6.203 | - | - | 1.68 | |
| 52270.6320 | - | - | - | - | - | - | 6.569 | 6.087 | 6.228 | 6.149 | - | - | 1.38 | |
| 52271.6485 | - | - | - | - | - | - | 6.534 | 6.004 | 6.228 | 6.126 | - | - | 1.67 | |
| 52272.6263 | - | - | - | - | - | - | 6.474 | 6.014 | - | 5.994 | - | - | - | |
| 52273.6263 | - | - | - | - | - | - | 6.521 | 5.994 | 6.234 | 6.103 | - | - | 1.74 | |
| NOT-SOFIN 2002 | ||||||||||||||
| 52508.6869 | 6.592 | - | - | - | - | 6.004 | 6.531 | - | - | - | 2.67 | 3.37 | - | |
| 52509.6923a | 6.625 | - | - | - | - | 6.146 | 6.647 | - | - | - | 2.51 | 3.17 | - | |
| 52510.7007 | 6.541 | - | - | - | - | 6.004 | 6.524 | - | - | - | 2.63 | 3.32 | - | |
| 52511.5869 | 6.464 | - | - | - | - | 6.046 | 6.511 | - | - | - | 2.31 | 2.92 | - | |
| 52512.7255 | 6.491 | - | - | - | - | 5.976 | 6.482 | - | - | - | 2.54 | 3.20 | - | |
| 52512.7377b | 6.342 | - | - | - | - | 5.957 | 6.497 | - | - | - | 2.75 | 3.46 | - | |
| 52513.7195 | 6.460 | - | - | - | - | 5.957 | 6.524 | - | - | - | 2.93 | 3.69 | - | |
| 52514.6870 | 6.526 | - | - | - | - | 6.133 | 6.566 | - | - | - | 2.15 | 2.71 | - | |
| 52515.6157 | 6.496 | - | - | - | - | 6.106 | 6.544 | - | - | - | 2.18 | 2.74 | - | |
a Flare detected.
b Low S/N obtained.
4 Chromospheric activity indicators
The activity of PW And was previously studied by Bidelman (1985) who reported moderate Ca ii H & K emission and the H line in emission. Chromospheric and transition region UV emission fluxes have been reported by Ambruster et al. (1998) and Wood et al. (2000). In addition, it has been detected by the ROSAT-satellite as the 2RE J001820+305 source (Pye et al. 1995; Kreysing et al. 1995; Thomas et al. 1998; Rutledge et al. 2000), and by the EUVE-satellite as the EUVE J0018+309 source (Malina et al. 1994; Christian et al. 2001).
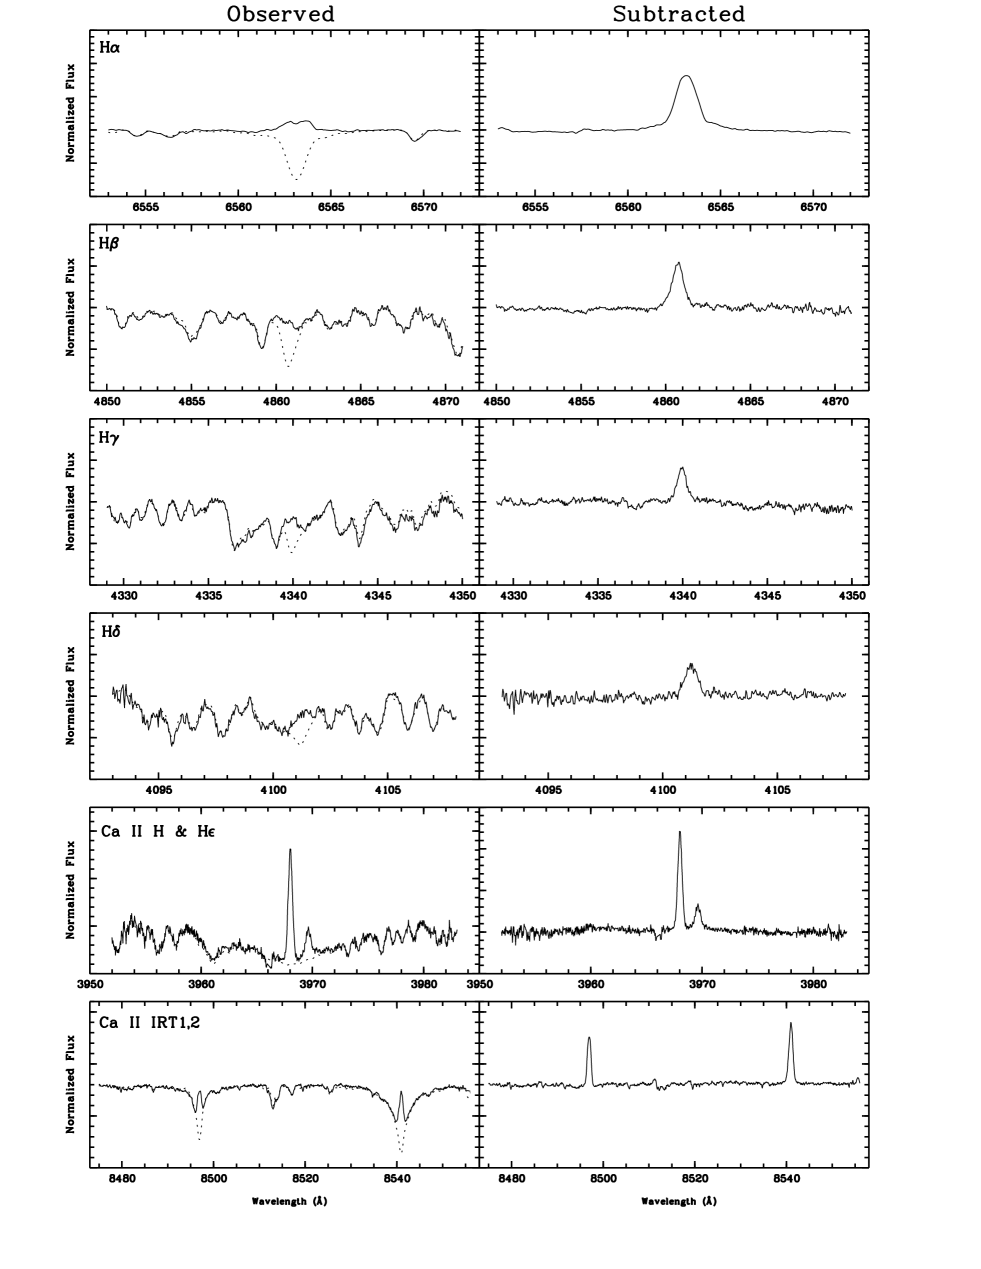
The echelle spectra analyzed in this paper allow us to study the behaviour of different optical chromospheric activity indicators from the Ca ii H & K to the Ca ii IRT lines, which are formed at different atmospheric heights. Using the spectral subtraction technique described by Montes et al. (1995; 1997; 1998; 2000) it is possible to study in detail the chromosphere, discriminating between different structures: plages, prominences, flares and microflares. The synthesized spectra were constructed using the program starmod developed at Penn State University (Barden 1985) and modified by us. The inactive stars used as reference stars in the spectral subtraction were observed during the same observing run than the active stars (listed in Table 1). Representative spectra in the Ca ii H & K, H, H, H, H and Ca ii IRT (8498, 8542) line regions of the quiescent state of PW And are presented in Fig. 4. For each region we have plotted the observed spectrum (solid-line) and the synthesized spectrum (dashed-line) in the left panel and the subtracted spectrum in the right panel. H emission above the continuum is detected showing an autoabsorption feature. Filled-in absorption in other Balmer lines is also detected, and strong emission is observed in Ca ii H & K, Hϵ and Ca ii IRT lines.
The equivalent width () (measured in the subtracted spectra) for the Ca ii H & K, H, H, H, H, H, and Ca ii IRT (8498, 8542, 8662) lines for each observation is given in Table 3. An estimate of the error for the can be obtained from the relation given by Cayrel (1988):
| (1) |
where is the FWHM of the line, the pixel size in Å, and / the signal-to-noise ratio per pixel in the continuum. With a typical of 1.35 Å for the H line, Å and for our observations, the error estimate is in the order of 6 mÅ. This equation does not take into account errors in the normalization, as well as possible blends, and must be used with the observed spectrum instead of the subtracted one. We have estimated the errors in the measured (see Table 3) taking into account the rms error obtained from the fit between observed and synthesized spectra in the regions outside the chromospheric features and the standard deviations resulting from the measurements. Deviations in the normalization, differences between the active and the reference stars, and internal precisions of starmod (0.5 - 2 km s-1 in velocity shifts, and 5 km s-1 in ) are taken into account by this method. Errors in the chromospheric features in the blue spectral region are larger due to the lower S/N of the spectra in this region. As an indication of the accuracy of the data, we give in Table 1 the S/N in the Ca ii H & K, and H line regions.
The EW have been converted to absolute chromospheric flux at the stellar surface by using the calibration of Hall (1996) as a function of (–). In Table 4 we give the absolute flux at the stellar surface (log) for the lines listed in Table 3.
In Table 4 we also give the ratio of excess emission , , for all the observations of PW And, and the ratio of the excess emission , and with the correction:
| (2) |
given by Hall & Ramsey (1992) that takes into account the absolute flux density in these lines and the color difference in the components.
We have used this ratio as a diagnostic for discriminating between the presence of plages and prominences on the stellar surface, following the results of Hall & Ramsey (1992) who found that low / ( 1-2) can be achieved both in plages and prominences viewed against the disk, but that high ratios ( 3-15) can only be achieved in extended regions viewed off the limb. The high ratio (/3, see Table 3) that we have found in PW And indicates that the emission would arise from extended regions (prominences). / ratios are in the range 1-2 which is indicative of optically thick emission in plage-like regions, in contrast with the prominence-like material inferred by the / ratios.
5 Flare state
Optical flares are commonly observed in dMe stars, however, in more luminous stars flares are usually only detected through UV or X-ray observations (e.g., Landini et al. 1986; Hünsch & Reimers 1995; Ayres et al. 1994). Optical flares are rare for K-type stars and only a few of them have been reported. Montes et al. (1999) detected a strong optical flare on LQ Hya, a K2 dwarf star very similar to PW And, with a duration of at least 5 hours.
Abbott et al. (1995) reported a photometric flare on PW And in the U band (). Two optical flares are detected on PW And in our data set. The first one was observed during the fourth night of the HET/HRS 12/2001 observing run (2001 December 23), and exhibited an enhancement in both H and the Ca ii IRT lines. The second flare was observed during the NOT-SOFIN 2002/08 observing run (2002 August 23) and while it appears to be a less powerful event it is possible that the flare maximum may have occurred between observations.


5.1 Description of the flare on 2001 December 23
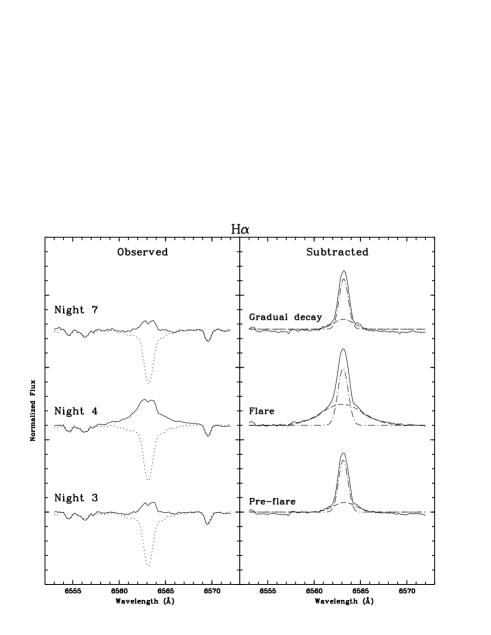
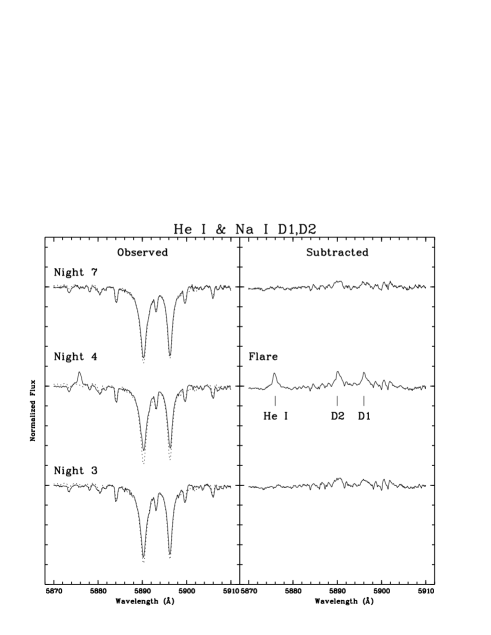
The H i Balmer lines are in emission in the observed and subtracted spectra at flare maximum and quiescent state as can be readily seen in Fig. 5 . On the other hand, Na i D1 and D2 lines are clearly revealed only in the subtracted spectra. The usual chromospheric flare diagnostic lines He i D3 and the Mg i b triplet are only observed at flare maximum. Observed and subtracted spectra in the region of He i D3 and Na i doublet are plotted in Fig. 6 for the quiescent state (night 3, 2001 Dec 22), flare maximum (night 4, 2001 Dec 23) and gradual decay (night 7, 2001 Dec 26).
The H emission equivalent width () in the subtracted spectra, increases a factor of 2.1 from the third to the fourth nights of the observing run (see Fig. 5 and Table 3), while the Ca ii IRT lines increases a factor of 1.4 (see Table 3). In Table 5 we list the measured of He i D3, Na i doublet and Mg i b triplet in the subtracted spectra for the flare spectra and the presumed quiescent spectra. Emission in the Na i doublet is observed in the subtracted spectra throughout the flare event, being stronger at flare maximum, (see Fig. 6) while emission in He i D3 and Mg i b triplet is present only at the observed flare maximum. The detection of prominent He i D3 emission indicates that we are observing an energetic flare in PW And, as this feature is typically only observed in flare events in very active stars such as RS CVn systems and UV Ceti flare stars (see Montes et al. 1999 and references therein). The Fe ii 5169 Å line near the Mg ii b triplet is also observed in emission at the flare maximum (see Table 5).
One notable feature is the existence of a broad emission component in both the subtracted and observed profiles in H at the flare maximum. A two Gaussian fit is necessary to obtain a good match to the total emission: a narrow component (N) having a FWHM of 59 km s-1 and a broad component (B) with FWHM 242 km s-1. The profile is also asymmetric with the B component blue-shifted. This could be interpreted as high velocity mass ejection (Houdebine et al. 1990) or high velocity chromospheric evaporation (Gunn et al. 1994). A broad emission component is also detected in the H subtracted profile during the gradual decay, yielding a FWHM of 53 km s-1 and 115 km s-1 respectively for the N and B components. Again, the profile is asymmetric with the B component showing a slight blue-shift. The presence of a red-shifted B component in the subtracted profile in night 3 suggest that the flare event might have begun this night, taking 24 hours to reach maximum (night 4). This red asymmetry is often interpreted as the result of chromospheric downward condensations (CDC) (Canfield et al. 1990 and references therein). No significant B component is observed in quiescent state. The (Hα) returns on night 10 to the same value as observed in the quiescent state in night 2 (see Table 3). Analyzing this data, we estimate a duration of approximately six days for this flare event.
In Table 6 we list the intensity (I), FWHM and of the B and N components and the shift between them ( - ), as well as the contribution of B and N components to the total in the H line. The total values of I, and are also given.
| Date | UT | He i D3 | Na i D1 | Na i D2 | Mg i b1 | Mg i b2 | Mg i b3 | Fe ii 5169 Å |
|---|---|---|---|---|---|---|---|---|
| HET-HRS 2001/12 | ||||||||
| 22 Dec (pre-flare) | 03:44 | - - | 0.0870.010 | 0.1230.012 | - - | - - | - - | - - |
| 23 Dec (flare max) | 04:00 | 0.2080.006 | 0.2550.006 | 0.2730.008 | 0.0420.001 | 0.0450.001 | 0.0620.001 | 0.0820.001 |
| 26 Dec (gradual decay) | 03:09 | - - | 0.0740.010 | 0.1020.014 | - - | - - | - - | - - |
| NOT-SOFIN 2002/08 | ||||||||
| 22 Aug (pre-flare) | 04:16 | - - | 0.0990.002 | 0.1470.002 | - - | - - | - - | - - |
| 23 Aug (flare max) | 04:24 | 0.0230.001 | 0.1120.002 | 0.1670.002 | - - | - - | - - | - - |
| 24 Aug (quiescent) | 04:39 | - - | 0.0930.001 | 0.1470.001 | - - | - - | - - | - - |
| H Total emission (T) | H Broad component (B) | H Narrow component (N) | |||||||||||||
| Date | UT | I | EW | I | FWHM | EW | B/T | I | FWHM | EW | N/T | ||||
| (Å) | (Å) | (Å) | % | (Å) | (Å) | % | - | ||||||||
| HET-HRS 2001/12 | |||||||||||||||
| 21 Dec (quiescent) | 03:37 | 0.75 | 1.16 | 6.478 | - | - | - | - | - | - | - | - | - | ||
| 22 Dec (pre-flare) | 03:44 | 0.82 | 1.31 | 6.531 | 0.13 | 2.94 | 0.41 | 31 | 0.72 | 1.18 | 0.90 | 69 | -0.14 | ||
| 23 Dec (flare max) | 04:00 | 1.06 | 2.75 | 6.853 | 0.29 | 5.29 | 1.66 | 60 | 0.79 | 1.30 | 1.09 | 40 | 0.10 | ||
| 26 Dec (gradual decay) | 03:09 | 0.81 | 1.42 | 6.566 | 0.14 | 2.52 | 0.37 | 26 | 0.69 | 1.16 | 1.05 | 74 | 0.04 | ||
| NOT-SOFIN 2002/08 | |||||||||||||||
| 22 Aug (pre-flare) | 04:16 | 0.83 | 1.31 | 6.531 | 0.06 | 4.98 | 0.31 | 24 | 0.80 | 1.23 | 1.00 | 76 | 0.76 | ||
| 23 Aug (flare max) | 04:24 | 0.96 | 1.71 | 6.647 | 0.09 | 5.16 | 0.48 | 28 | 0.90 | 1.28 | 1.23 | 72 | -0.40 | ||
| 24 Aug (quiescent) | 04:39 | 0.81 | 1.29 | 6.524 | - | - | - | - | - | - | - | - | - | ||
5.2 Description of the flare on 2002 August 23
The second flare occurred during the NOT-SOFIN 2002/08 observing run and appears to be a less energetic or more rapid event. The excess H emission in the subtracted spectra increases in a factor of 1.46 from the quiescent state to the flare maximum (significantly different from the 2.1 factor obtained in HET-HRS 2001/12).
In Table 5 we list the measured of He i D3 and Na i doublet in the subtracted spectra. The Mg i b triplet is not observed at this epoch due to a wavelength gap in the configuration of the spectrograph. Emission in the Na i doublet is observed in the subtracted spectra in both flare spectra and is stronger at flare maximum. The emission in He i D3 is present only in the flare maximum spectrum (see Fig. 8). The much lower (He i D3) and the increment in (Na i D1 & D2) measured at flare maximum both indicate a less energetic event than that observed on 2001 December 23.
As in the case of HET-HRS 2001/12 run, a broad emission component (B) in both the subtracted and observed H profile is present at flare maximum (see Fig. 7). The two-Gaussian fit used yields a FWHM 236 km s-1 for the B component and FWHM 58 km s-1 for the narrow one (N). In the pre-flare phase we obtain a FWHM for the N component of 56 km s-1, very similar to that obtained for N component in HET-HRS 2001/12 (53 km s-1). However, the FWHM of 228 km s-1 in the B component is very different of 134 km s-1 from HET-HRS 2001/12. No significant B component is detected on the night 3; 24 Aug. This suggests that flare maximum likely occurred between night 1 and night 2 and that the maximum observed on night 2 is part of the gradual decay phase. Thus, the duration of this event is between 2 and 3 days, shorter than in 2001/12. Contrary to what is observed in the HET-HRS 2001/12 event, the B component is blue-shifted in the pre-flare observation and red-shifted at the maximum (night 2). Different dynamic processes could be taking place during this flare event. Another possible explanation is that these asymmetries could be due the position of the active region over the disk.
In Table 6 we list the H line parameters I, FWHM, , and relative contribution of the B and N components, as well as the shift between them ( - ) during the flare. The total values of I, , and of the total excess H emission are also presented.
6 Photospheric variations
Since PW And is a young K2-dwarf with a rotational velocity of 22.6 km s-1, it is expected to show large dark photospheric spots which produce rotational modulation of the light coming from its surface. A photometric period was obtained by Hooten & Hall (1990) by fitting a sine curve to the data using a standard less squares technique. Values of 1.64 0.01, 29 1 and 1.745 0.005 days were calculated for three different epochs. They propose 1.745 days as the more reliable period is it had the least internal scatter.
To study spectroscopic variations produced by spots we have used the fact that cool spots moving across the disk of a star will produce a weaker contribution to the total integrated line profile. Thus the spectra -integrated over the disk will show a bump traveling across the profile as the star rotates. Two methods are commonly used to interpret this information. Doppler imaging was developed with the aim of obtaining a two dimensional picture of spots (Vogt & Penrod 1983, Vogt et al. 1987, Collier-Cameron & Unruh 1994, Rice et al. 1989, Strassmeier & Rice 1989). Here high signal-to-noise ratio (S/N) and resolution (/) are needed in order to obtain both accurate position and dimensional information on the spot(s). Another method, first used in the case of the Sun, can be adapted to stars using high / and S/N spectra (Toner & Gray 1988). The technique consists of calculating a bisector for line profile, i.e. the middle points of the line profile taking points of equal intensity in both sides of the line. Variations of the bisector are related to the existence of surface features moving across the disk, as seen in Boo A by Toner & Gray (1988) and in And by Donati et al. (1995). Both techniques have serious limitations (Dempsey 1991). Doppler imaging requires the star to be rotating rapidly km s-1 to give sufficient spatial resolution. Values of over 10-30 degrees are needed to guarantee high rotational broadening. However, the distortions induced by spots are of the order of 1-10 per cent of the continuum, and S/N 300 is required to detect them. Moreover, bisector analysis is only appropriate for very sharp lines, km s-1, restricting the candidates to the very slow rotators or stars with very low value of inclination. S/N 150 is also needed to apply this technique. A common problem with both techniques is the use of only one unblended line for the study, although several lines can be combined in order to obtain more accurate results.


| Date | UT | Phasea | |||
|---|---|---|---|---|---|
| (hh:mm) | (km s-1) | (Å) | (km s-1) | ||
| 2.2m-FOCES 1999 | |||||
| 25 Jul | 04:09 | -11.76 0.59 | 0.043 | 1.90 | 0.00 |
| 26 ” | 00:57 | -11.49 0.23 | -0.007 | -0.35 | 0.49 |
| 27 ” | 02:25 | -12.50 0.37 | 0.070 | 3.14 | 0.10 |
| 28 ” | 00:57 | -10.51 0.42 | -0.044 | -1.97 | 0.64 |
| 29 ” | 03:01 | -11.95 0.26 | 0.040 | 1.78 | 0.26 |
| 30 ” | 01:57 | -11.11 0.47 | 0.037 | 1.63 | 0.81 |
| HET-HRS 2001-2002 | |||||
| 20 Dec | 04:12 | -13.08 0.41 | 0.038 | 1.72 | 0.73 |
| 21 ” | 03:37 | -13.77 0.30 | 0.014 | 0.65 | 0.29 |
| 22 ” | 03:44 | -12.45 0.35 | -0.022 | -0.99 | 0.86 |
| 23 ” | 04:00 | -11.51 0.34 | -0.043 | -1.96 | 0.44 |
| 26 ” | 03:09 | -12.40 0.40 | 0.046 | 2.07 | 0.14 |
| 27 ” | 03:07 | -14.83 0.35 | 0.043 | 1.95 | 0.71 |
| 28 ” | 03:31 | -12.34 0.30 | -0.014 | -0.64 | 0.29 |
| 29 ” | 02:52 | -15.04 0.46 | -0.001 | -0.07 | 0.85 |
| 30 ” | 02:59 | -11.90 0.33 | -0.038 | -1.71 | 0.43 |
| NOT-SOFIN 2002 | |||||
| 22 Aug | 04:16 | -11.62 0.28 | 0.047 | 2.09 | 0.13 |
| 23 ” | 04:24 | -11.65 0.34 | 0.042 | 1.86 | 0.71 |
| 24 ” | 04:39 | -11.73 0.25 | 0.055 | 2.44 | 0.29 |
| 25 ” | 01:55 | -11.96 0.33 | 0.108 | 4.84 | 0.79 |
| 26 ” | 05:15 | -8.83 0.26 | -0.054 | -2.43 | 0.45 |
| 26 ” | 05:37 | -8.81 0.32 | -0.034 | -2.15 | 0.45 |
| 27 ” | 05:06 | -9.95 0.29 | 0.014 | 0.60 | 0.02 |
| 28 ” | 04:19 | -9.03 0.40 | -0.031 | -1.42 | 0.57 |
| 29 ” | 02:37 | -10.61 0.34 | 0.015 | 0.67 | 0.10 |
a days (from Hooten & Hall 1990).
A powerful method was developed and applied to several stars in the range of km s-1 by Dempsey et al. (1992) using a correlative analysis. A non active star (template) is cross-correlated with the active star producing a cross-correlation function (CCF). Variations in the peak of the CCF are related to changes in the line profiles caused by spots. To quantify the temporal variations in the CCF the bisector of the peak of the CCF can be calculated. This CCF bisector is not the same as the bisector described by Toner & Gray (1988), since the bisector of a line measures velocity fields while the CCF bisector quantifies the asymmetry of the CCF. The best results are obtained when both template and active stars have a similar spectral type. The advantage of this technique is the possibility of using many absorption lines for the calculation of the CCF (Dempsey et al. 1992). As the information of the lines is redundant, there is less restriction in the S/N (150). Resolution of / 40000 is sufficient to obtain accurate results. We employ this latter technique to study the effects of star-spots on the profiles of photospheric lines in PW And.
Three observing runs with the most extensive rotational phase coverage are used to study the effects of photospheric spots. These are the 2.2m-FOCES 1999/07, HET-HRS 2001/12 and NOT-SOFIN 2002/08 observations (see Section 2 and Table 1). The CCFs were determined using the IRAF routine fxcor in the same procedure as used in the determination of the radial velocities (see Section 3.2). Here we limit calculations to the wavelength regions ranging from 6300 to 6465 Å and 6670 to 6760 Å (see Fig. 11 and 16), which includes lines commonly used in Doppler imaging like Fe i lines in 6411.644 and 6430.841 Å and Ca i lines in 6439.073, 6462.566 and 6717.680 Å. The asymmetries of the CCF are very subtle in PW And necessitating calculation of its bisector. The determination of the CCF bisector has been carried out in the usual manner, taking points of equal intensity for the calculation of the middle points. For each point on the left of the CCFs, a matching point is found on the right using a cubic-spline interpolation (see Fig. 9). In order to quantify the changes in the CCF bisector, the difference between the mean of ten interpolated points in the top and in the base of the CCF bisector () has been measured. We have choose a fixed value of 0.2 as the base of the CCF (see Fig. 9) to avoid the noise at the zero level of the CCF. In the subsequent discussion the values of have been converted into velocities () for better understanding the science.
We have analyzed the CCF of each observing run separately, in order to avoid the possible slightly differences of the instrumental profile of the different spectrographs, and because the behaviour of the photospheric activity could be different at these three epochs separated by nearly three years.
6.1 CCF bisectors in the observing run 2.2m-FOCES 1999/07
The six observations over six nights cover almost three rotational cycles. GJ 706 (K2 V) has been used as template to calculate the CCF for PW And. In Fig. 10 we have plotted in phase the CCF bisectors and the values of using a period of days from Hooten & Hall (1990) with the time of the first observation () taken as phase 0.0.

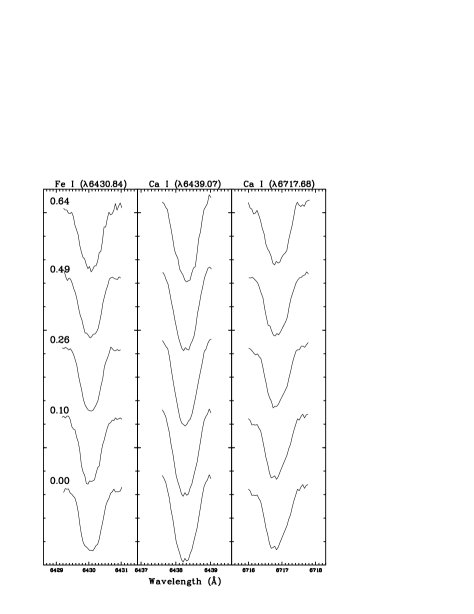
The maximum measured is 3.14 km s-1 (see Table 7) at phase 0.1, changing to -1.97 km s-1 at phase 0.64. The sequence is compatible with the existence of two spots at nearly opposite longitudes, one of them near the pole since a perturbation in the core of the line is present in every phase. In Fig. 11 we have plotted the profile of Fe i 6430.84 Å and Ca i 6439.07 and 6717.68 Å photospheric lines. A disturbance in the core of the Ca I lines, slightly shifted with phase, is clearly present for all phases.
The variations observed in the radial velocity (), determined as is explained in Section 3.2, are related to the existence of spots on the star. A clear correlation between and is evident (see Fig. 12).

6.2 CCF bisectors in the observing run HET-HRS 2001/12
Nine observations of PW And were obtained during this observing run covering 6.3 rotational periods with a gap of two days between nights 4 and 7. In order to obtain accurate results for CCF bisectors, the non-active star GJ 706 from 2.2m-FOCES 1999/07 was used as template. The spectrum of GJ 706 was convolved with a Gaussian in order to degrade the spectral resolution to the lower / in HET-HRS 2001/12.
CCF bisectors have been plotted in Fig. 13, using the same and as in 2.2m-FOCES 1999/07 with the aim of comparing both observing runs. In spite of the more than two years time difference, the change in the CCF bisector follows a sequence very similar to that for 2.2m-FOCES 1999/07 when arranged in phase. This could be due to the existence of large patterns of spots persisting with time, perhaps due to active longitudes.
As in the previous observing run, a correlation between and is found (see Fig.12). In this case the slope is different and, due to the lower spectral resolution of this run, a larger scatter in is observed.

6.3 CCF bisectors in the observing run NOT-SOFIN 2002/08
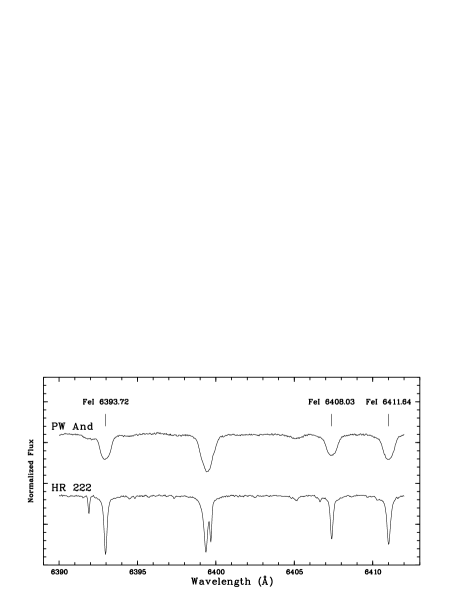
For this data set we used the template K2-dwarf star HR 222 (observed during every night) as both the radial velocity and spectral type standard in calculating the CCF. Due to a large gap in the spectral region between 6420 and 6540 Å caused by the configuration used here, a range from 6360 to 6415 Å has been used for measuring CCF bisectors instead of that employed in the previous observing runs. In this region the strong unblended Fe i lines 6393.72, 6408.03 and 6411.64 Å are present. The Fe i lines 6400.33 and 6400.01 are blended and have been rejected for this analysis (see Fig. 14).
As in the preceding cases, the photometric period of 1.745 days has been used to calculate the phase of the CCF bisectors. The results have been plotted using of 2.2m-FOCES 1999/07 as phase 0.0 (Fig. 15).
A clear difference in the phase between this and the previous observing runs is present. Nevertheless, the sequence is similar to that in HET-HRS 2001/12 and 2.2m-FOCES 1999/07. The maximum measured is 4.84 km s-1 (see Table 7) at phase 0.79. This is larger than the obtained on July 1999, and less than 2.50 km s-1 is measured for the rest of the phases. This suggests the presence of a large spot on the approaching limb.
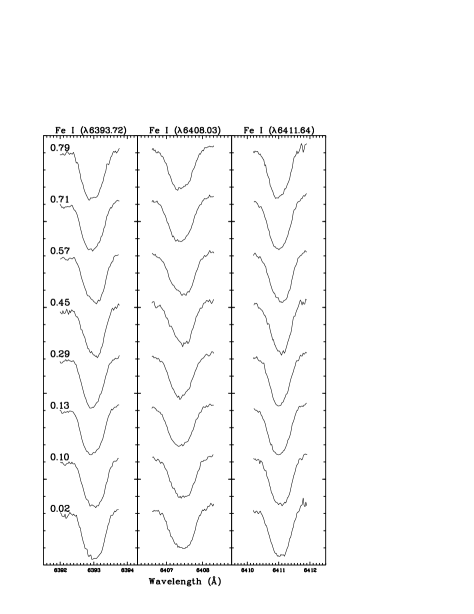
The spot disturbance in the line profile is not the same as in 2.2m-FOCES 1999/07. The presence of a perturbation in the core of absorption lines is not clear in Fig. 16, although a feature disturbing the profile is shown. There is no apparent evidence for a polar spot.
The correlation between and is plotted in Fig.12. In this case the slope of the line is similar to that of HET-HRS 2001/12 observing run. These changes in the slope from one observing run to another could indicate changes in the pattern of the spots at these epochs.

7 Relation between photospheric and chromospheric activity
When studying the chromospheric activity indicators in Section 4, variations in the of several lines, such as H, H and Ca ii H & K were found (see Tables 3 & 4). When arranged in phase, the (H) and (Ca ii H & K) appear to follow a clear sequence for each observing run. Comparison with results from the CCF bisectors shows a correlation between photospheric and chromospheric activity. In Figs. 17, 18 & 19 we have over-plotted and with the of chromospheric lines for each observing run.
7.1 2.2m-FOCES 1999/07
For this run we study the chromospheric lines H and Ca ii H & K in relation to the photospheric line behavior (see Fig. 17). The (Ca ii H) and (Ca ii K) have been summed together due to the low S/N of the continuum in this region of our spectra (see Table 1). Note that the of Ca ii lines could not be measured on night 4, which corresponds to phase 0.64.
A clear relation between (Ca ii H + K) and the variations in and is observed (see Fig. 17). For the H line, the relation is not as clear, but a similar trend is followed from phase 0.5 to 1.0. This supports the existence of active regions connected to the photospheric features. The presence of plage-like regions can be inferred from the variation on Ca ii H & K lines emission and this conjecture is further supported by the values of / calculated in Section 5 and listed in Table 4.

7.2 HET-HRS 2001/12
The chromospheric lines H and Ca ii 8542 Å are used for the comparison during this run since Ca ii H & K lines were beyond wavelength range observed in this epoch (see Section 2).
In Fig. 18 we have plotted the of these lines as well as CCF bisectors and . The Ca ii 8542 Å line does not appear to be a good indicator of changes in the activity of the star at this epoch. Only the flare on 2001 December 23, corresponding to phase 0.44, is clearly visible using this line. Taking into account that is a minimum at this phase, the flare occurred when the photospheric feature was near the limb.
Variations in H follow a pattern similar to that found in CCF bisectors and only up to phase 0.5. The less more patchy phase sampling in this data set makes any correlation less clear.

7.3 NOT-SOFIN 2002/08
For this observing run we have again the H and Ca ii K lines. The flare on 2003 August 23 corresponds to phase 0.71 and is clearly visible in both chromospheric lines (see Fig. 19). Contrary to the event in HET-HRS 2001/12, the flare does not appear to have occurred over the limb, but seems more associated with an active region on the disk. An overall correlation between both H and Ca ii K lines with CCF bisectors and is apparent. This suggests that the chromospheric active regions are connected to the photospheric features in the same way as 2.2m-FOCES 1999/07, although the correlation of H is perhaps more clear at this epoch.
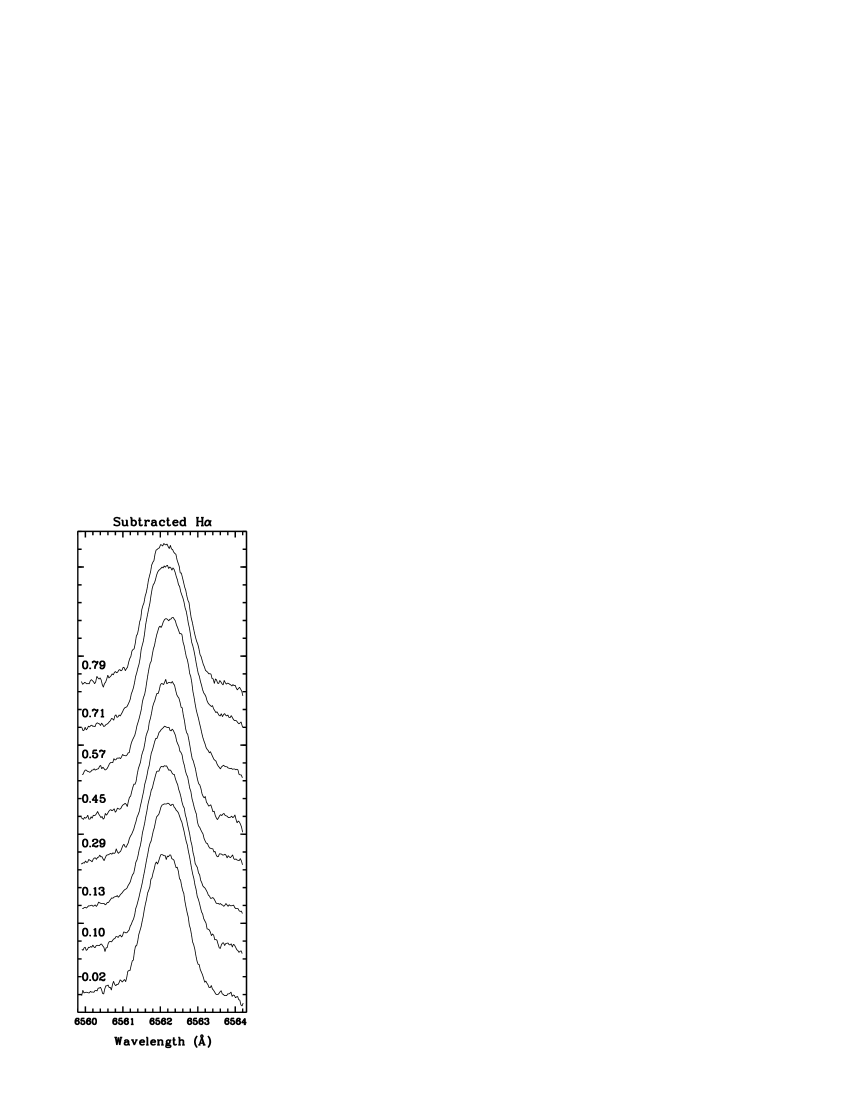
In order to look for any features in the H emission line that are related to the variations seen in the photospheric lines, we have applied the bisectors method to the emission profile in the subtracted spectrum (see Fig. 21). Again, for each point on the left of the H subtracted profile, a matching point on the right is found with a cubic-spline interpolation to obtain a bisector of the subtracted emission line. Any features moving across the profile must disturb this bisector in the same way as in the case of a CCF bisector. The resulting profile bisectors and are plotted in Fig. 20, using the same and as in Fig. 15. The scale of the bisectors has been changed to make it easier to see the curvature. Only the top of the profile is perturbed by the features, while the bottom is less sensitive, probably due to the difference in flux and S/N between the core and the wings of the emission. In order to avoid changes in the bottom of the profile bisector induced by changes in the broad component, as is present in the flare state, we have discarded 20 per cent of the bisector nearest the continuum. The sequence obtained in Fig. 20 is similar to that of Fig. 15 suggesting the presence of cool chromospheric material associated with the photospheric features. This is consistent with the results of the of chromospheric emission lines (see Fig. 19).


8 Conclusions
In this paper we have analyzed high resolution echelle observations, taken during the period 1999–2002, to describe in detail the activity on the young K2-dwarf star PW And. We also have presented new determinations of key physical parameters. In addition, a study of the lines profile has been carried out in order to relate the variations found in the heliocentric radial velocity () and chromospheric emission with the existence of photospheric features co-rotating with the star.
Radial velocity standard stars have been used to calculate accurate heliocentric radial velocities for each observation by using the cross-correlation technique. Variations in the up to 3 in the same observing run were found. The mean value of the velocities of all the observing runs (-11.15 0.05 ) is used to calculate the Galactic space-velocity components (,,) and confirms its membership to the Local Association moving group. By using the information provided by the width (FWHM) of the peak of the cross-correlation function (CCF), we have determined a projected rotational velocity, , of 22.6 . The radius for a K2V star () is compatible with the minimum radius ( R⊙) obtained from and the photometric period. The age of PW And has been bounded between 30 to 80 Myrs from its position in relation to pre-main sequence isochrones in the color magnitude diagram. The measured (Li I) of 273 mÅ indicates an age similar to that of the stars in the Pleiades cluster or younger, which is in agreement with the estimate from the color-magnitude diagram.
Using the spectral subtraction technique, all the optical activity indicators from the Ca ii H & K to Ca ii IRT lines have been analyzed. Strong emission in the observed spectra is present in H, Ca ii H & K and IRT, the remainder of the Balmer lines are clearly visible in emission in the subtracted spectra. The ratio that we have found in 2.2m-FOCES 1999/07 and NOT-SOFIN 2002/08 suggest that the emission of these lines could arise from prominence-like material, whereas the ratio of the excess emission indicates that the Ca ii IRT emission arise from plage-like regions. Two flares were detected in different epochs (2001 and 2002) which confirms the presence of strong magnetic activity on the star. At the same time, variations in (H) and (Ca ii H & K) are observed in all of the observing runs further confirming magnetic surface activity.
A detailed analysis of the profiles of the photospheric absorption lines have been done by calculating the bisectors of the CCF resulting of cross-correlate the spectra of PW And with the spectrum of a non active star of similar spectral type. These CCF bisectors change with a period similar to the photometric period of the star, suggesting the presence of features (probably cool dark spots) in the photosphere which are co-rotating with the star. The variations of the CCF bisectors found in the three epochs analyzed confirm the prevalence over time of large spots or the existence of active longitudes were spots are continuously being generated. The chromospheric active regions appear to be associated to the photospheric features, as a clear correlation between the variations observed in chromospheric activity and in the photospheric lines is found. Finally, variations in the bisector of the subtracted H line further support the presence of chromospheric active regions, related to the cool photospheric spots.
Acknowledgements.
We would like to thank M.Cruz Gálvez for help in the reduction of the observations, Dr. B.H. Foing for allowing us to use the ESA-MUSICOS spectrograph at Isaac Newton Telescope, and Dr. I. Ilyn for help with SOFIN spectrograph during the observations at the Nordic Optical Telescope (NOT). This work was supported by the Universidad Complutense de Madrid and the Spanish Ministerio de Ciencia y Tecnología (MCYT), Programa Nacional de Astronomía y Astrofísica under grant AYA2001-1448.References
- (1) Abbott, B. P., Pomerance, B. H., & Ambruster, C. W. 1995, BAAS, 27, 842
- (2) Ambruster, C. W. et al. 1994, ASP, 64, 348
- (3) Ambruster, C. W., Brown, A., Fekel, F. C., Harper, G. H., Fabian, D., Wood, B., & Guinan, E. F. 1998, in ASP Conf. Ser., 154, The Tenth Cambridge Workshop on Cool Stars, Stellar Systems, and the Sun, eds. R.A. Donahue & J.A. Bookbinder, CD-1205
- (4) Asiain, R., Figueras, F., Torra, J., Chen, B. 1999, A&A, 341, 427
- (5) Barden, S. C. 1985, ApJ, 295, 162
- (6) Ayres, T. R., Stauffer, J. R., Simon, T., Stern, R. A., et al. 1994, ApJ, 420, L33
- (7) Baudrand, J., & Böhm, T. 1992, A&A, 259, 711
- (8) Beavers, W. I, & Eitter, J. J. 1986, ApJS, 62, 147
- (9) Bidelman, W. P. 1985, AJ, 90, 341
- (10) Canfield, R. C., Kiplinger, A. L., Penn, M. J., Wülser, J. P. 1990, ApJ, 363, 318
- (11) Cayrel de Strobel, G., Spite, M. 1988, IAUS, 132, in: the proceedings of the International Astronomical Union. Symposium no. 132, Kluwer Academic Publishers, Dordrecht.
- (12) Christian, D. J., Craig, N., Dupuis, J., Roberts B. A., & Malina, R. F., 2001, AJ, 122, 378
- (13) Collier-Cameron, A., Unruh, Y. 1994, MNRAS, 269, 814
- (14) Dempsey, R. C. 1991, Ph.D. thesis, University of Toledo
- (15) Dempsey, R. C., Bopp, B. W., Strassmeier, K. G., Granados, A. F., Henry, G. W., & Hall, D. S. 1992, ApJ, 392, 187
- (16) Donati, J. -F., Henry, G. W., Hall, D. S. 1995, A&A, 293, 107
- (17) ESA, 1997, The Hipparcos and Tycho Catalogues, ESA SP-1200
- (18) Fekel, F. C. 1997, PASP, 109, 514
- (19) Fehrenbach, C., & Burnage, R. 1982, A&AS, 49, 483
- (20) García López, R. J., Rebolo, R., & Martín, E. L. 1994, A&A, 282, 518
- (21) Gray, D. F. 1992, The observation and analysis of stellar photospheres, 2nd ed. (Cambridge University Press)
- (22) Griffin, R. F. 1992, Obs, 112, 41
- (23) Gunn, A. G., Doyle, J. G., Mathioudakis M., Houdebine, E. R., Avgoloupis S. 1994, A&A, 285, 489
- (24) Hall, J. C., & Ramsey, L. W. 1992, AJ, 104, 1942
- (25) Hall, J. C. 1996, PASP 108, 313
- (26) Hartmann, L., Hewett, R., Stahler, S., & Mathieu, R. D. 1986, APJ, 309, 275
- (27) Houdebine, E. R., Foing, B. H., Rodonó, M. 1990, A&A, 238, 249
- (28) Hg, E., Fabricius, C., Makarov, V. V., et al. 2000, A&A, 355, L27
- Hooten & Hall (1990) Hooten, J. T. & Hall, D. S. 1990, ApJS, 74, 225
- (30) Hünsch, M., & Reimers, D. 1995, A&A, 296, 509
- (31) Kreysing, H. -C., Brunner, H., & Staubert, R. 1995, A&AS, 114, 465
- (32) Landini, M., Monsignori Fossi, B. C., Pallavicini, R., Piro, L. 1986, A&A, 157, 217
- (33) López-Santiago, J., Montes, D., et al. 2003, (in preparation)
- (34) Malina, R. F., Marshall, H. L., Antia, B., et al. 1994, AJ, 107, 751
- (35) Montes, D., Fernández-Figueroa, M. J., De Castro, E., & Cornide, M. 1995, A&A, 294, 165
- (36) Montes, D., Fernández-Figueroa, M. J., De Castro, E., & Sanz-Forcada, J. 1997, A&AS, 125, 263
- (37) Montes, D., Sanz-Forcada, J., Fernández-Figueroa, M. J., De Castro, E., & Poncet, A. 1998, A&A, 330, 155
- (38) Montes, D., Saar, S. H., Collier Cameron, A., Unruh, Y. C., 1999, MNRAS, 305, 45
- (39) Montes, D., Fernández-Figueroa, M. J., De Castro, E., Cornide, M., Latorre, A., & Sanz-Forcada J. 2000, A&AS, 146, 103
- (40) Montes, D., López-Santiago, J., Gálvez, M. C., Fernández-Figueroa, M. J., De Castro, E., Cornide, M. 2001a, MNRAS, 328, 45
- (41) Montes, D., López-Santiago, J., Fernández-Figueroa, M. J., Gálvez, M. C. 2001b, A&A, 379, 976
- (42) Neuhäuser, R., Torres, G., Sterzik, M. F., Randich, S. 1997, A&A, 325, 647
- (43) Pfeiffer, M. J., Frank, C., Baumueller, D., Fuhrmann, K., & Gehren, T. 1998, A&AS, 130, 381
- (44) Pallavicini, R., Cerruti-Sola, M., Duncan, D. K. 1987, A&A, 174, 116
- (45) Pye, J. P., McGale, P. A., Allan, D. J., et al. 1995, MNRAS, 274, 1165
- (46) Rhode, K. L., Herbst, W., & Mathieu, R. D. 2001, AJ, 122, 3258
- (47) Rutledge, R. E., Brunner, R. J., Prince, T. A., & Lonsdale, C. 2000, ApJS, 131, 335
- (48) Tonry, J., & Davis, M. 1979, AJ, 84 1511
- (49) Thomas, H. -C., Beuermann, K., Reinsch, K., Schwope, A. D., Trümper, J., & Voges, W. 1998, A&A, 335, 467
- (50) Rice, J. B., Wehlau, W. H., Khokhlova, V. L. 1989, A&A, 208, 179
- (51) Schmidt-Kaler, T. 1982, in Landolt-Börstein, 2b, ed. K. Schaifers, & H. H. Voig (Heidelberg: Springer)
- (52) Siess, L., Duffour, E., Forestini, M. 2000, A&A, 358, 593
- (53) Soderblom, D. R., Oey, M. S., Johnson, D. R. H., Stone, R. P. S. 1990, AJ, 99, 595
- (54) Soderblom, D. R., Jones, B. F., Balachandran, S., Stauffer, J. R., Duncan, D. K., Fedele, S. B., & Hudon, J. D. 1993, AJ, 106, 1059
- (55) Strassmeier, K. G., Hall, D. S., Zeilik, M., Nelson, E., Eker, Z., & Fekel, F. C. 1988, A&AS, 72, 291
- (56) Strassmeier, K. G., Hall, D. S., Fekel, F. C., & Scheck, M., 1993, A&AS 100, 17
- (57) Strassmeier, K. G., & Rice, J. B. 1998, A&A, 339, 497
- (58) Toner, C., & Gray, D., F. 1988, ApJ, 334, 1008
- (59) Tull, R. G. 1998, in the proceedings of SPIE, The International Society for Optical Engineering, Vol. 3355, p. 387
- (60) Vogt, S. S., & Penrod, G. D. 1983, ASP, 95, 565
- (61) Vogt, S. S., Penrod, G. D., Hatzes, A. P. 1987, ApJ, 321, 496
- (62) Wichmann, R., Schmitt, J.H.M.M., and Hubrig, S. 2003, A&A, 399, 983
- (63) Wood, B. E., Ambruster, C. W., Brown, A, & Linsky, J. L. 2000, ApJ, 542, 411