Color–selected galaxies at in the Great Observatories Origins Deep Survey 11affiliation: Based on observations taken with the NASA/ESA Hubble Space Telescope, which is operated by AURA, Inc., under NASA contract NAS5–26555; from the W. M. Keck Observatories; and from the Very Large Telescope (VLT) at Cerro Paranal, Chile, operated by the European Southern Observatory, under programs 170.A-0788 and 168.A-0485.
Abstract
We report early results on galaxies at , selected from Hubble Space Telescope imaging for the Great Observatories Origins Deep Survey. Spectroscopy of one object with the Advanced Camera for Surveys grism and from the Keck and VLT observatories a shows a strong continuum break and asymmetric line emission, identified as Ly at . We detect only five spatially extended, candidates with signal–to–noise ratios , two of which have spectroscopic confirmation. This is many fewer than would be expected if galaxies at had the same luminosity function as those at . There are many fainter candidates, but we expect substantial contamination from foreground interlopers and spurious detections. Our best estimates favor a galaxy population with fainter luminosities, higher space density, and similar co–moving ultraviolet emissivity to that at , but this depends critically on counts at fluxes fainter than those reliably probed by the current data.
1 Introduction
Broad band color selection, based on ultraviolet (UV) spectral breaks caused by neutral hydrogen, is an efficient technique for identifying galaxies at to 4 with imaging from the ground and from the Hubble Space Telescope (Steidel et al. 1996; Madau et al. 1996). At higher redshifts and relatively bright magnitudes, colors from the Sloan Digital Sky Survey have been used to identify QSOs out to (Fan et al. 2003). Some galaxies at have also been found in this way, but the required deep imaging and spectroscopy is extremely challenging. A Lyman break galaxy (LBG) with typical () UV luminosity at (, Adelberger & Steidel 2000) would have if moved, without evolution, to , and would be undetected in the –band (hence, an “–dropout”). At , Ly shifts through the –band, and galaxies are lost to optical sight altogether.
One goal of the Great Observatories Origins Deep Survey (GOODS) is to find and study large numbers of galaxies at . Here, we report initial results from GOODS on galaxy candidates at , including spectroscopy for one galaxy, CDFS J033240.0274815 (henceforth SiD2), with the ACS grism and the Keck and VLT observatories. We use AB magnitudes (AB ), and assume a cosmology with and km s-1 Mpc-1.
2 Imaging, photometry, and color–selection
The GOODS Treasury program covers areas around the Chandra Deep Field South (CDF–S) and Hubble Deep Field North (HDF–N) with mosaics of ACS images. The observations, data reduction, and catalogs are described in Giavalisco et al. (2003a). Our present analysis uses 3–epoch co-added images for both fields, with 3, 1.5, 1.5 and 3 orbit depth in the F435W, F606W, F775W, and F850LP filters (henceforth , , , and ). After discarding regions near the image borders or without 4–band coverage, the survey solid angle is 316 arcmin2. We detect objects in the images using SExtractor (Bertin & Arnouts 1996), and measure photometry through matched apertures in all bands. Here, we use “total” magnitudes (SExtractor MAG_AUTO), and colors measured through isophotal apertures defined in the image.
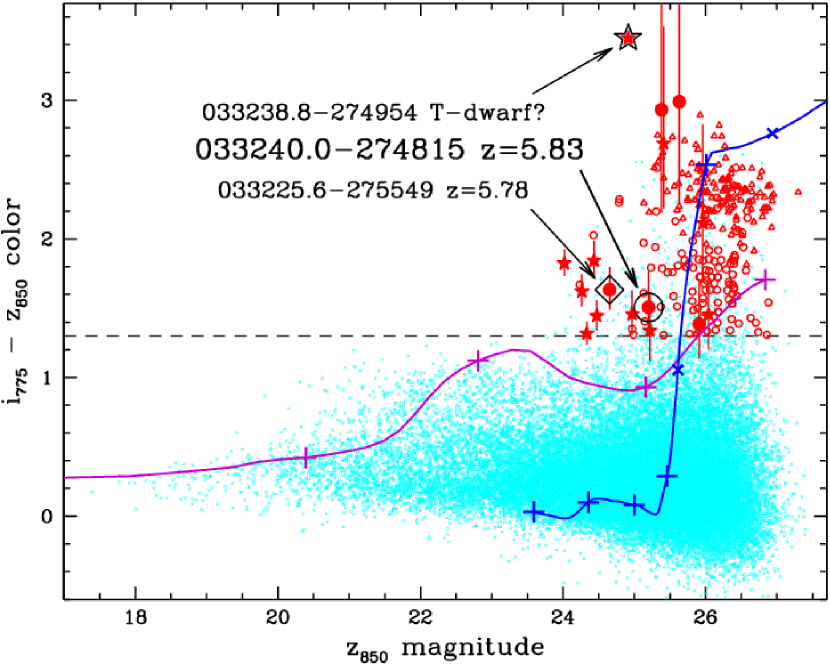
We estimate the reddest colors expected for ordinary galaxies with spectral templates (Coleman, Wu & Weedman 1980) integrated through the ACS bandpasses. The redshifted colors of an elliptical galaxy peak111 The redshifted elliptical template has redder colors at , but the UV spectrum of any galaxy at that redshift is unlikely to resemble that of an old elliptical at . at for . There is only one “bright” galaxy in the GOODS fields with (; ). It is well detected at , bright in the near–infrared (IR), and certainly has . Redder colors may be explained by dust obscuration, high metallicity, strong line emission in the –band, or intergalactic medium (IGM) absorption at high redshift. For the range of intrinsic UV colors seen for LBGs at , is crossed at to 5.7. Cool stellar dwarfs may also be this red. Fan et al. (2003) Figure 2 shows that only a tiny minority of high-latitude stars have , and our ACS imaging provides a robust measure of stellarity for .
Our current ACS mosaics have very small misalignments between images from different observing epochs. These can trigger over–rejection in the cores of point sources during cosmic ray removal in the and bands (only – the and images are reduced differently). There is virtually no photometric impact for extended sources (Giavalisco et al. 2003a), but the colors of brighter stars can be biased redward, and we treat them with caution here.
We are interested in objects near our detection limits. The signal–to–noise ratio () of a measurement depends on the source flux and size, and on the exposure time, which varies with position in our mosaics. The significance of a source is best estimated not from its magnitude, but from in the detection aperture. Our photometric errors are computed from noise maps which account for inter-pixel correlations. To verify their reliability, we added artificial objects to the images (only) and detected them with SExtractor. Background–subtracted counts () were measured through matched apertures for the other bands, and compared to the predicted uncertainties () from the noise maps. The distribution of is nearly Gaussian with mode and RMS , showing that our error estimates are reliable, except for a positive tail due to blending with other objects. Because of this tail, 14% of galaxies would have in the or bands.222On average, this limit corresponds to or . We consider this an acceptable loss rate, and adopt and as our –dropout criteria (Figure 1).
3 Spectroscopy
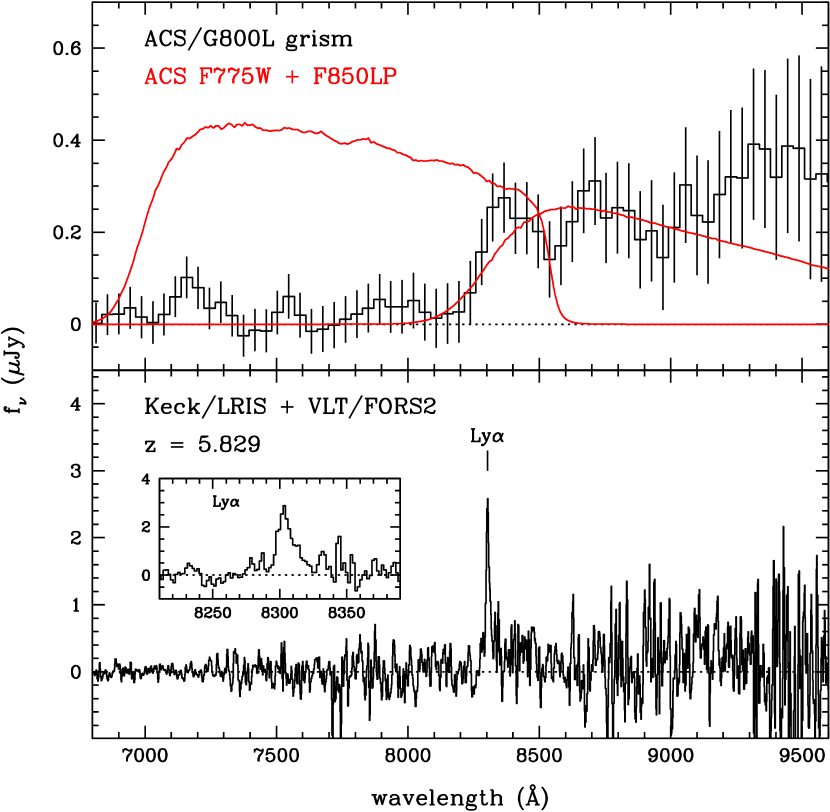
Supernovae found in GOODS ACS imaging are studied in a target–of–opportunity program which, in some cases, obtains low–resolution, slitless spectra with the ACS G800L grism. One grism observation (SN2002FW, Riess et al. (2003)) included SiD2, which we had noted as an –dropout candidate. The data were obtained on UT 2002 October 01, with an exposure time of 18840s, and were reduced with the calacs pipeline and the aXe extraction software. The G800L spectrum (Figure 2) shows a flat continuum with a sharp break at Å, explaining the red color.
We observed SiD2 with the Low Resolution Imaging Spectrometer (LRIS; Oke et al. (1995)) on the Keck II telescope on UT 2002 October 09 in poor weather conditions, but detected line emission at 8303Å. Deeper observations (7.8 ks of integration) with the 400 lines mm-1 grating ( Å; ) were obtained on UT 2002 November 08. Observations (12 ks) with the Focal Reducer/Low Dispersion Spectrograph (FORS2) on the Yepun telescope (VLT 4) were obtained on UT 2002 December 08 with the 300I grism (). We reduced the data with IRAF following standard procedures, and combined the LRIS and FORS2 data with appropriate weighting. The final spectrum (Figure 2) shows Ly emission at with flux . The line shows the blue cut–off characteristic of high–redshift Ly emitters, and the Ly forest continuum break is clearly evident. The emission line is not obviously detected in the grism spectrum. The ACS exposure time calculator predicts a line detection with for a point source. Extended line emission superimposed on the galaxy continuum, however, is evidently invisible.
We also obtained a spectrum of the only spatially extended HDF–N candidate with (J123619.9+620934) with Keck/LRIS on UT 2003 May 01, but did not successfully measure a redshift.
4 Other candidate objects
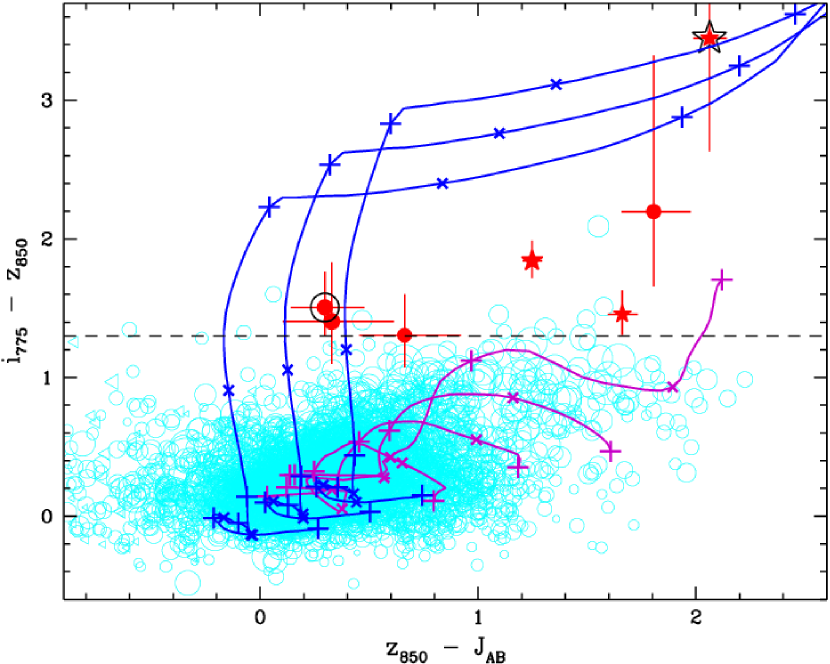
There are 16 objects with that meet our selection criteria. 11 are point sources (3.4% of the stellar objects with ; versus – for the other candidates), whose colors are suspect (§2). The GOODS project has gathered deep near–IR imaging with the VLT ISAAC camera covering of our CDF–S field (Giavalisco et al. 2003a), including all three CDF–S stellar –dropout candidates. Their colors are too red compared to expectations for high–redshift objects (Figure 3). Although some of the 8 HDF–N point sources might conceivably be high redshift objects, we believe that they are probably stars and will not consider them further here. This leaves five extended candidates, or 0.016 arcmin2 (Table 1).
Stanway, Bunker & McMahon (2003, SBM) used the public release v0.5 GOODS ACS CDF–S data to identify nine –dropout candidates. Three are in our sample, and two have been confirmed spectroscopically (Bunker et al. 2003, this paper). SBM#5 (J033238.80274953.6) is unresolved, with the reddest color ( at 2) of any GOODS object. Its exceptionally blue near–IR colors (, , AB) suggest that it may be a T–dwarf (see also SBM). Another point source, SBM#4, was observed in the GOODS spectroscopic program and is a cool star (approximately L0V). SBM#2, 4, 8 and 9 have in and/or , are fairly bright in near–IR images, and are thus unlikely to be at . SBM#6 falls outside the area analyzed here, where the data are shallow and there are no data. In summary, three (perhaps four) of the nine SBM objects are good candidates.
Data artifacts (space junk trails, reflection ghosts, diffraction spikes, residual cosmic rays) can produce spurious detections without shorter–wavelength counterparts which mimic –dropouts. We have removed most of these by visual inspection. This is generally easy at , but this corresponds to , which is fairly bright for galaxies at . Our catalogs push deeper; post–facto, we truncate them at and reject sources that are too small or sharp to be real. Even after careful inspection, however, some spurious sources probably remain. As one check, we masked areas with objects, inverted the images, and detected “negative sources.” We find 57 which qualify as –dropouts. All have , and have .
The vast majority of real, faint galaxies have and , but measurement errors may scatter a small fraction to redder colors. We estimate this contamination using brighter objects (). We randomly assign their colors to fainter objects, then perturb the simulated fluxes using the error distributions quantified in §2. Only foreground interlopers with would (barely) meet the –dropout criteria, while objects with could do so.
Together, these contaminants represent of the GOODS sources with , but may contribute 45% of the faint candidates. After subtracting the expected contamination, we estimate that there are candidates with (0.46 arcmin-2), of which have .
There are four extended candidates with in the portion of the CDF–S with deep ISAAC imaging (Figure 3). One has red and bright IR magnitudes, and is unlikely to be at . Two or perhaps three candidates, including SiD2, are very faint in the near–IR (), with colors expected for galaxies at .
5 Discussion
The color limit sets a lower redshift bound for –dropouts, while IGM suppression in makes the upper bound, and hence the sampling volume, a strong function of luminosity. We use simulations (Giavalisco et al. 2003b) to predict number counts of candidates, including photometric biases. We generated artificial galaxies with a mixture of disk and bulge surface brightness profiles, ellipticities, and orientations. Their sizes were drawn from a log–normal distribution tuned to reproduce measurements at –5 (Ferguson et al. 2003). Their spectra have a distribution of UV spectral slopes that matches the observed colors of LBGs at (Adelberger & Steidel 2000). We distributed the galaxies in redshift, modulated their spectra by IGM opacity (Madau 1995), convolved them with ACS point spread functions, added them to the GOODS images at various magnitudes, and recovered them with SExtractor.
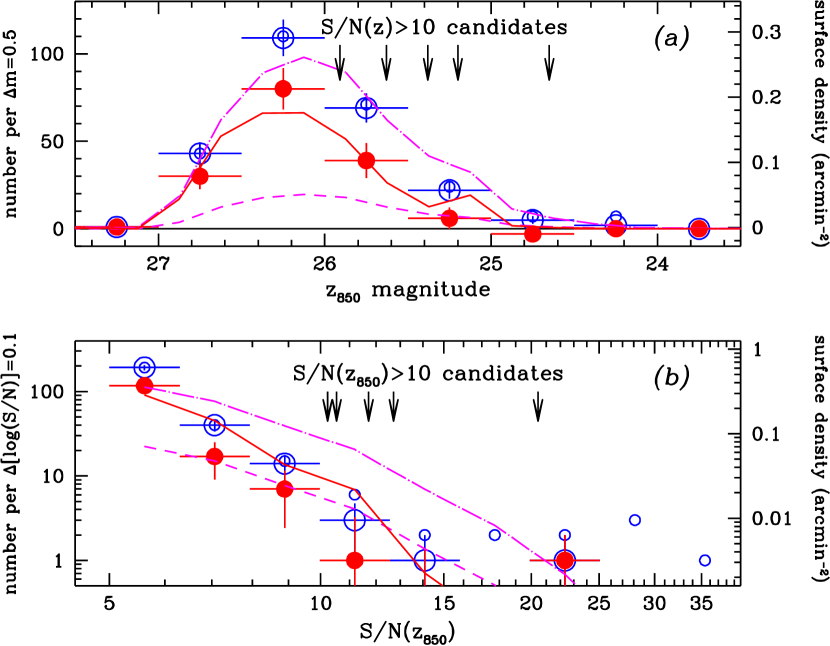
Figure 4 compares the number of –dropout candidates to simulations for various assumptions about the UV luminosity function (LF), which we model as a Schechter (1976) distribution with a faint–end slope fixed to , as measured for LBGs at (Adelberger & Steidel 2000). The number of bright galaxies is smaller at than at (see also SBM; Bremer & Lehnert 2003 find a similar result from ground–based imaging for LBGs at ). The LF is excluded with a high degree of confidence (). It predicts 30 galaxies with vs. 5 observed, and 26 with vs. observed.333Out of 7 candidates with , only one has . The others may be real, but contamination may be substantial. A change in the number of bright objects does not require comparable evolution in the total luminosity density of the population; the number of bright sources is exponentially sensitive to the value of . Schechter functions fit to the counts in Fig. 4 favor fainter and higher compared to their values at . Integrating acceptable fits for (), the UV emissivity is similar to that at (, 95.4% confidence). However, these fitted values, and hence most of the inferred luminosity density, are at , where the current data are most uncertain. The LF fit is strongly driven by objects with (Fig. 4). A model with and smaller (and ) is consistent with the data at brighter magnitudes and higher ratios, but drastically underpredicts the counts at low and . Fits excluding the lowest bin leave the total essentially unconstrained. A robust determination of the LF and total emissivity requires data significantly deeper than those used here.
Two other studies have analyzed –dropouts from somewhat deeper ACS images. Yan, Windhorst & Cohen (2003) found 2.3 candidates/arcmin2 with in an ACS field with exposure time 1.5 longer in than the 3–epoch GOODS data, but longer in , thus providing more robust color discrimination against interlopers. Their density is larger than ours to the same threshold. They estimate their catalogs are 100% complete for , whereas ours are only 50% complete for point sources at (Giavalisco et al. 2003a). Yan et al. may have underestimated their source fluxes or spurious detection rate, but it is notable that they also find very few bright candidates (none with ). Bouwens et al. (2003) identified 0.5 candidates/arcmin2 with from imaging (5–20 orbits in ) covering 46 arcmin2. They also find few bright candidates (only one with ), and estimate .
In summary, we have identified five spatially extended, high– candidates for galaxies at in early GOODS ACS imaging. Two have confirmed redshifts . There are many fainter candidates, but we estimate that may be spurious detections or foreground interlopers. The number of robust candidates is smaller than is predicted if the LF were the same as that at . Our best estimates find fainter , larger , and moderately smaller compared to , but this strongly depends on the number of objects at , which is as yet poorly measured. Constant with smaller and are consistent with the bright counts but greatly underpredict the number of faint sources. The measurements do not require (nor robustly exclude) a dramatic change in from to 3, especially if is evolving with redshift. Giavalisco et al. (2003b) find only a modest change () in the luminosity density from to where the GOODS LBG sample is much better characterized. Our best estimates are consistent with an extrapolation of those results to , but deeper data are needed for a robust measurement. The final GOODS images will be deeper, with fewer contaminating artifacts. This, together with much deeper data (e.g., the forthcoming ACS Ultradeep Field), will provide better constraints on the galaxy population at these highest optically–accessible redshifts.
References
- Adelberger & Steidel (2000) Adelberger, K. L., & Steidel, C. C., 2000, ApJ, 544, 218
- Bertin & Arnouts (1996) Bertin, E., & Arnouts, S. 1996, A&AS, 117, 393
- Bremer & Lehnert (2003) Bremer, M., & Lehnert, M. D., 2003, ApJ, in press
- Bouwens et al. (2003) Bouwens, R. J., et al., 2003, ApJ, in press
- Bunker et al. (2003) Bunker, A. J., Stanway, E. R., Ellis, R. S., McMahon, R. G., & McCarthy, P. J., 2003, MNRAS, submitted
- Coleman, Wu & Weedman (1980) Coleman, G. D., Wu, C.-C., & Weedman, D. W. 1980, ApJS, 43, 393
- Ferguson et al. (2003) Ferguson, H. C., et al., 2003, ApJ Letters, submitted
- Fan et al. (2003) Fan, X., et al., 2003, AJ, 125, 1649
- Giavalisco et al. (2003a) Giavalisco, M., et al., 2003a, ApJ Letters, submitted
- Giavalisco et al. (2003b) Giavalisco, M., et al., 2003b, ApJ Letters, submitted
- Madau (1995) Madau, P., 1995, ApJ, 441, 18
- Madau et al. (1996) Madau, P., Ferguson, H. C., Dickinson, M., Giavalisco, M., Steidel, C. C., & Fruchter, A. 1996, MNRAS, 283, 1388
- Oke et al. (1995) Oke, J. B., et al., 1995, PASP, 107, 375
- Riess et al. (2003) Riess, A., et al., 2003, ApJ Letters, submitted
- Schechter (1976) Schechter, P., 1976, ApJ, 203, 297
- Stanway, Bunker & McMahon (2003) Stanway, E. R., Bunker, A. J., & McMahon, R. G., 2003, MNRAS, in press
- Steidel et al. (1996) Steidel, C. C., Giavalisco, M., Pettini, M., Dickinson, M., & Adelberger, K. L. 1996, ApJ, 462, L17
- Yan, Windhorst & Cohen (2003) Yan, H., Windhorst, R. A., & Cohen, S. H., 2003, ApJ, 585, L93
| ID | RA (J2000) Dec | bbColor limits are reported at | FWHM() | Notes | |||
|---|---|---|---|---|---|---|---|
| arcsec | |||||||
| SiD001 | 03:32:25.60 | 27:55:48.6 | 20.45 | 0.18 | SBM#3 (Bunker et al. 2003) | ||
| SiD002 | 03:32:40.02 | 27:48:15.0 | 12.72 | 0.19 | SBM#1 (this paper); ISAAC | ||
| SiD003 | 03:32:19.07 | 27:54:21.9 | 11.72 | 0.27 | SBM#7; faint IR (SOFI) | ||
| NiD001 | 12:36:19.90 | 62:09:34.2 | 10.55 | 0.19 | |||
| SiD004 | 03:32:33.20 | 27:39:49.2 | 10.24 | 0.70 | faint IR (SOFI) | ||
| SiD005 | 03:32:39.03 | 27:52:23.1 | 9.44 | 0.28 | |||
| SiD006 | 03:32:45.23 | 27:49:09.9 | 9.05 | 0.65 | |||
| NiD002 | 12:37:28.62 | 62:20:39.1 | 8.79 | 0.77 | |||
| SiD007 | 03:32:42.94 | 27:52:00.7 | 8.75 | 0.72 | |||
| NiD003 | 12:37:35.90 | 62:20:43.4 | 8.67 | 0.93 | |||
| SiD008 | 03:32:13.06 | 27:49:00.7 | 8.63 | 0.34 | |||
| SiD009 | 03:32:41.36 | 27:50:04.7 | 8.58 | 0.14 | |||
| SiD010 | 03:32:26.25 | 27:48:30.3 | 8.50 | 0.23 | ISAAC | ||
| NiD004 | 12:36:42.15 | 62:09:02.0 | 8.20 | 0.75 | |||
| NiD005 | 12:35:59.01 | 62:12:45.6 | 8.15 | 0.36 | |||
| NiD006 | 12:36:18.54 | 62:10:41.9 | 8.13 | 0.28 | |||
| NiD007 | 12:37:52.57 | 62:17:00.7 | 8.08 | 0.21 | |||
| SiD011 | 03:32:37.63 | 27:50:22.4 | 8.07 | 0.88 | ISAAC | ||
| SiD012 | 03:32:23.84 | 27:55:11.5 | 8.02 | 0.23 | |||
| NiD008 | 12:36:43.53 | 62:10:04.1 | 7.89 | 0.19 | |||
| NiD009 | 12:37:12.43 | 62:18:28.4 | 7.65 | 0.32 | |||
| NiD010 | 12:36:48.08 | 62:10:12.6 | 7.60 | 0.90 | |||
| SiD013 | 03:32:34.69 | 27:50:22.8 | 7.57 | 0.87 | ISAAC (bright: , ) | ||
| NiD011 | 12:37:15.75 | 62:22:32.5 | 7.43 | 0.13 | |||
| NiD012 | 12:36:48.71 | 62:12:17.1 | 7.41 | 0.57 | |||
| NiD013 | 12:36:13.04 | 62:10:43.6 | 7.34 | 0.58 | |||
| NiD014 | 12:37:22.51 | 62:18:39.7 | 7.26 | 0.68 | |||
| NiD016 | 12:35:49.72 | 62:13:29.2 | 7.21 | 0.61 | |||
| NiD015 | 12:35:50.89 | 62:11:58.8 | 7.21 | 0.32 | |||
| SiD014 | 03:32:52.22 | 27:48:04.8 | 7.20 | 0.25 | |||
| NiD017 | 12:35:52.33 | 62:12:08.7 | 7.11 | 0.69 | |||
| SiD015 | 03:32:54.11 | 27:49:16.0 | 7.06 | 0.47 | |||
| SiD016 | 03:32:11.93 | 27:41:57.1 | 7.04 | 0.27 | |||
| SiD017 | 03:32:33.16 | 27:41:17.1 | 6.95 | 0.64 | |||
| SiD018 | 03:32:54.06 | 27:51:12.0 | 6.91 | 0.19 | |||
| SiD019 | 03:32:36.34 | 27:43:15.6 | 6.82 | 0.49 | |||
| NiD018 | 12:36:15.36 | 62:14:56.4 | 6.82 | 0.18 | |||
| SiD020 | 03:32:22.27 | 27:52:57.2 | 6.80 | 0.68 | |||
| SiD021 | 03:32:25.15 | 27:48:17.1 | 6.79 | 0.58 | ISAAC | ||
| NiD019 | 12:37:08.89 | 62:19:19.1 | 6.78 | 0.15 | |||
| NiD020 | 12:37:35.94 | 62:14:22.4 | 6.78 | 0.55 | |||
| SiD022 | 03:32:29.84 | 27:52:33.2 | 6.77 | 0.24 | |||
| SiD023 | 03:32:46.05 | 27:49:29.7 | 6.75 | 0.32 | |||
| NiD022 | 12:37:12.94 | 62:18:05.6 | 6.75 | 0.50 | |||
| NiD021 | 12:36:08.21 | 62:09:10.8 | 6.75 | 0.13 | |||
| NiD023 | 12:37:25.35 | 62:18:45.6 | 6.70 | 0.41 | |||
| NiD024 | 12:37:42.85 | 62:19:41.8 | 6.64 | 0.52 | |||
| NiD025 | 12:36:35.63 | 62:09:35.8 | 6.62 | 0.30 | |||
| SiD024 | 03:32:32.46 | 27:40:02.0 | 6.56 | 0.30 | |||
| NiD026 | 12:37:34.56 | 62:20:16.6 | 6.54 | 0.62 | |||
| NiD027 | 12:35:48.66 | 62:12:13.3 | 6.54 | 0.71 | |||
| NiD028 | 12:36:14.37 | 62:16:17.4 | 6.53 | 0.21 | |||
| NiD029 | 12:37:32.67 | 62:14:16.6 | 6.47 | 0.47 | |||
| NiD030 | 12:35:57.59 | 62:12:09.2 | 6.45 | 0.50 | |||
| NiD031 | 12:36:15.08 | 62:16:34.4 | 6.41 | 0.50 | |||
| SiD025 | 03:32:36.47 | 27:46:41.5 | 6.40 | 0.42 | ISAAC | ||
| NiD032 | 12:37:10.96 | 62:19:48.0 | 6.39 | 0.60 | |||
| NiD033 | 12:37:11.40 | 62:22:17.0 | 6.32 | 0.42 | |||
| NiD034 | 12:36:45.51 | 62:18:32.7 | 6.30 | 0.30 | |||
| NiD035 | 12:36:28.03 | 62:13:04.8 | 6.29 | 0.50 | |||
| SiD026 | 03:32:17.25 | 27:46:46.0 | 6.27 | 0.22 | |||
| NiD037 | 12:36:50.78 | 62:20:17.3 | 6.27 | 0.52 | |||
| NiD036 | 12:37:29.93 | 62:12:15.4 | 6.27 | 0.26 | |||
| SiD027 | 03:32:52.52 | 27:51:44.6 | 6.26 | 0.57 | |||
| NiD038 | 12:36:27.56 | 62:13:28.3 | 6.25 | 0.45 | |||
| NiD039 | 12:36:26.93 | 62:17:01.2 | 6.24 | 0.41 | |||
| SiD028 | 03:32:16.55 | 27:41:03.3 | 6.21 | 0.60 | |||
| NiD040 | 12:36:33.20 | 62:09:23.4 | 6.20 | 0.70 | |||
| NiD041 | 12:36:49.93 | 62:08:02.9 | 6.18 | 0.16 | |||
| SiD029 | 03:32:19.19 | 27:55:37.9 | 6.17 | 0.74 | |||
| SiD030 | 03:32:29.33 | 27:40:14.4 | 6.16 | 0.17 | |||
| SiD031 | 03:32:56.37 | 27:53:20.9 | 6.15 | 0.53 | |||
| NiD042 | 12:36:31.98 | 62:08:26.3 | 6.12 | 0.24 | |||
| NiD043 | 12:37:43.01 | 62:20:02.2 | 6.09 | 0.57 | |||
| NiD044 | 12:36:48.50 | 62:10:47.3 | 6.08 | 0.49 | |||
| NiD045 | 12:36:31.16 | 62:13:34.0 | 6.07 | 0.70 | |||
| NiD046 | 12:35:48.97 | 62:12:25.1 | 6.07 | 0.27 | |||
| NiD047 | 12:36:26.22 | 62:11:47.8 | 6.05 | 0.52 | |||
| SiD032 | 03:32:42.08 | 27:41:37.2 | 6.03 | 0.54 | |||
| SiD033 | 03:32:39.45 | 27:40:26.4 | 6.02 | 0.39 | |||
| NiD048 | 12:36:28.26 | 62:08:19.9 | 5.99 | 0.33 | |||
| SiD035 | 03:32:14.90 | 27:41:02.7 | 5.98 | 0.20 | |||
| SiD034 | 03:32:27.39 | 27:47:28.3 | 5.98 | 0.49 | ISAAC | ||
| NiD049 | 12:36:19.17 | 62:12:19.6 | 5.98 | 0.42 | |||
| NiD050 | 12:37:25.65 | 62:17:43.4 | 5.97 | 0.50 | |||
| NiD052 | 12:37:37.21 | 62:19:35.8 | 5.95 | 0.27 | |||
| NiD051 | 12:37:40.42 | 62:13:29.5 | 5.95 | 0.55 | |||
| NiD053 | 12:37:33.19 | 62:16:42.0 | 5.94 | 0.53 | |||
| NiD054 | 12:37:10.40 | 62:11:22.1 | 5.94 | 0.16 | |||
| SiD036 | 03:32:14.75 | 27:45:41.6 | 5.92 | 0.24 | ISAAC | ||
| NiD055 | 12:36:19.49 | 62:15:43.3 | 5.92 | 0.27 | |||
| SiD038 | 03:32:44.70 | 27:50:02.2 | 5.90 | 0.29 | |||
| SiD037 | 03:32:22.52 | 27:56:27.5 | 5.90 | 0.45 | |||
| NiD056 | 12:37:34.22 | 62:15:23.2 | 5.89 | 0.56 | |||
| NiD057 | 12:35:47.07 | 62:12:18.7 | 5.88 | 0.21 | |||
| SiD039 | 03:32:21.62 | 27:50:04.4 | 5.87 | 0.69 | ISAAC | ||
| NiD058 | 12:35:53.25 | 62:10:45.3 | 5.87 | 0.62 | |||
| NiD059 | 12:36:28.86 | 62:12:22.6 | 5.86 | 0.22 | |||
| NiD060 | 12:36:10.31 | 62:10:42.6 | 5.85 | 0.58 | |||
| NiD061 | 12:36:25.69 | 62:15:09.5 | 5.82 | 0.18 | |||
| NiD062 | 12:37:43.82 | 62:17:26.5 | 5.80 | 0.47 | |||
| NiD064 | 12:37:17.86 | 62:18:20.8 | 5.79 | 0.51 | |||
| NiD063 | 12:36:37.53 | 62:12:36.3 | 5.79 | 0.43 | |||
| NiD065 | 12:36:58.46 | 62:21:22.4 | 5.78 | 0.47 | |||
| NiD066 | 12:37:16.14 | 62:13:01.0 | 5.78 | 0.45 | |||
| NiD067 | 12:36:22.71 | 62:08:37.4 | 5.77 | 0.39 | |||
| NiD068 | 12:36:48.54 | 62:18:50.7 | 5.76 | 0.49 | |||
| NiD070 | 12:36:42.10 | 62:09:02.4 | 5.76 | 0.51 | |||
| NiD069 | 12:35:46.99 | 62:12:28.6 | 5.76 | 0.45 | |||
| NiD071 | 12:37:01.30 | 62:21:28.2 | 5.75 | 0.38 | |||
| NiD072 | 12:37:35.60 | 62:14:45.2 | 5.75 | 0.42 | |||
| NiD074 | 12:35:56.18 | 62:11:45.7 | 5.74 | 0.48 | |||
| NiD073 | 12:36:10.32 | 62:08:10.9 | 5.74 | 0.23 | |||
| NiD076 | 12:37:33.97 | 62:19:30.5 | 5.73 | 0.30 | |||
| NiD075 | 12:37:28.86 | 62:13:21.4 | 5.73 | 0.23 | |||
| NiD077 | 12:37:38.49 | 62:19:50.9 | 5.71 | 0.57 | |||
| NiD078 | 12:36:28.30 | 62:13:19.7 | 5.70 | 0.35 | |||
| SiD040 | 03:32:17.95 | 27:48:16.3 | 5.68 | 0.28 | ISAAC | ||
| SiD041 | 03:32:44.37 | 27:54:19.1 | 5.68 | 0.26 | |||
| NiD079 | 12:36:36.34 | 62:16:49.4 | 5.68 | 0.14 | |||
| NiD082 | 12:37:37.94 | 62:19:33.5 | 5.67 | 0.60 | |||
| NiD081 | 12:36:09.46 | 62:15:12.6 | 5.67 | 0.54 | |||
| NiD080 | 12:36:21.37 | 62:09:23.4 | 5.67 | 0.42 | |||
| SiD042 | 03:32:22.08 | 27:42:35.9 | 5.66 | 0.34 | |||
| NiD083 | 12:37:33.12 | 62:18:04.6 | 5.66 | 0.46 | |||
| NiD084 | 12:35:48.44 | 62:13:04.6 | 5.66 | 0.49 | |||
| SiD043 | 03:32:50.79 | 27:47:46.7 | 5.65 | 0.20 | |||
| NiD085 | 12:37:19.75 | 62:16:03.1 | 5.63 | 0.38 | |||
| SiD044 | 03:32:17.78 | 27:48:13.5 | 5.62 | 0.40 | ISAAC | ||
| NiD087 | 12:37:34.18 | 62:20:55.3 | 5.60 | 0.56 | |||
| NiD086 | 12:36:46.21 | 62:18:41.7 | 5.60 | 0.44 | |||
| SiD045 | 03:32:16.66 | 27:47:40.0 | 5.59 | 0.52 | ISAAC | ||
| NiD089 | 12:36:49.61 | 62:10:39.3 | 5.58 | 0.48 | |||
| NiD088 | 12:35:54.17 | 62:13:50.4 | 5.58 | 0.36 | |||
| SiD046 | 03:32:04.52 | 27:45:55.3 | 5.55 | 0.53 | ISAAC | ||
| NiD090 | 12:37:40.76 | 62:19:46.3 | 5.55 | 0.68 | |||
| SiD047 | 03:32:44.47 | 27:48:21.2 | 5.54 | 0.32 | ISAAC | ||
| NiD091 | 12:36:16.97 | 62:12:32.5 | 5.54 | 0.19 | |||
| SiD048 | 03:32:27.89 | 27:43:15.8 | 5.53 | 0.30 | |||
| NiD092 | 12:37:09.98 | 62:12:26.9 | 5.53 | 0.44 | |||
| SiD049 | 03:32:20.50 | 27:54:34.6 | 5.52 | 0.47 | |||
| NiD093 | 12:36:11.20 | 62:11:07.5 | 5.52 | 0.55 | |||
| SiD050 | 03:32:53.84 | 27:51:49.2 | 5.51 | 0.28 | |||
| NiD094 | 12:36:57.72 | 62:12:23.9 | 5.50 | 0.19 | |||
| SiD051 | 03:32:28.34 | 27:43:15.9 | 5.49 | 0.17 | |||
| NiD095 | 12:36:57.87 | 62:19:30.7 | 5.49 | 0.34 | |||
| SiD052 | 03:32:05.46 | 27:46:44.2 | 5.48 | 0.44 | |||
| NiD096 | 12:36:56.99 | 62:14:05.4 | 5.48 | 0.23 | |||
| SiD055 | 03:32:34.75 | 27:40:35.2 | 5.47 | 0.29 | |||
| SiD054 | 03:32:16.64 | 27:47:39.6 | 5.47 | 0.46 | ISAAC | ||
| SiD053 | 03:32:35.53 | 27:53:37.2 | 5.47 | 0.49 | |||
| SiD056 | 03:32:43.49 | 27:45:29.2 | 5.46 | 0.56 | |||
| NiD097 | 12:37:29.90 | 62:14:08.9 | 5.46 | 0.49 | |||
| NiD099 | 12:36:45.40 | 62:18:02.7 | 5.45 | 0.42 | |||
| NiD098 | 12:37:07.87 | 62:09:16.9 | 5.45 | 0.34 | |||
| NiD100 | 12:38:00.87 | 62:16:11.6 | 5.44 | 0.43 | |||
| NiD102 | 12:36:57.20 | 62:10:24.7 | 5.43 | 0.43 | |||
| NiD101 | 12:36:00.10 | 62:13:23.6 | 5.43 | 0.27 | |||
| SiD057 | 03:32:37.96 | 27:42:07.6 | 5.42 | 0.24 | |||
| SiD058 | 03:32:54.86 | 27:48:39.9 | 5.42 | 0.36 | |||
| NiD103 | 12:37:31.68 | 62:20:18.7 | 5.42 | 0.52 | |||
| SiD059 | 03:32:40.70 | 27:53:26.0 | 5.41 | 0.40 | |||
| NiD104 | 12:36:58.84 | 62:10:34.5 | 5.41 | 0.35 | |||
| NiD105 | 12:36:22.73 | 62:14:22.0 | 5.40 | 0.26 | |||
| NiD106 | 12:35:45.44 | 62:12:30.6 | 5.39 | 0.37 | |||
| SiD061 | 03:32:19.90 | 27:52:06.1 | 5.38 | 0.26 | |||
| SiD060 | 03:32:36.67 | 27:54:21.0 | 5.38 | 0.41 | |||
| NiD107 | 12:36:12.10 | 62:14:38.1 | 5.38 | 0.39 | |||
| NiD108 | 12:35:39.26 | 62:12:29.3 | 5.38 | 0.36 | |||
| NiD109 | 12:37:09.14 | 62:22:50.6 | 5.37 | 0.52 | |||
| SiD062 | 03:32:35.98 | 27:46:05.1 | 5.36 | 0.29 | ISAAC | ||
| NiD111 | 12:36:20.91 | 62:16:50.8 | 5.36 | 0.39 | |||
| NiD110 | 12:35:47.37 | 62:11:33.2 | 5.36 | 0.37 | |||
| SiD063 | 03:32:22.39 | 27:48:04.4 | 5.35 | 0.44 | ISAAC | ||
| NiD113 | 12:36:29.26 | 62:16:31.6 | 5.35 | 0.38 | |||
| NiD112 | 12:36:22.03 | 62:15:13.8 | 5.35 | 0.48 | |||
| NiD114 | 12:36:47.23 | 62:09:55.5 | 5.35 | 0.42 | |||
| NiD116 | 12:36:44.51 | 62:10:28.3 | 5.34 | 0.49 | |||
| NiD115 | 12:35:57.93 | 62:13:51.6 | 5.34 | 0.28 | |||
| NiD118 | 12:37:16.16 | 62:18:14.9 | 5.33 | 0.56 | |||
| NiD117 | 12:37:09.62 | 62:18:14.7 | 5.33 | 0.60 | |||
| NiD119 | 12:36:12.62 | 62:13:48.0 | 5.32 | 0.34 | |||
| SiD064 | 03:32:24.80 | 27:47:58.8 | 5.31 | 0.35 | ISAAC | ||
| SiD065 | 03:32:40.82 | 27:47:43.1 | 5.31 | 0.51 | ISAAC | ||
| SiD066 | 03:32:44.12 | 27:43:18.4 | 5.30 | 0.48 | |||
| NiD120 | 12:36:28.07 | 62:13:19.8 | 5.30 | 0.37 | |||
| NiD121 | 12:37:15.05 | 62:18:17.8 | 5.28 | 0.54 | |||
| NiD123 | 12:37:14.84 | 62:20:15.0 | 5.27 | 0.49 | |||
| NiD122 | 12:36:04.56 | 62:09:24.7 | 5.27 | 0.49 | |||
| SiD067 | 03:32:19.46 | 27:51:59.2 | 5.26 | 0.43 | |||
| SiD068 | 03:32:53.20 | 27:49:44.3 | 5.26 | 0.31 | |||
| NiD125 | 12:37:50.65 | 62:17:22.4 | 5.26 | 0.40 | |||
| NiD124 | 12:36:37.49 | 62:16:57.5 | 5.26 | 0.38 | |||
| NiD126 | 12:36:17.37 | 62:16:17.7 | 5.26 | 0.47 | |||
| SiD069 | 03:32:13.06 | 27:51:33.6 | 5.25 | 0.26 | |||
| SiD070 | 03:32:39.19 | 27:54:13.8 | 5.25 | 0.43 | |||
| NiD128 | 12:36:57.56 | 62:09:08.5 | 5.25 | 0.54 | |||
| NiD127 | 12:36:12.41 | 62:14:49.5 | 5.25 | 0.45 | |||
| SiD071 | 03:32:14.73 | 27:47:58.7 | 5.23 | 0.21 | ISAAC | ||
| SiD072 | 03:32:47.69 | 27:46:45.1 | 5.23 | 0.54 | |||
| NiD129 | 12:37:36.60 | 62:14:09.7 | 5.22 | 0.45 | |||
| SiD073 | 03:32:19.05 | 27:42:44.2 | 5.21 | 0.51 | |||
| NiD130 | 12:37:31.00 | 62:19:49.0 | 5.21 | 0.42 | |||
| NiD132 | 12:37:17.48 | 62:17:46.3 | 5.21 | 0.56 | |||
| NiD131 | 12:36:48.78 | 62:19:39.0 | 5.21 | 0.45 | |||
| SiD074 | 03:32:34.82 | 27:51:33.1 | 5.20 | 0.26 | |||
| NiD133 | 12:37:42.08 | 62:15:04.4 | 5.20 | 0.28 | |||
| NiD134 | 12:36:24.96 | 62:10:56.0 | 5.20 | 0.23 | |||
| NiD136 | 12:36:51.49 | 62:20:10.8 | 5.18 | 0.20 | |||
| NiD135 | 12:36:37.86 | 62:14:26.8 | 5.18 | 0.47 | |||
| SiD075 | 03:32:23.88 | 27:52:04.4 | 5.17 | 0.43 | |||
| NiD137 | 12:36:27.03 | 62:11:25.9 | 5.16 | 0.36 | |||
| SiD076 | 03:32:19.90 | 27:47:53.2 | 5.15 | 0.44 | ISAAC | ||
| SiD077 | 03:32:21.60 | 27:44:23.0 | 5.14 | 0.41 | ISAAC | ||
| SiD078 | 03:32:18.54 | 27:52:59.9 | 5.14 | 0.51 | |||
| NiD139 | 12:37:39.99 | 62:20:08.4 | 5.14 | 0.34 | |||
| NiD138 | 12:37:41.69 | 62:19:29.4 | 5.14 | 0.44 | |||
| NiD140 | 12:37:15.31 | 62:15:35.7 | 5.14 | 0.46 | |||
| SiD079 | 03:32:29.41 | 27:43:49.4 | 5.13 | 0.28 | |||
| NiD141 | 12:36:29.43 | 62:16:44.4 | 5.13 | 0.29 | |||
| NiD144 | 12:36:41.38 | 62:17:01.9 | 5.11 | 0.29 | |||
| NiD142 | 12:37:01.34 | 62:11:39.7 | 5.11 | 0.57 | |||
| NiD143 | 12:36:49.09 | 62:09:12.6 | 5.11 | 0.46 | |||
| SiD080 | 03:32:18.29 | 27:48:55.6 | 5.10 | 0.34 | ISAAC | ||
| SiD082 | 03:32:16.26 | 27:44:19.7 | 5.09 | 0.34 | ISAAC | ||
| SiD083 | 03:32:05.13 | 27:46:40.0 | 5.09 | 0.30 | |||
| SiD081 | 03:32:52.36 | 27:48:53.0 | 5.09 | 0.47 | |||
| SiD085 | 03:32:49.63 | 27:49:11.1 | 5.08 | 0.23 | |||
| SiD084 | 03:32:23.37 | 27:51:55.7 | 5.08 | 0.27 | |||
| NiD145 | 12:36:50.61 | 62:10:52.7 | 5.08 | 0.44 | |||
| NiD146 | 12:36:44.70 | 62:10:03.1 | 5.08 | 0.40 | |||
| SiD086 | 03:32:41.17 | 27:49:47.8 | 5.06 | 0.34 | |||
| SiD088 | 03:32:39.97 | 27:41:50.0 | 5.05 | 0.47 | |||
| SiD087 | 03:32:42.16 | 27:54:38.8 | 5.05 | 0.52 | |||
| NiD147 | 12:37:13.52 | 62:16:20.0 | 5.05 | 0.34 | |||
| SiD089 | 03:32:29.02 | 27:42:08.0 | 5.04 | 0.22 | |||
| NiD148 | 12:36:34.17 | 62:16:47.1 | 5.04 | 0.42 | |||
| SiD092 | 03:32:09.91 | 27:43:36.3 | 5.03 | 0.50 | ISAAC | ||
| SiD090 | 03:32:33.78 | 27:48:07.6 | 5.03 | 0.39 | ISAAC | ||
| SiD091 | 03:32:49.83 | 27:48:38.3 | 5.03 | 0.40 | |||
| NiD149 | 12:37:30.73 | 62:19:44.7 | 5.03 | 0.41 | |||
| SiD095 | 03:32:07.57 | 27:41:30.3 | 5.02 | 0.39 | |||
| SiD093 | 03:32:21.35 | 27:50:30.6 | 5.02 | 0.33 | ISAAC | ||
| SiD094 | 03:32:21.75 | 27:50:52.0 | 5.02 | 0.50 | ISAAC | ||
| SiD096 | 03:32:20.72 | 27:44:35.3 | 5.01 | 0.42 | ISAAC | ||
| NiD153 | 12:36:55.43 | 62:20:50.5 | 5.01 | 0.36 | |||
| NiD151 | 12:37:08.17 | 62:09:42.7 | 5.01 | 0.41 | |||
| NiD154 | 12:36:29.21 | 62:13:35.6 | 5.01 | 0.13 | |||
| NiD152 | 12:36:27.41 | 62:12:05.3 | 5.01 | 0.25 | |||
| NiD150 | 12:36:25.29 | 62:11:41.6 | 5.01 | 0.39 | |||
| NiD155 | 12:36:24.54 | 62:15:35.8 | 5.00 | 0.41 | |||