The Redshift Distribution of Near-IR Selected Galaxies in the Great Observatories Origins Deep Survey as a Test of Galaxy Formation Scenarios 11affiliation: Based on observations taken with the NASA/ESA Hubble Space Telescope, which is operated by the Association of Universities for Research in Astronomy, Inc. (AURA) under NASA contract NAS5–26555, and on observations collected at the European Southern Observatory, Chile, Programs 164.O-0561, 169.A-0725, 267.A-5729
Abstract
The redshift distribution of near-IR selected galaxies is often used to attempt to discriminate between the classical view of galaxy formation, in which present-day luminous galaxies were assembled at early times and evolve due to the passive aging of their stellar populations, and that of hierarchical structure formation, in which galaxies were assembled more recently via the merging of smaller objects. We carry out such a test here, by computing the distribution of photometric redshifts of galaxies in the Great Observatories Origins Deep Field Survey (GOODS) Southern Field, and comparing the results with predictions from a semi-analytic model based on hierarchical structure formation, and a classical ‘passive evolution’ model. We find that the redshift distributions at of both the hierarchical and passive models are very similar to the observed one. At , the hierarchical model shows a deficit of galaxies, while the passive model predicts an excess. We investigate the nature of the observed galaxies in the redshift range where the models diverge, and find that the majority have highly disturbed morphologies, suggesting that they may be merger-induced starbursts. While the hierarchical model used here does not produce these objects in great enough numbers, the appearance of this population is clearly in better qualitative agreement with the hierarchical picture than with the classical passive evolution scenario. We conclude that the observations support the general framework of hierarchical formation, but suggest the need for new or modified physics in the models.
1 Introduction
While the stars that produce the bulk of the optical light in nearby luminous galaxies are known observationally to be quite old, it is possible that the time at which the mass was assembled into a single object is different from the formation time of the stars. In fact, in the hierarchical paradigm of galaxy formation, one expects mass assembly to be a gradual process, in contrast to the classical monolithic dissipative collapse picture (Eggen, Lynden-Bell, & Sandage 1962). A generic prediction of hierarchical (Cold Dark Matter; CDM) theories is that galaxies should be less massive in the past. Direct searches for galaxies at high redshift should therefore provide a crucial test of this class of theories (Kauffmann & Charlot 1998). Determining the epoch of formation and assembly of present-day luminous galaxies is central to our understanding of galaxy formation and cosmology, and is a primary goal of the Great Observatories Origins Deep Survey (GOODS), as well as of many other deep surveys.
In practice, however, there are many complications involved in carrying out this test. Of course, we cannot follow an individual galaxy back in time, but can only study populations observed at different redshifts. Cosmological k-corrections (redshifting of light to longer wavelengths) and stellar evolution both make it difficult to relate high redshift populations to local ones. One can attempt to account for these effects by artificially redshifting template spectra for representative galaxy types and/or by using stellar population models with assumed star formation histories. Starting from an empirical low-redshift luminosity function, one can then predict how the local galaxy population would appear at high redshift, with the effects of k-corrections only (‘no evolution’) or with the additional effects of stellar evolution (‘passive evolution’) included. However, these corrections can be sensitive to the input assumptions.
There are several advantages to carrying out this test using a sample selected in the near-IR rather than the optical. The corrections described above are considerably smaller, and the near-IR light more closely traces the stellar mass. The observed K-band (2.2 m) probes the SED longwards of the rest-frame I-band ( Å) out to . However, it also necessary to probe a large enough volume to contain a statistically significant sample of rare luminous objects. The availability of accurate photometric redshift estimates, requiring multi-band U through K photometry, enables such tests to be extended into the ‘spectroscopic desert’, where spectroscopic redshifts are difficult to procure. Only recently have sufficiently deep and wide near-IR selected surveys with multi-band photometry begun to become available.
The original study by Kauffmann & Charlot (1998, KC98) showed that the cumulative redshift distribution of K-selected galaxies differed greatly in a hierarchical model compared with a passive (or Pure Luminosity Evolution; PLE) model: they found that the fraction of galaxies at with was an order of magnitude higher in the PLE model. Based on the small observational samples available at the time, KC98 concluded that the hierarchical model provided a better match to the observed redshift distribution out to . Recently, several studies have carried out this test using updated hierarchical models (including, among other things, the transition to a low-, cosmological constant-dominated cosmology) and larger, deeper observational samples (Firth et al. 2002; Cimatti et al. 2002b; Kashikawa et al. 2003). Both Cimatti et al. (2002b) and Kashikawa et al. (2003) concluded that the PLE models produced better agreement with the observed redshift distribution at than the hierarchical models, although the disagreement was relatively subtle compared with the expectations set out in KC98.
In this paper, we use a Ks-band selected sample () from the GOODS Southern field to repeat the KC98-type redshift distribution test, using accurate, well-calibrated photometric redshifts (Mobasher et al. 2003). The GOODS field probes a considerably larger area and volume than previous studies at a similar depth. We also have the advantage of the exquisite ACS imaging, which allows us to investigate the morphologies of high redshift galaxies, gaining further insights into the nature of these objects. We confront these observations with predictions from semi-analytic hierarchical galaxy formation models, and with PLE models, both normalized to the K-band luminosity function recently determined from the 2MASS survey (Kochanek et al. 2001; Cole et al. 2001).
2 The Data
The GOODS data are described in Giavalisco et al. (2003). Our study is based on the GOODS Southern field (Chandra Deep Field South; CDFS), which has an area of 160 arcmin2. In addition to the 4-band (BViz) ACS imaging, we make use of an extensive set of complementary ground-based observations from the VLT, NTT, and ESO 2.2m telescopes, including optical WFI (U’UBVRI) and FORS (RI), and infrared SOFI (JHKs) photometry, which covers the entire ACS GOODS CDFS field. This work is based on a PSF-matched SOFI-Ks selected catalog. Clearly-unresolved sources (stars) based on the ACS data down to z have been removed. The 50% completeness limit is K, and the sample should be close to 100% complete at K (Moy et al. 2003; Giavalisco et al. 2003), the limit we adopt for our analysis. Photometric redshifts were estimated as described in Mobasher et al. (2003), using all the available bands (U’ through Ks), and are well-calibrated to using spectroscopic redshifts from the K20 survey (Cimatti et al. 2002a) and additional spectra obtained from FORS2 on the VLT as part of the GOODS program. Typical redshift errors for the K sample are (Mobasher et al. 2003).
In the remainder of the paper, we refer to the band as for brevity, and give all magnitudes in the AB system unless otherwise specified. Note that for our filter bands, , and .
3 Models
Where relevant, we assume the following values for the cosmological parameters: matter density , baryon density , dark energy , Hubble parameter km s-1 Mpc-1, fluctuation amplitude , and a scale-free primordial power spectrum . These values are consistent with the recent WMAP data (Spergel et al. 2003).
The basic ingredients of the semi-analytic hierarchical models used here are described in Somerville & Primack (1999) and Somerville et al. (2001). The models are based on hierarchical merger trees within a CDM model, and include modeling of gas cooling, star formation, supernova feedback, chemical enrichment, stellar population synthesis, and dust. We use the multi-metallicity stellar SED models of Devriendt et al. (1999), assuming a Kennicutt IMF. Here we have considered a model based on the ‘collisional starburst’ recipe described in Somerville et al. (2001), which was found to produce the best agreement with high redshift () galaxy observations. Several parameters and model ingredients have been adjusted to give better agreement with the low redshift optical and K-band luminosity functions recently determined by SDSS and 2MASS (e.g. Blanton et al. 2001; Cole et al. 2001), and with low redshift galaxy colors (details will be given in Somerville et al. 2003, in prep). We produced a mock catalog with the same angular extent and depth as the GOODS ACS and ground-based data, which was run ‘blind’ before the data were analyzed.
The passive evolution models are computed as described in Gardner (1998), and are normalized to the type-dependent K-band luminosity functions derived from the 2MASS survey by Kochanek et al. (2001). These models contain six different types of galaxies with simple parameterized star formation histories: E, S0, Sb, Sc, Irr, and starburst. All galaxies except the starburst type begin forming stars at . The E, S0, Sb and Sc types have exponentially declining star formation rates with e-folding timescales of 1 Gyr for the E/S0, 4 Gyr for the Sb and 7 Gyr for the Sc types. The Irr types have a constant star formation rate. The starburst population has a constant star formation rate and constant age (1 Gyr) at every redshift.
4 Results
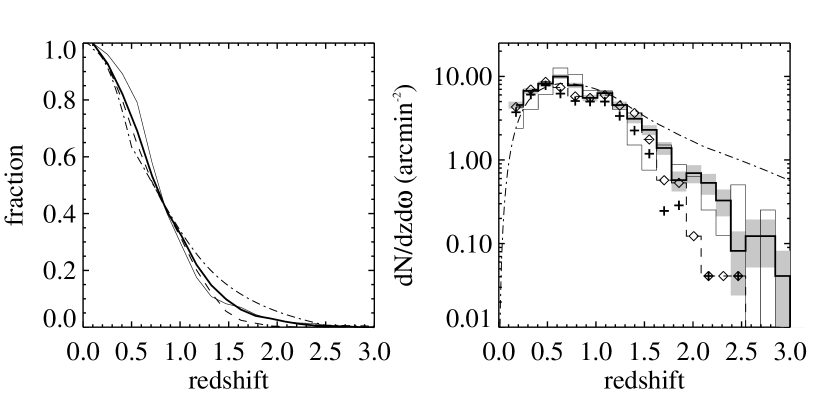
The cumulative and differential redshift distributions for the selected samples are shown in Fig. 1, for the GOODS data, the K20 survey, and the semi-analytic and passive models. The redshift distribution of GOODS agrees very well with that obtained from the K20 spectroscopic survey, which was carried out independently in a smaller area of the same field. The agreement between the semi-analytic models and the observations is quite good — well within the fluctuations expected from large scale structure — up to about . This good low redshift agreement is in contrast with previous comparisons with semi-analytic models from several groups (Firth et al. 2002; Cimatti et al. 2002b). In previous models, the luminosity function was too steep on the faint end, leading to an excess of intrinsically faint galaxies at low redshift. Improved modeling of sub-halo merging, and including ejection of gas by superwinds and suppression of gas infall in small halos after reionization produce better agreement with the observed K-band luminosity function at (Somerville 2002; Benson et al. 2002), and also to better agreement with the low-redshift shown here. Also of note is the similarity of the predicted at for the hierarchical and the PLE models — in contrast with the results of KC98.
At , the number of galaxies in the semi-analytic models is significantly and systematically smaller than the observed value, while the PLE model systematically overpredicts the number of objects in this range by a similar factor. The isophotal magnitudes used in our GOODS catalog are probably fainter than the true total magnitudes by about 0.2–0.3 magnitudes (Cimatti et al. 2002a). Correcting the semi-analytic models for this effect further exacerbates the discrepancy, as shown in Fig. 1. We note that the redshift range in which the models suffer from the most significant discrepancy () is precisely where the photometric redshifts are the least secure, as very few spectroscopic redshifts are available to test them — though progress is being made in this area (Daddi et al. 2003). In addition, at these redshifts, the observed K-band has shifted into the rest optical, and is therefore more sensitive to recent star formation activity.
It is interesting to investigate the nature of the galaxies that appear in the high redshift tail of the observed distribution, but are under-represented in the hierarchical models. Fig. 2 shows the (observed frame) colors as a function of redshift for the observed and semi-analytic model galaxies. The colors of solar metallicity, single-age populations are also shown. The semi-analytic model reproduces the locus of observed colors fairly well up to . At –1.2, the semi-analytic model produces enough galaxies overall, but does not produce enough galaxies with very red colors. This problem has been noted before (Daddi et al. 2000; Firth et al. 2002; Cimatti et al. 2002b). The number densities and morphologies of these Extremely Red Objects (EROs) in GOODS are discussed in more detail in Moustakas et al. (2003).
At higher redshift (), the observed distribution of colors is bimodal, with the ‘dip’ around (see Fig. 2). Focusing on galaxies in the redshift interval and with , we find that about 60% (44 out of 75) of the GOODS galaxies have colors bluer than , while in the semi-analytic mock catalog, 52% (11 out of 21) of the objects have . Considering the small number statistics, this implies that the semi-analytic model produces approximately the correct relative fraction of red and blue galaxies. We have visually inspected all of the objects in this sub-sample, and find that the great majority of both red and blue galaxies have highly irregular morphologies, many with multiple components and the appearance of ongoing mergers.
From comparison with the single-burst model tracks, we can deduce that the high redshift, blue galaxies () must be dominated by extremely young ( Myr), nearly unreddened stars. Intriguingly, Daddi et al. (2003) have recently obtained spectra for a sample of galaxies with and in the GOODS CDFS/K20 field, and have successfully obtained redshifts for 9 such objects, confirming that they lie in the range . On the basis of these spectra and the ACS images, Daddi et al. (2003) argue that these objects are strongly clustered, massive, merger-driven starbursts. We show the location of these objects on our color-redshift diagram, and see that they lie precisely in the regime of the ‘missing blue galaxies’.


5 Discussion
In this paper, we address a central question in galaxy formation theory: were most of the luminous galaxies that we see today already in place at high redshift, or were they assembled gradually over time? To answer this question, we confronted observations from the GOODS CDFS field with predictions from two models representing what are traditionally considered opposing points of view: a semi-analytic hierarchical model based on CDM theory, and a ‘passive evolution’ model, in which galaxy properties evolve only due to the aging of their stellar populations. Our main conclusions are as follows:
-
1.
Up to , redshift distributions of galaxies in the hierarchical model, the passive model, and the data are all consistent with one another. However, the hierarchical model underproduces the number of Extremely Red Objects (EROs) at .
-
2.
The hierarchical model underproduces near-IR selected objects () by about a factor of three at and by an order of magnitude at . The PLE model overproduces these galaxies by about a factor of two at .
-
3.
At , the objects underproduced in the hierarchical model are nearly equally divided between red () and blue galaxies. Based on ACS imaging, many of these objects appear to be highly morphologically disturbed, and a large fraction may be merger-driven starbursts.
Not surprisingly, the predicted colors of model galaxies in the hierarchical models are quite sensitive to the details of the star formation recipes, as well as the stellar IMF and dust modeling. For example, if we assume that starbursts occur in major mergers only, we can produce more extremely red galaxies at , but we then produce even fewer luminous blue galaxies at –2. Alternatively, if we brighten all model galaxies by 0.5 magnitudes (40%), we find that the semi-analytic model then produces sufficient numbers of objects at , but this naturally causes an excess at lower redshift. Cosmic variance is also expected to be significant for these luminous, rare objects — assuming that these objects are strongly clustered, like EROs at (e.g. Daddi et al. 2001), we estimate an uncertainty due to cosmic variance of about 60% in the number density of objects at (see Somerville et al. 2003). This implies that the semi-analytic model is discrepant at less than 2. Results from additional fields will determine whether there is an overdensity of objects at –2 in the CDFS.
A significant conclusion from this work is that the test proposed by KC98, when carried out with recent models, is not as strong a discriminator between the traditionally opposing points of view of hierarchical vs. PLE models as was found in that work. Adoption of the flat, low- cosmology now favored by observation, and the refinement of the star formation and feedback recipes has resulted in more early star formation in the modern semi-analytic models. At the same time, the use of the observed K-band luminosity function to normalize the PLE models has reduced the uncertainty due to dust and k-corrections in those models. The net effect is that the two scenarios diverge significantly only at a higher redshift () than predicted by KC98. Several other recent studies (Cimatti et al. 2002a; Firth et al. 2002; Kashikawa et al. 2003) have reached a similar conclusion.
However, the morphologies of the observed objects in this redshift interval are inconsistent with the passive evolution hypothesis — the majority seem to be highly disturbed morphologically, and many are clearly interacting or merging (see also Daddi et al. 2003). Qualitatively, this is clearly more consistent with the hierarchical scenario. However, the quantitative disagreement between the number of predicted and observed objects indicates that some ingredients in the models need to be modified, or else that some physics is missing. Further study of the nature of this population at , which forms a ‘bridge’ between the better-studied populations of ‘normal’ galaxies at and Lyman-break galaxies at , will certainly provide important new insights into some of the remaining mysteries of galaxy formation.
Acknowledgments
We thank our collaborators in the GOODS team for useful feedback on this work. Support for this work was provided by NASA through grants GO09583.01-96A and GO09481.01-A from the Space Telescope Science Institute, which is operated by the Association of Universities for Research in Astronomy, under NASA contract NAS5-26555. Support for this work, part of the Space Infrared Telescope Facility (SIRTF) Legacy Science Program, was also provided by NASA through Contract Number 1224666 issued by the Jet Propulsion Laboratory, California Institute of Technology under NASA contract 1407.
References
- Benson et al. (2002) Benson, A. J., Lacey, C. G., Baugh, C. M., Cole, S., & Frenk, C. S. 2002, MNRAS, 333, 156
- Blanton et al. (2001) Blanton, M. R. et al. 2001, AJ, 121, 2358
- Cimatti et al. (2002a) Cimatti, A. et al. 2002a, A&A, 392, 395
- Cimatti et al. (2002b) Cimatti, A. et al. 2002b, A&A, 391, L1
- Cole et al. (2001) Cole, S. et al. 2001, MNRAS, 326, 255
- Daddi et al. (2003) Daddi, E. et al. 2003, this volume
- Daddi et al. (2001) Daddi, E., Broadhurst, T., Zamorani, G., Cimatti, A., Röttgering, H., & Renzini, A. 2001, A&A, 376, 825
- Daddi et al. (2000) Daddi, E., Cimatti, A., & Renzini, A. 2000, A&A, 362, L45
- Devriendt et al. (1999) Devriendt, J. E. G., Guiderdoni, B., & Sadat, R. 1999, A&A, 350, 381
- Eggen et al. (1962) Eggen, O. J., Lynden-Bell, D., & Sandage, A. R. 1962, ApJ, 136, 748
- Firth et al. (2002) Firth, A. E. et al. 2002, MNRAS, 332, 617
- Gardner (1998) Gardner, J. P. 1998, PASP, 110, 291
- Giavalisco et al. (2003) Giavalisco, M. et al. 2003, this volume
- Kashikawa et al. (2003) Kashikawa, N. et al. 2003, preprint, astro-ph/0209445
- Kauffmann & Charlot (1998) Kauffmann, G. & Charlot, S. 1998, MNRAS, 297, L23
- Kochanek et al. (2001) Kochanek, C. S. et al. 2001, ApJ, 560, 566
- Mobasher et al. (2003) Mobasher, B. et al. 2003, this volume
- Moustakas et al. (2003) Moustakas, L. et al. 2003, this volume
- Moy et al. (2003) Moy, E., Barmby, P., Rigopoulou, D., Huang, J.-S., Willner, S. P., & Fazio, G. G. 2003, A&A, 403, 493
- Somerville et al. (2003) Somerville, R.S., Lee, K., Ferguson, H.C., Gardner, J.P., Moustakas, L.A., & Giavalisco, M. 2003, this volume
- Somerville (2002) Somerville, R. S. 2002, ApJ, 572, L23
- Somerville & Primack (1999) Somerville, R. S. & Primack, J. R. 1999, MNRAS, 310, 1087
- Somerville et al. (2001) Somerville, R. S., Primack, J. R., & Faber, S. M. 2001, MNRAS, 320, 504
- Spergel et al. (2003) Spergel, D. N. et al. 2003, preprint, astro-ph/0302209