The Rest–Frame UV Luminosity Density of Star–Forming Galaxies at Redshifts 11affiliation: Based on observations obtained with the NASA/ESA Hubble Space Telescope obtained at the Space Telescope Science Institute, which is operated by the Association of Universities for Research in Astronomy, Inc. (AURA) under NASA contract NAS 5-26555.
Abstract
We have measured the rest–frame Å comoving specific luminosity density of star–forming galaxies at redshift from deep images taken with the Hubble Space Telescope (HST) and the Advanced Camera for Surveys (ACS), obtained as part of the Great Observatories Origins Deep Survey (GOODS). We used color selection criteria to construct samples of star–forming galaxies at redshifts , and , identified by the signature of the 912 Å Lyman continuum discontinuity and Ly forest blanketing in their rest–frame UV colors (Lyman–break galaxies). The ACS samples cover square degree, and are also relatively deep, reaching between 0.2 and 0.5 , depending on the redshift, where is the characteristic UV luminosity of Lyman–break galaxies at . The specific luminosity density of Lyman–break galaxies appears to be nearly constant with redshift from to , although the measure at remains relatively uncertain, because it depends on the accurate estimate of the faint counts of the sample. If Lyman–break galaxies are fair tracers of the cosmic star formation activity, our results suggest that at the universe was already producing stars as vigorously as it did near its maximum several Gyr later, at . Thus, the onset of large–scale star formation in the universe is to be sought at around or higher, namely at less than % of the current cosmic age.
.
1 INTRODUCTION
The amount of star formation that took place early in the cosmic history, e.g. at , and its evolution with redshift are key pieces of information to constrain theories of galaxy evolution. Evidence of the possible signature of the trailing edge of the cosmic reionization epoch at redshifts (e.g. Fan et al. 2002) has also recently renewed interest in measuring the star formation activity at these epochs, since starburst galaxies can contribute a significant fraction of the ionizing photons (Madau et al. 1999; Haiman et al. 2001; Steidel et al. 2001). Initial estimates based on the evolution of the cosmic neutral hydrogen mass density estimated from damped Ly absorption systems (DLA, Fall et al. 1996) suggested that star formation activity peaked in the past at around and then decreased at higher redshifts. The first direct measures based on the observed UV radiation of relatively unobscured star–forming galaxies in the local and intermediate–redshift universe and of Lyman–break galaxies (LBGs) at (Madau et al. 1996) seemed to confirm this general scenario. However, subsequent measures based on the systematic spectroscopic identification of hundreds of Lyman–break galaxies at and showed that the star formation density traced by these sources, after reaching a maximum value somewhere between and , remains nearly constant up to the highest redshift observed with some confidence, i.e. (Steidel et al. 1999, S99 hereafter). More recent measure at from deep, wide–area samples obtained with the Subaru telescope (Iwata et al. 2003) and with HST (Bouwens et al. 2003) show very mild evolution from , although possible evidence to the contrary has also been reported (Stanway et al. 2003a,b). Measures based on photometric redshifts also seem to be in general agreement with a constant or mildly decreasing activity of star formation as traced by starburst galaxies up to (Thompson et al. 2001; Thompson 2003; Fontana et al. 2003; Kashikawa et al. 2003), or even suggest that the star–formation activity might actually increase with redshift (Lanzetta et al. 2002).
The current measures of UV specific luminosity density of LBGs come from the Hubble Deep Field survey (HDF, Williams et al. 1996, 2000) and other deep, but relatively small survey made with HST (Bouwens et al. 2003) or from ground–based surveys. The HST surveys are limited by its very small area, and thus cosmic volume, which makes it prone to systematic bias induced by cosmic variance (for example, S99 argue that the original result by Madau et al. (1996) was, at least in part, the effect of cosmic fluctuations). The ground–based surveys cover a much larger area, but at high redshifts the brightness of the night sky limits the sensitivity to only the bright end of the luminosity function. Unfortunately, LBGs are rather faint, with a characteristic magnitude at (based on Adelberger & Steidel 2000’s UV luminosity function at ) if no luminosity evolution occurs between and . Thus, one needs to reach rather faint flux limits, even for 8–m telescopes, to account for most of the light from LBGs once the redshift exceeds .
The GOODS/ACS observations offer a good compromise, covering an area times larger than the combined HDFs, with much deeper sensitivity out to wavelengths of nearly 1 m than that of most ground–based samples. This makes it possible to detect galaxies with luminosity fainter than up to . In this letter we present measures of the comoving specific luminosity density over the range based on the stack of three epochs of observations in both GOODS fields, the HDF–N and CDF–S. A companion letter by Dickinson et al. (2003, D03 hereafter) in this volume analyzes in greater detail the selection of galaxies at , including a discussion of the first spectroscopic identifications. Throughout, magnitudes are in the AB scale (Oke 1977), and the world model, when needed, is that of a flat universe with density parameters , and Hubble constant km s-1 Mpc-1.
2 DATA AND SAMPLE SELECTION
The data used in this letter are comprised of the first three epochs of observations, out of a total of five, of the GOODS/ACS survey (Giavalisco et al. 2003). They consist of eight mosaics, four in each of the two survey fields, and one in each of the , , and bands. Each mosaic covers an area approximately 10’x16’ in size with a scale of 0.05 arcsec/pixel. Table 1 of Giavalisco et al. (2003) lists the relevant parameters of the data, including the sensitivity. Source catalogs have been extracted using the SExtractor software, and the procedures are also described in Giavalisco et al. (2003). The catalogs used to select high–redshift galaxies have been created performing the source detection in the band and then using the isophotes defined during this process as fixed apertures for photometry in the other bands. We derive colors from isophotal magnitudes, but use the AUTO aperture–corrected magnitudes (in the SExtractor parlance) to measure the –band apparent magnitudes.
Samples of star–forming galaxies at high redshifts have been extracted from the matched catalogs using the Lyman–break technique (Madau et al. 1996; Dickinson 1998; S99, Steidel et al. 2003; see also Giavalisco 2002). Specifically, we have defined LBGs at (–band dropouts) using the colors equations:
and LBGs at (–band dropouts) by:
where and are the logical OR and AND operators, respectively. For bands which are entirely shortward of the Lyman discontinuity (e.g. the for the – and –band dropouts and the band for the –band dropouts) we also request a non detection with .
These selection criteria are largely based on our previous experience with Lyman–break galaxies (e.g. Dickinson 1998; S99; Steidel et al. 2003). We have visually fine–tuned them based on the observed colors of stars and galaxies in the ACS images, as well as on the ACS synthetic photometry from galaxy spectral templates to reject most interlopers from lower redshifts, while efficiently detecting typical UV–bright, star–forming galaxies at redshifts of interest.
Without a third band in the near–infrared, it is not possible to use a 2–color selection to define samples of LBGs at in analogy to what done above. Instead, we have used the single–color threshold
along with a non–detection requirement in the and bands to define our sample of –band dropouts. D03 discuss the selection and robustness of these dropouts in detail, including the use of available near–IR photometry as “a posteriori test” of the selection criteria. A number of galaxies meeting these criteria have already been confirmed spectroscopically to be at (Bunker et al. 2003; D03; Stanway et al. 2003b). Later on we discuss the implications of this different selection of LBGs on the measure of the specific luminosity density of the –band dropouts.
We have included in the samples only galaxies with in the band, and we have visually inspected each of them and removed sources that were deemed as not real, either artifacts or spurious detections (estimated using counts of negative sources detected in the same data set). These amount to a negligible number for the and samples, and % for the one. We have also eliminated from all samples sources with stellar morphology down to apparent magnitude , i.e. where such a morphological classification is reliable. These amount to the %, % and % for the , and samples, respectively. While the procedure bias our samples against LBGs that are unresolved by the ACS, it prevents contamination by galactic stars. In practice, it results in negligible changes to the measured specific luminosity density. Furthermore, while the vast majority of galaxies at have -, photometric errors scatter some of these galaxies into our selection window. Thus, we have also purged the –band sample from photometric–scatter interlopers using a statistical procedure. We have used a bright sub–sample of field galaxies, for which the photometry is very accurate, as a template of the color distribution of the sample as a whole and estimate the contamination using photometric errors as function of magnitude derived from the Monte Carlo simulations in each band (see D03).
Down to , roughly the %–completeness flux limit for unresolved sources (see Figure 4 of Giavalisco et al. 2003), the culled samples include 1115, 275 and 122 –band, –band and –band dropouts, respectively. With a survey area of 316 arcmin2, this corresponds to surface density , and galaxies per arcmin2, respectively, where the error bars have been derived assuming Poisson fluctuations.
3 THE UV COMOVING SPECIFIC LUMINOSITY DENSITY
Because no systematic spectroscopic observations of the GOODS are available yet, we have used Monte Carlo simulations to estimate the redshift distribution function of the three samples. The technique consists of generating artificial LBGs distributed over a large redshift range (we used ) with assumed distribution functions of UV luminosity (we used a flat distribution, see later), SED, morphology and size. We have adjusted the input distribution functions of SED and size by requiring that the distribution functions recovered from the simulations using identical procedures as for the real Lyman–break galaxies match the observation at . In this way, both simulations and observations are subject to similar incompleteness, photometric errors in flux and color, blending, and other measurement errors. We have obtained the SED using the unobscured synthetic spectrum of a continuously star–forming galaxy with age yr, Salpeter IMF and solar metallicity (Bruzual & Charlot 2000), and reddened it with the starburst extinction law (Calzetti 2000) and randomly extracted from a gaussian distribution with and . For the cosmic opacity, we have used the Madau (1995) prescription extrapolated to . We have used an equal number of and exponential profiles with random orientation, and size extracted from a log–normal distribution function, as described by Ferguson et al. 2003, this volume, Figure 2).
For a given dropout sample, the main output from the simulations is the probability function that a LBG with absolute magnitude at redshift is observed as having apparent magnitude . A commonly used technique to derive the specific luminosity density of LBGs in this case is that of the “effective volume” (S99), where the spatial volume occupied by galaxies with apparent magnitude in the sample is
The comoving specific luminosity density contributed by such galaxies is then estimated as
where is the average redshift of the simulated galaxies that have been selected into the sample, are the number counts of real Lyman–break galaxies observed with magnitude , and is the specific luminosity of one such galaxy if placed at redshift . The specific luminosity density is then . The method provides a relatively accurate estimate in the case of the color–color selected –band and –band dropout samples, regardless of the assumptions about the UV luminosity distribution function used in the simulations, because these galaxies are selected based only on their observed SED, i.e. redshift, with little dependence of their intrinsic luminosity. In other words, these LBGs have a relatively tight correlation of and up to the the detection limit.
For the one–color selected –band dropouts the method underestimates the value of , because in this case there is no tight correlation between absolute and apparent magnitude in the sample. Galaxies with a given apparent magnitude now have absolute magnitude distributed in a much larger interval, because whether or not they enter the sample depends on both their redshift and on their absolute magnitude. Specifically, the lower redshift bound is set by the color threshold, while the upper bound depends strongly on galaxy luminosity, as IGM opacity suppresses the –band flux at higher redshifts. Hence, the effective volume is overestimated (unless in the simulation one uses the same intrinsic luminosity function fo the real galaxies), because in the simulations galaxies with widely different absolute magnitude are equally represented. In this case we have measured with a different procedure. We have done a minimization to find the intrinsic luminosity function of the simulated galaxies such that once inserted into the real images and retrieved their number count
is best–fit to the number count of the real galaxies. We use a Schechter function with slope fixed to the value found at (Adelberger & Steidel 2000, AS00 hereafter), namely , and derive the parameter and from the fit. In practice, since our data only reach down to at most, the assumption of a fixed value of is a relatively minor one (we verified that values in the range change our results by at most %). The specific luminosity density is then simply , and for each redshift value this is computed using the corresponding sample’s best–fit luminosity function (a detailed description of the fits and of the analysis of the result is the subject of a forthcoming paper).
We found the average redshift and standard deviation of the redshift distribution to be and for the –dropout sample, and for the sample, and and for the one. For each sample we have estimated at Å () using K–corrections derived from a template LBG with the same UV color as the average one in the –band dropout sample. We have derived integrating the luminosity function down to the “observed” limit, i.e. the absolute magnitude that for each sample corresponds to an apparent magnitude of =26.5, and we have also estimated the (relatively small) corrections so that all the measures reach the same absolute magnitude, which we have chosen to be that of the B–band dropout sample (). Finally, when using the method, we have also estimated the magnitude–dependent corrections for light losses due to finite aperture photometry that we have derived from the Monte Carlo simulations.
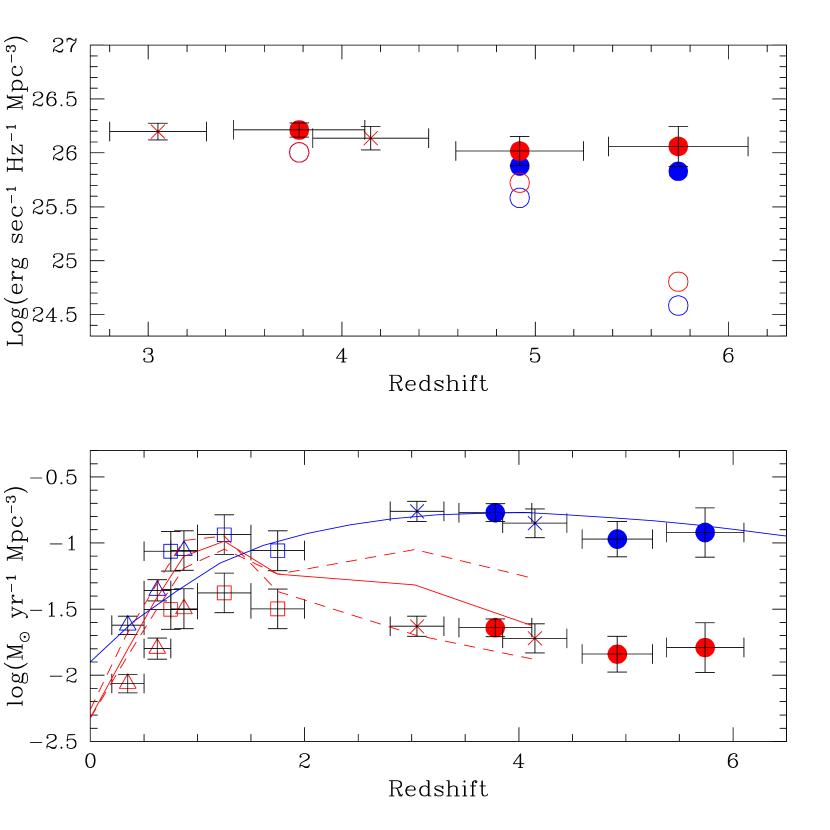
The top panel of Figure 1 shows for the GOODS three samples derived using the two methods above, both the “observed” values and those corrected to the same absolute magnitude, compared to the measures at and by S99. It can be seen that the two methods provide similar results for the and dropout samples, but differ for the –band dropouts. Note that the luminosity function correction is relatively small for the –band dropouts, but increases for the –band ones, as the =26.5 limit of the sample corresponds to a brighter intrinsic luminosity at higher redshift. The bottom panel of the figure shows the star–formation density as a function of redshift. For the GOODS points we have used the conversion factor by Madau et al. (1998), namely SFR in units of M⊙ yr-1 Mpc-3; the other points are from S99, after conversion to our world model and correcting for the smaller range of absolute luminosity, i.e. instead of . Both the observed values and those corrected for dust obscuration as suggested by AS00 are plotted.
4 DISCUSSION AND CONCLUSIONS
The specific luminosity density of LBGs appears to depend rather weakly on redshift over the range . Integrating down to , S99 report , while from the GOODS data we find , , and in units of erg s-1 Hz-1 Mpc-3 (1– error bars). However, while the points at are relatively robust, the constraint at is still somewhat weak, because it critically depends on the measure of the number counts near the sensitivity limit of the survey (see D03). For example, if we restrict the sample to –band photometry with (roughly ) then we found that the best-fit specific luminosity density drops down to erg s-1 Hz-1 Mpc-3 ( 2–). At face value this is still a relatively mild drop from the value, a factor , smaller than the factor proposed by Stanway et al. (2003), but the error is too large for the constraint to be meaningful. We note, though, that the point, which is more robust than the one and does not need as big an extrapolation down the luminosity function, is reasonably consistent with the mild evolution scenario, lending support to our best estimate at .
Thus, the result at depends somewhat critically on the apparently substantial amount of light contributed by the faint galaxies. To the best of our knowledge the galaxies with are real candidates. Based on our color selection, the observed dispersion of colors of faint galaxies, our simulations, and the expected colors of galaxies of various spectral types, we believe that our statistical corrections to the contamination is adequate and is not introducing a major systematic error in our measures. The very good agreement with the measure by S99 at , which is supported by systematic redshift identification of the galaxies, adds credence to this assertion. The current spectroscopic identifications at (Bunker et al. 2003; D03; Stanway et al. 2003b) agree well with our predicted redshift distribution and also support this conclusion. The samples are still too sparse, however, to attempt a measure of the efficiency of the selection criteria and, thus, the contamination. Clearly, the measure of clearly needs to be revisited with deeper data.
In any case, our measure at is in overall good agreement with other similar measures from HST and ground–based data (Bouwens et al. 2003; Lehnert & Bremer 2003). Stanway et al. (2003a,b) report a factor decrease of the specific luminosity density, although this is also very likely in agreement with our resultof because they limit their measure to bright galaxies, i.e. . Actually, a direct quantitative comparison is difficult because of the difference in the sample selection and the pronounced dependence of on the faint counts. These authors also use the GOODS data, but they base their source detection on single–epoch images (we use a stack of three epochs), therefore necessarily reaching a shallower flux level and larger incompleteness111They also use a slightly different color selection criterion, namely -. As D03 observe, this misses one of the galaxies spectroscopically confirmed at .. Down to they find a total of 14 galaxies over 350 arcmin2 (0.040 arcmin-2), while to the same flux level and using their same criteria we find 35 galaxies over 316 arcmin2 (0.11 arcmin-2). Also, note that they use the method to derive , which, as we have detailed above, underestimates the specific luminosity density for the –band dropouts.
Our measures are in good quantitative agreement with another deep, large–area LBG survey at (Iwata et al. 2003) and also with surveys based on photometric redshifts (Thompson et al. 2001; Thompson 2003; Fontana et al. 2003; Kashikawa et al. 2003). They differ from some of the photometric redshift estimates (from the HDF) by Lanzetta et al. (2002), who, after correcting for bias in the photometry due to the cosmological dimming, conclude that the specific star–formation density either remains constant up to , and then increases afterward, or increases monotonically. While we do explicitly account in our measure corrections for light losses due to finite aperture photometry (estimated from the Monte Carlo simulations), we do not find as large corrections as those suggested by Lanzetta et al (2002). Very likely, much of the difference is that our corrections are derived by requiring that the galaxy size distribution used as input in our Monte Carlo simulations is such that the output distribution matches the observations at (this roughly corresponds to assuming that the sizes evolve as ; see Ferguson et al., this volume), while Lanzetta et al.’s corrections are based on the light distribution of galaxies at , i.e. at considerably lower redshifts.
It is not known if the UV specific luminosity density of Lyman–break galaxies at is a fair tracer of the cosmic star formation activity (e.g. AS00). Regardless, if the dust obscuration properties of these sources are similar to local starburst galaxies (Meurer et al. 1999; Calzetti 2000), and do not significantly change over the redshift range , then our result can be rephrased by saying that the star–formation activity of LBGs decreases very mildly with increasing redshift, at being % lower than it was around its maximum at , several Gyr earlier. Since LBGs are certainly sites of formation of a considerable amount of the present–day cosmic stellar mass density (AS00; Giavalisco 2002) it appears that the onset of substantial cosmic star formation takes place earlier than , namely at less than % of the cosmic age. Finally, Figure 1 also shows that there is an overall good agreement between the dust–corrected data points and the semi–analytical models by Somerville et al. (2001, blue curve), and between the uncorrected data points and the predictions based on the observed evolution of the neutral HI mass density as traced by DLA (which include the effect of dust obscuration) at least up , where these systems are known with goods statistics (Pei et al. 1999, red curves).
What is the number of hydrogen–ionizing photons expected from our band dropouts at ? Since the rest-frame UV continuum at 1500 Å is dominated by the same short-lived, massive stars that are responsible for the emission of photons shortward of the Lyman edge, the needed conversion factor, about one ionizing photon above 1 ryd for every 5 photons at 1500 Å, is fairly insensitive to the assumed initial mass function and is independent of the galaxy history for ages yr (Madau, Haardt, & Rees 1999; Haiman, Abel, & Madau 2001). Here we normalize the number of ionizing photons to the observed 1500 Å flux (rest-frame), i.e. we bypass the need for any correction due to dust extinction. A comoving luminosity density of erg s-1 Hz-1 Mpc-3 implies then a comoving production rate of H-ionizing photons s-1 Mpc-3, or about 5 photons per hydrogen atom per yr escaping into the intergalactic medium. Here is the average escape fraction of ionizing radiation from the galaxy HIlayers relative to the escape fraction at 1500 Å. Photoionization of intergalactic hydrogen requires more than one photon above 1 ryd per hydrogen atom, as extra photons are needed to keep the gas in overdense regions and filaments ionized against radiative recombinations. If is greater than a few tens of a percent, then our population of dropouts may contribute significantly to the UV metagalactic flux, and help to reionize the universe by redshift 6.
Support for the GOODS HST Treasury program was provided by NASA through grants HST-GO09425.01-A and HST-GO-09583.01 from the Space Telescope Science Institute, which is operated by the Association of Universities for Research in Astronomy, under NASA contract NAS5-26555. PM acknowledges support by NASA through grant NAG5-11513. We thank the referee, Dr. Adriano Fontana, for a very careful and thoughtful report.
References
- (1)
- (2) Adelberger, K.L., & Steidel, C.C. 2000, ApJ, 544, 218, AS00
- (3) Bouwens, R., et al. 2003, ApJ, in press, astro–ph/0306215
- (4) Bunker, A., et al. 2003, MNRAS, submitted, astro–ph/0302401
- (5) Calzetti, D. 2000, PASP, 113, 1449
- (6) Dickinson, M. E. 1998, in “The Hubble Deep Field”, eds. M. Livio, M. S. Fall, & P. Madau, Cambridge University Press, p. 219
- (7) Dickinson, M., et al. 2003, ApJ, submitted, this volume, D03
- (8) Ferguson, H.C., et al. 2003, ApJ, submitted, this volume
- (9) Fall, S.M., Charlot, S., Pei, Y.C. 1996, ApJ, 464, 43
- (10) Fan, X., et al. 2002, AJ, 123, 1247
- (11) Fontana, A. et al. 2003, ApJ, 587, 544
- (12) Giavalisco, M. 2002, ARA&A, 40, 579
- (13) Giavalisco, M., Steidel, C. C., & Macchetto 1996, ApJ, 470, 189
- (14) Haiman, Z., Abel, T., & Madau, P. 2001, ApJ, 551, 599
- (15) Iwata, I., et al. 2003, PASJ, in press, astro–ph/0301084
- (16) Kashikawa, N., et al. 2003, AJ, 125, 53
- (17) Lanzetta, et al., 2002 ApJ, 570, 492
- (18) Lehnert, M.D., & Bremer, M. 2003, ApJ, in press, astro–ph/0212431
- (19) Madau, P., Haardt, F., & Rees, M. J. 1999, ApJ, 514, 648
- (20) Madau, P. Ferguson, H. C., Dickinson, M. E., Giavalisco, M., Steidel, C. C., & Fruchter, A. 1996, MNRAS, 283, 1388
- (21) Madau, P., Pozzetti, L., & Dickinson, M. E. 1998, ApJ, 498, 106
- (22) Meurer, G.R., Heckman, T.M., & Calzetti, D. 1999, ApJ, 521, 64
- (23) Oke, J. B. 1974, ApJS, 27, 21
- (24) Pei, Y.C., Fall, S.M., Hauser, M.G. 1999, ApJ, 522, 60
- (25) Somerville, R., Primack, J.R., & Faber, S.M. 2001, MNRAS, 320, 289
- (26) Stanway, E., Bunker, A., & McMahon, R. 2003a, MNRAS, in press, astro–ph/0302212
- (27) Stanway E., et al. 2003b, ApJ, submitted, astro–ph/0308124
- (28) Steidel, C. C., Adelberger, K. L, Giavalisco, M., Dickinson, M. E., & Pettini, M. 1999, ApJ, 519, 1, S99
- (29) Steidel, C. C., Pettini, M., & Adelberger K. L. 2001, ApJ, 546, 665
- (30) Steidel, C.C., Adelberger, K.L., Shapley, A.E., Pettini, M., Dickinson, M. & Giavalisco, M. 2003, ApJ, in press, astro–ph/0305378
- (31) Thompson, R.I., Weymann, R.J., & Storrie–Lombardi, L.J. 2001, ApJ, 546, 694
- (32) Williams, R. E. et al. 1996, AJ, 112, 1335
- (33) Williams, R. E. et al. 2000, AJ, 120, 2735