Search for High Energy Gamma Rays from an X-ray Selected Blazar Sample
Abstract
Our understanding of blazars has been greatly increased in recent years by extensive multi-wavelength observations, particularly in the radio, X-ray and gamma-ray regions. Over the past decade the Whipple 10 m telescope has contributed to this with the detection of 5 BL Lacertae objects at very high gamma-ray energies. The combination of multi-wavelength data has shown that blazars follow a well-defined sequence in terms of their broadband spectral properties. Together with providing constraints on emission models, this information has yielded a means by which potential sources of TeV emission may be identified and predictions made as to their possible gamma-ray flux. We have used the Whipple telescope to search for TeV gamma-ray emission from eight objects selected from a list of such candidates. No evidence has been found for VHE emission from the objects in our sample, and upper limits have been derived for the mean gamma-ray flux above 390 GeV. These flux upper limits are compared with the model predictions and the implications of our results for future observations are discussed.
1 Introduction
According to the unified scheme of active galactic nuclei (AGN) a blazar is considered to be any radio loud AGN which displays highly variable, beamed, non-thermal emission from radio to gamma-ray wavelengths (Urry Padovani, 1995). The non-thermal emission is believed to originate from a population of electrons moving with relativistic velocity along a plasma jet oriented with a small angle to the line of sight (e.g. Sikora, 1994). In a plot, the spectral energy distribution (SED) of blazars shows two broad peaks, one at energies ranging from the infrared to the X-ray band and the other in the gamma-ray band. Two approaches have been taken to characterize the blazar SED: a phenomenological approach (Fossati et al., 1998), where the bolometric source luminosity largely governs the blazar SED, and more model-dependent approaches. Several models have been put forward in an attempt to explain the blazar SED, the most frequently cited of which is the Synchrotron-Self-Compton (SSC) model. In this model, the origin of the first peak is synchrotron emission from relativistic electrons which are then upscattered by the inverse Compton (IC) process to form the second peak in the gamma-ray band (e.g. Bloom Marscher, 1996). In External Compton (EC) models, the synchrotron emission may be accompanied by ambient soft photons of different origin as a target for the IC process (Dermer Schlickeiser, 1993; Sikora et al., 1994; Ghisellini Madau, 1996).
BL Lacertae (BL Lac) objects are a blazar sub-class, characterised by their lack of strong emission or absorption lines, in which the second peak of the SED can extend up to very high (GeV-TeV) energies. They are therefore preferred targets of ground-based observations with atmospheric Čerenkov telescopes. Using these observations to determine the position of the second peak of the SED allows us to constrain associated parameters of emission models, most importantly, the intensity of the magnetic field and the maximum energy to which the particles responsible for the emission are accelerated (e.g. Buckley, 1999).
TeV gamma rays from extragalactic sources suffer absorption by interaction with photons from the IR background radiation (Gould Schreder, 1966; Primack et al., 1999; de Jager Stecker, 2002). A large TeV BL Lac sample containing objects at a range of redshifts would provide the means to distinguish between intrinsic spectral features and the effects of absorption by the infrared background. However, at present, the list of known TeV BL Lacs is very small and needs to be expanded. The limited field of view of Čerenkov telescopes and their low duty cycle forces us to select, a priori, the most promising target objects from a catalogue of candidates for study. In the past the Whipple Collaboration has targeted the nearest northern hemisphere BL Lacs and this approach resulted in several positive detections: Mrk 421 () (Punch et al., 1992), Mrk 501 () (Quinn et al., 1996) and 1ES2344+514 () (Catanese et al., 1998). In addition, observations of BL Lacs with the peak of the first component of their SED extending far into the X-ray band ( keV) led to the detection of the most distant TeV source 1ES1426+428 () (Horan et al., 2002). Most recently, 1ES1959+650 (Holder et al., 2002) was detected at TeV energies in an intense flaring state, using the Whipple telescope. This object is also a close BL Lac () whose status as a TeV source was confirmed following marginal detection in 1998 at TeV energies by the Utah Seven Telescope Array collaboration (Nishiyama et al., 1998).
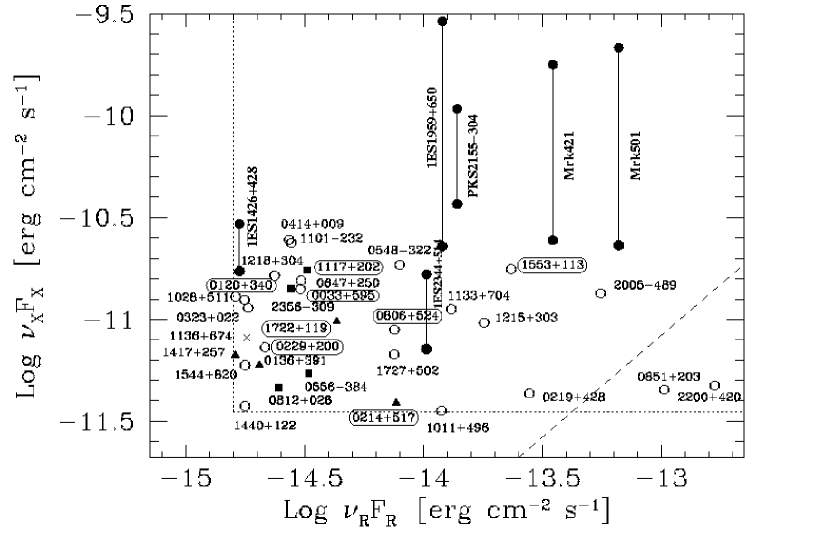
In this paper, we report on candidate TeV sources selected following the work of Costamante Ghisellini (2002). Their BL Lac catalogue is the first to provide estimates of TeV fluxes based on detailed model predictions and includes successful predictions of the TeV flux of 1ES1959+650 in its flaring state (Aharonian et al., 2003). The catalogue consists of objects bright in both the X-ray and radio bands; i.e. objects with both electrons energetic enough to upscatter seed photons to TeV energies and a high density of seed photons to be upscattered. The radio and X-ray fluxes are plotted in Figure 1 and, as can be seen, the sample includes established TeV sources (including PKS2155-304 () (Chadwick et al., 1999)). The gamma-ray flux at TeV energies is estimated by applying a homogeneous one-zone SSC model (Ghisellini et al., 2002) and by using the phenomenological parameterisation of the blazar SED developed by Fossati et al. (1998) and adapted by Costamante Ghisellini (2002). The latter approach by Costamante Ghisellini (2002) was motivated by a desire to better describe the SEDs of low power blazars. These flux estimates allow us to assess the detectability of this sample of BL Lacs using present, or future, more sensitive, atmospheric Čerenkov telescopes. However, the dramatic variability of these sources significantly adds to the uncertainty of detecting a source at any given time.
We observed eight objects selected from this sample (Section 2). In Sections 3 and 4 we present a summary of the TeV data and discuss a new analysis method of background estimation suited to our observation strategy. The upper limits derived from our observations are summarised in Section 5.1 and discussed within the framework of the popular emission models. Our observations are compared with RXTE All Sky Monitor (ASM) X-ray data where available (Section 5.2). In Section 6 we discuss implications of non detections of these candidates for future observations.
2 Selection of AGNs for Whipple Observations
We have chosen from the BL Lac candidate list developed by Costamante Ghisellini (2002), the most suitable candidates for TeV observations. We preferentially selected objects which culminate at an angle to the zenith and objects with redshifts smaller than 0.2, where opacity due to pair production is not so extreme as to prevent detection. Based on the prediction of Fossati et al. (1998), we required that the flux above 0.3 TeV should be greater than of the Crab Nebula flux so as to keep observing time below a reasonable value of hours per source. In some cases the selection of objects was biased by the past record of X-ray activity, i.e., episodes of flaring activity.
After the selection criteria were applied, 6 objects were identified as the best target candidates for TeV observations by the Whipple 10 m telescope during the 2001-2002 observing season (circled sources in Figure 1): 1ES0033+595, RGBJ0214+517, 1ES0229+200, 1ES0806+524, RGBJ1117+202 and RGBJ1725+118. Although at a higher redshift, two extra objects, 1ES0120+340 and 1ES1553+113, were included in this work since both belong to the list of TeV candidates and were observed in the same season by the Whipple telescope. The selection of these two objects was based upon their extreme nature (Ghisellini, 1999), both having many similarities in their broadband properties to 1ES1426+428. Table 1 lists the selected objects along with the predicted flux values.
3 Observations
VHE observations reported here have been made with the Whipple Observatory 10 m gamma-ray Telescope (Cawley et al., 1990) on Mt. Hopkins, Arizona. Čerenkov radiation produced by gamma-ray and cosmic-ray induced atmospheric showers is recorded by a high resolution camera located on the focal plane. The recent camera (Finley et al., 2001) is equipped with 379 photomultiplier tubes (PMTs), giving a total field of view (FOV) of diameter. This inner part of the camera is surrounded by three circular rings of 111 PMTs which extend the FOV to diameter. The telescope uses a hardware pattern recognition trigger which suppresses accidental triggers due to the night sky background light (Bradbury, 1999). Only the inner 331 PMTs participate in the telescope trigger. Although the signals from the outer 111 PMTs are recorded by the electronics, they are not involved in the analysis process used here. Table 2 shows the telescope’s performance based on of Crab Nebula observations, the standard candle for TeV astronomy, which were taken over the same period of time as the observations reported here. The telescope energy threshold (defined as the energy at which the response to a Crab-like source peaks) was 390 80sys GeV during the same period of time.
Observations were carried out between 2001 October and 2002 July, with total observing times on individual sources ranging from a few hours to about 20 hours and restricted to zenith angles less than 30∘. For comparison purposes we also summarise observations on the detection at TeV energies of 1ES1426+428 and 1ES1959+650. The observations of 1ES1426+428 reported in Horan et al. (2002) correspond to the period of time between 2001 February and 2001 June when the object was observed most extensively and a detection was claimed above a 5 level by the Whipple Collaboration. 1ES1959+650 data (Holder et al., 2002) are taken from observations of the source during a flaring state between 2002 May and 2002 July. All observations are summarised in Table 3.
The database consists of ON-source observations, typically each of 28 minutes duration. A subset of observations are accompanied by control OFF-source observations which target a region of the sky free from known gamma-ray sources. The OFF-source observation is taken directly before or after the ON-source observation on a region offset 30 minutes in right ascension from the ON-source region, thereby following the same elevation-azimuth path in the sky as the candidate source.
Predicted flux levels based on the parameterised SED of Fossati et al. (1998) (L. Costamante 2001, private communication) have been used to estimate how much ON-source observing time would be required to achieve a 5 detection for each source. These flux estimates give us the most optimistic time exposure required to achieve a significant detection. Table 1 shows the predicted flux values along with the required ON-source observing time. Required observing times have been obtained based on the telescope sensitivity to a Crab-like source (and assuming background rates similar to those of the Crab OFF-source region).
The stability of cosmic-ray trigger rates and throughput factor, a measurement of the change in telescope efficiency according to the procedure described in Le Bohec Holder (2003), are monitored every observing night and have been used in this work to select individual data runs in order to provide good quality data sets.
4 Analysis Technique
The data have been subjected to the standard image processing analysis where recorded Čerenkov images are parameterised using a moment analysis (Hillas, 1985). A set of image parameter cuts (Supercuts 2000), optimised on Crab Nebula data, was applied in order to identify candidate gamma-ray events based on the image shape (width and length), location (distance) and orientation (alpha) (Reynolds et al., 1993). The image parameter domain used in this work in order to select gamma-ray candidate events, is summarised in Table 4.
The aim of any analysis method is to estimate the mean number of photons coming from the source direction, which requires a reliable estimate of the number of background cosmic-ray events. Ideally, an equal exposure of ON-source observations and control OFF-source observations is used; however in an attempt to increase the total ON-source exposure times, many runs are taken with no accompanying control OFF-source observations. Prior to this work, the background for these observations was directly estimated from the ON-source observations themselves, using events with orientations alpha such that they are not from the direction of the source (Catanese et al., 1998). To avoid possible systematic effects introduced by this method when estimating the statistical significance of an excess, an alternative method of determining the number of background events has been considered. The concern is that in order to reach the predicted flux levels for the sources considered in this work, long exposure times are required to achieve a significant detection. We therefore need to ensure that systematic errors are kept to a minimum.
The method involves selecting any OFF-source observation, recorded at similar elevations and preferably on the same night as the ON-source observation of interest. This ‘matching’ procedure is carried out qualitatively by comparing five different factors: date, throughput factor, mean elevation, mean sky noise and number of pixels turned off during data taking (to avoid bright stars in the field of view). The first two are chosen to ensure that the telescope performance and weather conditions are the same for ON-source and OFF-source observations. The other three parameters are chosen to ensure as much as possible that the shape of the image parameter distributions is similar within statistical fluctuations.
Once ON/OFF matched pairs are obtained, standard ON/OFF analysis is performed, including software padding (Cawley et al., 1993) to compensate for differences in sky brightness between the ON-source observations and the corresponding control OFF-source observations. After matching and padding, the distribution of the parameter alpha for the ON-source and OFF-source observations is obtained. Despite the care taken to match ON-source and OFF-source observations, a remaining difference in the total number of events after image cuts, due largely to small differences in the zenith angles of the matched pairs, has still to be corrected for. This is done by introducing a scaling factor (SCF) which scales both alpha distributions, corresponding to the ON-source and OFF-source observations, using the total number of events in the alpha region from to . Table 5 shows the SCF for the sources considered in this work (in brackets in the column headed Events). Where genuine ON/OFF pairs are available, these are added to the matched pairs before scaling the alpha distributions.
When no significant excess of a signal over the background is found, it is possible to set an upper limit to the mean gamma-ray flux expected from the source direction. Calculations of flux upper limits depend on the number of background events and the number of events coming from the source direction. In this work, flux upper limits are calculated in several steps, in a similar way to the approach of Aharonian et al. (2000). Firstly, the method of Helene (1983) is applied to set an upper limit to the mean number of gamma-ray events expected from the source direction. When applying this method we required that the number of background events is always smaller than the number of events coming from the source direction, i.e. that the mean number of source counts is always positive. If the opposite is true a conservative approach is taken and the number of events coming from the source direction is made equal to the number of background events. Secondly, the upper limit in source counts is converted into a fraction of the Crab Nebula flux by comparison with contemporaneous Crab Nebula observations (ULc). The conversion into absolute flux units is straightforward using the Crab Nebula flux (Hillas et al., 1998) above the energy threshold, Eth, of the observations (F TeV) = 8.30 erg cm-2 s-1). A more general equation can be used (see eq. [1]) to obtain the upper limit using the Crab Nebula flux above any given energy, E:
| (1) |
This method assumes that the Crab Nebula flux is stable over time (Hillas et al., 1998) and that the differential spectrum () of the putative source is similar to that of the Crab Nebula ( where =2.49). The only uncertainty to be taken into consideration on the flux upper limits is that introduced by the normalization of the Crab Nebula flux, i.e. the uncertainty in the Crab Nebula photon flux. Above the telescope energy threshold (390 GeV) the uncertainty is and above 1 TeV, (Catanese et al., 1998). The amount of IR absorption plays an important role in modelling the blazar SED at high energies (the emission models should account for the intrinsic spectra and not the IR absorbed ones) so estimates have been obtained for the amount of IR absorption expected in each case according to the source redshift and assuming again a Crab-like source spectrum.
5 Results
5.1 Flux Upper Limits
Table 5 summarises the results of the complete set of observations on the 8 selected sources. As this class of source is known to be highly variable, light curves (source count rates vs. time) have been used to search for episodes of emission on three different timescales: 28 minute, daily, and monthly. No evidence for variable VHE emission has been seen over any of these time scales. Flux upper limits are given at a () confidence level (c.l.) in Crab and absolute flux units above the energy threshold of 390 GeV. Upper limits are also reported above 1 TeV by reducing the flux at 390 GeV by 75, which assumes again a Crab-like spectrum.
Table Search for High Energy Gamma Rays from an X-ray Selected Blazar Sample shows the flux upper limits derived in this work as compared to the two predicted fluxes given in Costamante Ghisellini (2002). The estimated percentage of absorption of the gamma-ray photon flux due to the IR background is also given. For two of the objects in our sample, RGBJ0214+517 and RGBJ1725+118, the flux upper limit, IR absorption corrected, is below the value predicted by the adapted version of the Fossati parameterisation above 0.3 TeV. According to this parameterisation, the predicted fluxes are derived from SEDs that represent the average state of a source in a given radio luminosity range. The SEDs were derived including also those of the known TeV blazars; therefore it is considered that the derived flux estimates from these SEDs are more representative of a high emission state. On the contrary, the SSC model considered (Ghisellini et al., 2002) is designed to fit only the synchrotron spectra of the sources, more representative of a quiescent state. The inverse Compton component is then inferred from the synchrotron one. Upper limits derived in this work do not contradict the SSC-predicted TeV emission above 0.3 TeV since in all cases our flux upper limits are well above the predicted value. For 1ES0229+200 there is a flux prediction above 0.3 TeV, of 0.02 Crab units (c.u.), by Stecker et al. (1996). Our flux upper limit on this source is not in contradiction with this.
The flux upper limits derived in this work have been compared with those previously available from the CAT (Piron, 2000) and HEGRA (Tluczykont et al., 2001; Aharonian et al., 2000) experiments where available (Table Search for High Energy Gamma Rays from an X-ray Selected Blazar Sample). A direct comparison of flux upper limits derived by the different experiments shows that they are of the same order of magnitude. For the sources listed in Table Search for High Energy Gamma Rays from an X-ray Selected Blazar Sample, flux upper limits derived by different experiments cannot be used to invalidate each other, since observations are not contemporaneous.
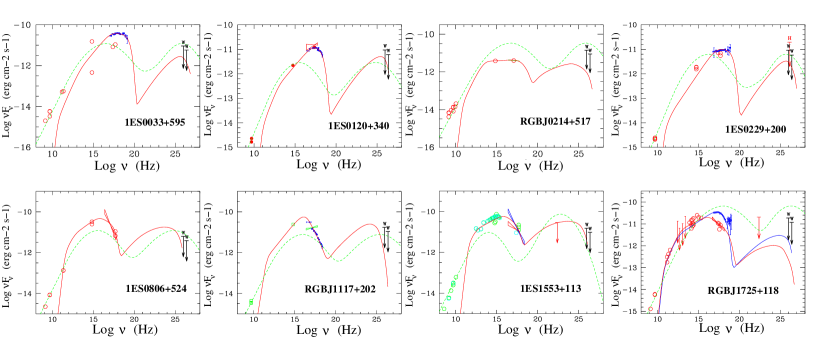
Figure 2 shows the SED of the 8 objects as described by an SSC model (solid lines) and by the adapted phenomenological parameterisation of Fossati (dashed lines) (Costamante Ghisellini, 2002). Flux upper limits obtained in this work are represented by arrows labelled as W at two energies, 390 GeV and 1 TeV.
We note additionally that, because of the time variability of high energy emission from these objects, the upper limits reported in this work are only valid for the period of time during which observations were carried out.
5.2 ASM X-ray Fluxes
The X-ray flux of the sources in our sample can provide an indication of whether enhanced TeV emission was expected over the period of the gamma-ray observations. According to the SSC model, if the same population of electrons is responsible for the two peaks observed in the blazar SED, an increase in the synchrotron photon flux would lead to a corresponding increase in the IC photon flux. In BL Lac objects the behaviour of the most energetic electrons is well monitored in the X-ray band (dominated by the synchrotron emission), and in the GeV-TeV band (dominated by IC emission). In fact, strong correlation has been observed between the fluxes in the X-ray and GeV-TeV band which match the predictions of the IC models (e.g. observations of Mrk501 in 1997 (Catanese et al., 1997b; Pian et al., 1998; Krawczynski et al., 2000), observations of Mrk421 in 1995 (Buckley et al., 1996) and 2001 (Holder et al., 2001)).
Data from the All Sky Monitor (ASM) on board the Rossi X-Ray Timing Explorer (RXTE) were available for 5 of the 8 sources in our sample, covering the period from 1997 January 1 to 2002 July 31. We calculated the mean X-ray flux over the exact period of time in which TeV gamma-ray observations reported here were taken, the average over the years 1997 through 2002 and the average on a yearly basis (see Table 7). This mean flux over long periods of time is not very representative for these types of objects which show very strong variability in their emission states over a range of timescales, from hours to years; however, from the comparison of these mean fluxes we conclude that the mean X-ray flux over the period of time in which TeV gamma-ray observations were taken does not increase significantly from the mean over all years for any of the sources. Only 1ES0806+524 shows a marginally higher than average X-ray flux during the year 2002 (in which gamma-ray observations were taken), 2.7 above the average X-ray flux over all years.
As a comparison, we have proceeded in the same way using ASM data corresponding to the known TeV sources Mrk421, Mrk501, 1ES1426+428 and 1ES1959+650 and present the results in Table 7. In the cases of 1ES1426+428 and 1ES1959+650 the mean X-ray flux during the period of time in which the TeV detection observations were taken is significantly higher than the mean over all years. Mrk421 and Mrk501 show a higher than average X-ray flux over the years 2001 and 1997 respectively; that is, in those two years when both objects showed periods of the highest gamma-ray activity observed (flux levels of up to 13 times that of the Crab Nebula flux in the case of Mrk421 (Krennrich et al., 2001) and up to 4 times that of the Crab Nebula flux in the case of Mrk501 (Catanese et al., 1997b)). However, there have been occasions when rapid X-ray or TeV flares have been seen without a corresponding flux variation in the other energy band (e.g. Mrk501 (Catanese Sambruna, 2000) and 1ES1959+650 (Krawczynski, 2003)).
From this simple study it is inferred, if we assume that the properties described above are representative of the general behaviour of BL Lac objects, that it is possible to use the mean X-ray flux, at least over long time scales, as an indicator of source activity, which in turn could result in enhanced emission of TeV gamma rays. Our sources show no evidence of a long-lasting period of high activity, as indicated by the average X-ray flux, over the period of time in which our TeV observations took place. Even for the well-established TeV sources, Mrk421 and Mrk501, there are periods of time in which the TeV fluxes fall below the sensitivity of current Čerenkov telescopes and are not detected, corresponding with periods of low X-ray activity (e.g. Piron, 2001). Also, it is inferred that the level of the mean X-ray flux can be used as a potential indicator of gamma-ray activity and might trigger follow-up gamma-ray observations.
6 Discussion
In this work we have observed a set of BL Lac objects selected from a sample of promising candidates for TeV emission, developed by Costamante Ghisellini (2002). This sample is comprised of objects that show high radio and X-ray fluxes since in order to produce a strong TeV signal by the IC process, a large number of energetic electrons and seed photons is required. These authors have also provided estimates of the TeV fluxes, according to a detailed SSC emission model, which can be used both to establish the detectability of this sample of objects and to test the model itself. Our TeV observations have resulted in a set of flux upper limits, above an energy of 390 GeV, which do not conflict with the predicted values according to current SSC models. We investigate here the possible reasons for these non-detections.
The first possibility is that the TeV fluxes are far below the sensitivity of current Čerenkov telescopes. The SSC model used to derive the flux estimates at TeV energies predicts TeV fluxes more representative of a quiescent state of the sources, and the estimated times required to guarantee a 5 detection are all above 500 hours (see Table 1). Considering that the available observing time with the Whipple telescope amounts to 700 - 800 hours per season, spending 500 hours of an observing season on a single source is not feasible. The current sensitivity of the Whipple telescope does not allow us to test the detectability of this sample of objects, i.e. our TeV observations do not allow a test of this SSC model. However, the next generation of Čerenkov telescopes, such as VERITAS-4 (Weekes et al., 2002), with a sensitivity above 300 GeV of erg cm-2 s-1 (5 mCrab) on a Crab-like source spectrum (50 hours for a 5 detection), would be able to reach the predicted flux levels in just a few hours of observations.
The second reason for our non-detections lies in the fact that the sources were not in a high flux emission state. Our simple study in Section 5.2 suggests that, at least for long-lasting flares, there is a correlation between X-ray and gamma-ray fluxes for the well established TeV blazars. We have shown that, for some of the objects in our sample, the ASM X-ray fluxes show no significant increase over the period of time during which the TeV observations reported here took place. Therefore, we may not have detected these objects at TeV energies because they were in a low flux emission state during this period of time.
Another possible reason for our non-detections could be that the sample used to select targets for TeV observations does not provide a reliable list of candidate BL Lacs for TeV emission. However, this explanation is weakened by the recent detections of 1ES1426+428 and 1ES1959+650 at TeV energies. These two objects belong to the candidate list developed by Costamante Ghisellini (2002) and have been detected at different emission states. The detection of 1ES1426+650 by the Whipple Collaboration came as a result of a long observing campaign during the year 2001 and since then there has been no strong evidence for TeV emission. On the contrary, 1ES1959+650 was detected on a nightly basis in a flaring state at a flux level of up to 5 Crab in May through July 2002. Since then no significant detection has been reported for that source. Due to the extreme variability that this type of object exhibits, our non-detections should not discourage future observations of objects selected from this sample.
The detection of 1ES1959+650 at TeV energies could be seen as an example to encourage future observations of this sample of objects. A flux upper limit of = 0.13 c.u. was derived by Catanese et al. (1997a) from observations in 1996, which is far above the flux level of 3 mCrab, above 0.3 TeV, predicted by the SSC model. With the Whipple telescope sensitivity, at a flux level of 3 mCrab, more than 26,000 hours of observations would have been required to achieve the detection of a gamma-ray signal at a 5 level. However, the HEGRA Collaboration reported the detection of this source in a more quiescent state from 95 hours observations during the 2000 and 2001 with the HEGRA system of telescopes (Aharonian et al., 2003). The VHE flux reported for this source during that period of time was at a level of that of the Crab Nebula flux. At this level 250 hours of observations with the Whipple telescope would be required for a significant detection.
Further work is in progress to extend the list of objects bright in both the X-ray and the radio band without pre-selection for source type. The ROSAT Bright Source Catalogue (Voges et al., 1999) has been used to produce a list of objects that would fall in the region delimited by Figure 1. 3C 120 () was selected from this list as one of the brightest objects in both bands. 3C 120 is a Seyfert I galaxy with the angle between the jet and the line of sight 20∘. Whipple observations (7.5 hours) during the 2002-2003 observing season resulted in a flux upper limit of cm-2 s-1 (20 that of the Crab Nebula flux). Also very recently, the work by Padovani et al. (2003) has identified a new population of flat-spectrum radio quasars (FSRQ) with SEDs resembling those of high-energy-peaked BL Lacs which are potential candidates for TeV emission. Observations of these new types of candidate, as well as continuing observations of the sources discussed in this paper, are in progress now with the Whipple telescope and will continue with the telescope array system VERITAS-4 which is currently under construction.
References
- Aharonian et al. (2003) Aharonian, F. A., et al. 2003, preprint (astro-ph/0305275)
- Aharonian et al. (2000) Aharonian, F. A., et al. 2000, AA, 353, 847
- Le Bohec Holder (2003) Le Bohec, S., Holder, J., 2003, Astroparticle Physics 19, 221
- e.g. Bloom Marscher (1996) Bloom, S. D., Marscher, A. P., 1996, ApJ 461, 657
- Bradbury (1999) Bradbury, S. M., 1999, in Proc. of the 26th ICRC, Salt Lake City, 5, 263
- e.g. Buckley (1999) Buckley, J. H., 1999, Astroparticle Physics, 11, 119
- Buckley et al. (1996) Buckley, J. H., et al. 1996, ApJ, 472, L9
- Catanese Sambruna (2000) Catanese, M., Sambruna, R., 2000, ApJ, 534, L39
- Catanese et al. (1998) Catanese, M., et al. 1998, ApJ, 501, 616
- Catanese et al. (1997a) Catanese, M., et al. 1997a, ApJ, 487, L143
- Catanese et al. (1997b) Catanese, M., et al. 1997b, in Proc. of the 25th ICRC, Durban, 3, 277
- Cawley et al. (1993) Cawley, M. F., et al. 1993, in Proc. of Towards a Major Atmospheric Cherenkov Detector II, Calgary (Canada), ed. R.C. Lamb, 176
- Cawley et al. (1990) Cawley, M. F., et al. 1990, Experimental Astronomy, 1, 173
- Chadwick et al. (1999) Chadwick, P. M., et al. 1999, ApJ, 513, 161
- Costamante Ghisellini (2002) Costamante, L., Ghisellini, G., 2002, AA, 384, 56
- Dermer Schlickeiser (1993) Dermer, C. D., Schlickeiser, R., 1993, ApJ, 416, 458
- Finley et al. (2001) Finley, J. P., et al. 2001, in Proc. of the 27th ICRC, Hamburg, 7, 2827
- Fossati et al. (1998) Fossati, G., et al. 1998, MNRAS, 299, 433
- Gould Schreder (1966) Gould, R. J., Schreder, G. P., 1966, Phys. Rev. Lett., 16, 256
- Ghisellini et al. (2002) Ghisellini, G., Celotti, A., Costamante, L., 2002, AA, 386, 833
- Ghisellini (1999) Ghisellini, G., 1999, Astroparticle Physics, 11, 11
- Ghisellini Madau (1996) Ghisellini, G., Madau, P., 1996, MNRAS, 280, 67
- Helene (1983) Helene, O., 1983, Nuclear Instruments and Methods, 212, 319
- Hillas et al. (1998) Hillas, A. M., et al. 1998, ApJ, 503, 744
- Hillas (1985) Hillas, A. M., 1985, in Proc. of the 19th ICRC, La Jolla, 3, 445
- Horan et al. (2002) Horan, D., et al. 2002, ApJ, 571, 753
- Holder et al. (2002) Holder, J., et al. 2002, ApJ, 583, L9
- Holder et al. (2001) Holder, J., et al. 2001, in Proc. of the 27th ICRC, Hamburg, 7, 2613
- de Jager Stecker (2002) de Jager, O. C., Stecker, F. W., 2002, ApJ, 566, 738
- Krawczynski (2003) Krawczynski, H., 2003, in Proc. of the 2nd VERITAS Symposium, Chicago
- Krawczynski et al. (2000) Krawczynski, H., Coppi, P. S., Maccarone, T., Aharonian, F. A., 2000, AA, 353, 97
- Krennrich et al. (2001) Krennrich, F., et al. 2001, ApJ, 575, L9
- Nishiyama et al. (1998) Nishiyama, T., Chamoto, N., Chikawa, M., et al. 1999, in Proc. of the 26th ICRC, Salt Lake City, 3, 370
- Primack et al. (1999) Primack, J. R., et al. 1999, Astroparticle Physics, 11, 93
- Quinn et al. (1996) Quinn, J., et al. 1996, ApJ, 456, L83
- Padovani et al. (2003) Padovani, P., Perlman, E. S., Landt, H., 2003, preprint (astro-ph/0301227)
- Perlman et al. (1996) Perlman, E. S., et al. 1996, ApJS, 104, 251
- Pian et al. (1998) Pian, E., Vacanti, G., Tagliaferri, G., et al. 1998, ApJ, 492, L17
- e.g. Piron (2001) Piron, F., et al. 2001, AA, 374, 895
- Piron (2000) Piron, F., 2000, PhD Thesis (C.A.T. Collaboration), University of Paris-SUD U.F.R. Scientifique D’Orsay
- Punch et al. (1992) Punch, M., et al. 1992, Nature, 358, 477
- Reynolds et al. (1993) Reynolds, P. T., et al. 1993, ApJ, 404, 206
- Sikora et al. (1994) Sikora, M., Begelman, M. C., Rees, M. J., 1994, ApJ, 421, 153
- e.g. Sikora (1994) Sikora, M., 1994, ApJS, 90, 923
- Stecker et al. (1996) Stecker, F. W., De Jager, O. C., Salamon, M. H., 1996, ApJ, 473, L75
- Tavecchio et al. (1998) Tavecchio, F., Maraschi, L., Ghisellini, G., 1998, MNRAS, 280, 67
- Tluczykont et al. (2001) Tluczykont, M., et al. 2001, Poster Session OG198 27th ICRC, Hamburg
- Urry Padovani (1995) Urry, C. M., Padovani, P., 1995, Publications of the Astronomical Society of the Pacific, 107, 803
- Voges et al. (1999) Voges, W., et al. 1999, AA, 349, 389
- Weekes et al. (2002) Weekes, T. C., et al. 2002, Astroparticle Physics, 17, 221
| Predicted Flux | Observing Time | |||||
|---|---|---|---|---|---|---|
| F(0.3 TeV) | F(1 TeV) | |||||
| FOSS/SSC | FOSS/SSC | FOSS/SSC | FOSS/SSC | Required | Exposure | |
| Source | (f.u.) | (c.u.) | (f.u.) | (c.u.) | (h) | (h) |
| 1ES0033+595 | 2.04/0.25 | 0.166/0.021 | 0.48/0.04 | 0.229/0.019 | 23/1482 | 12.02 |
| 1ES0120+340 | 0.28/0.30 | 0.024/0.025 | 0.06/….. | 0.029/….. | 1135/1047 | 5.05 |
| RGBJ0214+517 | 5.93/0.07 | 0.483/0.006 | 1.43/6.2E-3 | 0.681/0.003 | 2.8/18107 | 6.05 |
| 1ES0229+200 | 0.96/0.31 | 0.078/0.026 | 0.21/4.0E-3 | 0.100/0.002 | 101/968 | 14.69 |
| 1ES0806+524 | 1.36/….. | 0.111/….. | 0.27/….. | 0.129/….. | 50/….. | 18.70 |
| RGBJ1117+202 | 1.17/0.10 | 0.095/0.008 | 0.28/….. | 0.133/….. | 68/10189 | 3.26 |
| 1ES1553+113 | 0.20/0.42 | 0.016/0.035 | 0.02/….. | 0.010/….. | 2260/535 | 2.82 |
| RGBJ1725+118 | 12.80/0.015 | 1.043/0.001 | 3.52/1.0E-3 | 1.676/….. | 0.67/651240 | 2.33 |
| Observing | Exposure | Excess Events | Bkg(∗) Events | Sensitivity | |
|---|---|---|---|---|---|
| Season | (h) | (/min) | (counts/min) | (/ | |
| 2000 - 2001 | 19.7 | 8.3 | 3.36 0.20 | 8.66 0.13 | 5.74 |
| 2001 - 2002 | 18.7 | 23.7 | 2.75 0.10 | 5.88 0.06 | 5.57 |
| Equatorial Coordinates | Observing Period | Whipple Observatory | |||||
|---|---|---|---|---|---|---|---|
| r.a. | dec. | Redshift | Season | MJD | Max Ele | ||
| Source | (J2000) | (J2000) | (∘) | (∘) | |||
| 1ES0033+595 | 0.086(a) | Oct2001-Jan2002 | 52193-52283 | 62.1 | 29.0 | ||
| 1ES0120+340 | 0.272 | Oct2001-Nov2001 | 52195-52234 | 87.6 | 8.0 | ||
| RGBJ0214+517 | 0.049 | Oct2001-Jan2002 | 52197-52288 | 70.2 | 22.4 | ||
| 1ES0229+200 | 0.139 | Oct2001-Jan2002 | 52193-52289 | 78.3 | 17.0 | ||
| 1ES0806+524 | 0.138 | Nov2001-Mar2002 | 52228-52348 | 69.6 | 23.5 | ||
| RGBJ1117+202 | 0.139 | Dec2001-Feb2002 | 52265-52317 | 78.3 | 18.3 | ||
| 1ES1426+428 | 0.129 | Feb2001-Jun2001 | 51940-52073 | 79.3 | 19.0 | ||
| 1ES1553+113 | 0.360 | Apr2002-May2002 | 52373-52407 | 69.2 | 23.0 | ||
| RGBJ1725+118 | 0.018 | Apr2002-Jul2002 | 52374-52460 | 69.9 | 22.0 | ||
| 1ES1959+650 | 0.048 | May2002-Jul2002 | 52410-52463 | 56.8 | 40.1 | ||
Note. — Max Ele corresponds to the maximum elevation that the object reaches as observed from the Whipple observatory (latitude= 57.6’ N).
| Parameter | Cut | |
|---|---|---|
| Cleaning(a) | ||
| Picture | 4.25 | |
| Boundary | 2.25 | |
| Image | ||
| Length | - | |
| Width | - | |
| Distance | - | |
| Alpha | ||
| Length/Size(b) | /d.c.(c) | |
| Max1(d) | 30. d.c.(c) | |
| Max2(d) | 30. d.c.(c) | |
| Three neighboring pixels have to be above the | ||
| picture cut. | ||
| Mode | Exp. | Events | Events(a) | S | Rate | U.L | U.L | ||||
|---|---|---|---|---|---|---|---|---|---|---|---|
| Source | (h) | (RAW) | () | () | (/min) | (c.u.) | (f.u.) | (c.u.) | (f.u.) | ||
| 1ES0033+595 | ON | 12.02 | 29 | 967755 | 3794 | 0.42 | 0.05 0.12 | 0.11 | 0.97 | 0.03 | 0.24 |
| OFF | 12.04 | 26 | 997066 | 4023 (0.93)(b) | (5.56 0.09)(c) | ||||||
| 1ES0120+340 | ON | 5.05 | 8.0 | 436321 | 1241 | -0.49 | -0.08 0.16 | 0.12 | 1.00 | 0.03 | 0.25 |
| OFF | 7.44 | 10.1 | 647953 | 2034 (0.62)(b) | (4.55 0.10)(c) | ||||||
| RGBJ0214+517 | ON | 6.05 | 22.4 | 557988 | 1923 | 0.64 | 0.11 0.17 | 0.17 | 1.51 | 0.04 | 0.37 |
| OFF | 6.05 | 22.3 | 556078 | 1860 (1.01)(b) | (5.12 0.12)(c) | ||||||
| 1ES0229+200 | ON | 14.69 | 17.0 | 1341365 | 4570 | 0.74 | 0.08 0.11 | 0.11 | 0.97 | 0.03 | 0.24 |
| OFF | 15.82 | 15.0 | 1439227 | 4727 (0.95)(b) | (4.98 0.07)(c) | ||||||
| 1ES0806+524 | ON | 18.70 | 23.5 | 1856253 | 4956 | 0.14 | 0.01 0.09 | 0.08 | 0.67 | 0.02 | 0.16 |
| OFF | 18.83 | 23.0 | 1867487 | 4942 (1.00)(b) | (4.37 0.06)(c) | ||||||
| RGBJ1117+202 | ON | 3.26 | 18.3 | 348436 | 933 | 0.47 | 0.10 0.22 | 0.21 | 1.84 | 0.05 | 0.45 |
| OFF | 3.26 | 19.0 | 350701 | 915 (0.99)(b) | (4.69 0.15)(c) | ||||||
| 1ES1553+113 | ON | 2.82 | 23.0 | 238032 | 554 | 0.77 | 0.15 0.20 | 0.19 | 1.62 | 0.05 | 0.40 |
| OFF | 3.72 | 22.3 | 326616 | 743 (0.71)(b) | (3.32 0.12)(c) | ||||||
| RGBJ1725+118 | ON | 2.33 | 22.2 | 187298 | 489 | 0.67 | 0.15 0.22 | 0.23 | 1.98 | 0.06 | 0.49 |
| OFF | 2.33 | 22.2 | 189671 | 467 (1.00)(b) | (3.34 0.16)(c) | ||||||
| Flux Prediction | IR(a) | Whipple | CAT(3) | HEGRA(4) | ||
|---|---|---|---|---|---|---|
| F(0.3 TeV) | F(0.39 TeV) | F(0.25 TeV) | ||||
| FOSS/SSC(1) | Stecker(2) | U.L.97%c.l. | U.L.99.7%c.l. | U.L.99.9%c.l. | ||
| Source | (c.u.) | (c.u.) | (c.u.) | (c.u.) | (c.u.) | |
| 1ES0033+595 | 0.17/0.021 | ….. | 46 | 0.11 0.16(b) 0.23(c) | 0.45 | ….. |
| 1ES0120+340 | 0.02/0.025 | ….. | 88 | 0.12 0.18(b) 0.34(c) | ….. | 0.03 |
| RGBJ0214+517 | 0.48/0.006 | ….. | 30 | 0.17 0.25(b) 0.32(c) | 0.39 | ….. |
| 1ES0229+200 | 0.08/0.026 | 0.02 | 63 | 0.11 0.16(b) 0.26(c) | ….. | 0.25 |
| 1ES0806+524 | 0.11/….. | ….. | 63 | 0.08 0.12(b) 0.19(c) | 0.67 | ….. |
| RGBJ1117+202 | 0.09/0.008 | ….. | 63 | 0.21 0.31(b) 0.50(c) | ….. | ….. |
| 1ES1553+113 | 0.02/0.035 | ….. | 95 | 0.19 0.28(b) 0.55(c) | ….. | ….. |
| RGBJ1725+118 | 1.04/0.001 | ….. | 12 | 0.23 0.34(b) 0.38(c) | ….. | 0.09 |
References. — (1) Costamante Ghisselini 2002; (2) Stecker et al. 1996; (3) Piron 2000; (4) Tluczykont et al. 2001, Poster Session OG198 27th ICRC, Hamburg and Aharonian et al. 2000.
| Name(a) | 1997-2002(b) | 1997 | 1998 | 1999 | 2000 | 2001 | 2002(b) | |
|---|---|---|---|---|---|---|---|---|
| mCrab | mCrab | mCrab | mCrab | mCrab | mCrab | mCrab | mCrab | |
| 0120 | 2.15 0.11 | ….. | 2.52 0.27 | 2.74 0.22 | 1.25 0.23 | 2.35 0.25 | 1.63 0.36 | 2.33 0.71 |
| 0214 | 1.66 0.08 | 1.72 0.14 | 1.54 0.17 | 1.61 0.21 | 1.78 0.20 | 1.70 0.22 | 1.49 0.27 | 0.89 0.37 |
| 0229 | 1.78 0.08 | 2.64 0.16 | 1.20 0.17 | 1.11 0.22 | 1.70 0.20 | 1.86 0.24 | 2.10 0.31 | 1.05 0.37 |
| 0806 | 1.51 0.07 | 1.07 0.15 | 1.57 0.15 | 1.42 0.18 | 1.48 0.18 | 1.85 0.19 | 2.19 0.24 | 1.84 0.29 |
| 421 | 8.68 0.07 | 6.20 0.16 | 12.52 0.19 | 4.83 0.19 | 12.60 0.19 | 14.03 0.23 | 7.69 0.24 | 19.88 0.29(d) |
| 1426 | 2.88 0.08 | 2.30 0.18 | 2.99 0.17 | 2.68 0.19 | 3.22 0.19 | 3.42 0.20 | 2.75 0.22 | 3.69 0.33 |
| 501 | 7.32 0.06 | 15.57 0.16 | 7.65 0.15 | 5.69 0.16 | 5.39 0.17 | 4.26 0.17 | 4.34 0.21 | 17.35 0.27(e) |
| 1725 | 2.64 0.09 | 2.65 0.20 | 2.40 0.20 | 2.54 0.22 | 1.98 0.23 | 3.16 0.22 | 3.27 0.30 | 2.56 0.44 |
| 1959 | 3.75 0.06 | 2.57 0.12 | 2.62 0.14 | 4.06 0.14 | 5.05 0.16 | 4.54 0.15 | 4.77 0.19 | 6.48 0.39 |
501: Mrk501, 1725: RGBJ1725+118, 1959: 1ES1959+650.