Triggered massive-star formation at the border of the HII region Sh 104
We present millimetre-line imaging of the Galactic H ii region Sh 104. We show that it is surrounded by a ring of molecular gas and dust. Four large molecular condensations are regularly spaced around the ring. These condensations are themselves fragmented and contain several massive dense cores. A deeply embedded cluster is observed in the near IR towards the largest condensation. It contains at least one massive star ionizing an ultra-compact H ii region. The Sh 104 region is a good illustration of the ‘collect and collapse’ model for star formation triggered by the expansion of an H ii region.
Key Words.:
Stars: formation – Stars: early-type – ISM: H ii regions – ISM: individual: Sh2-1041 Introduction
The expansion of an H ii region may trigger star formation in various ways (see the review of Elmegreen 1998 and references therein). As an H ii region expands with supersonic velocity, dense neutral material accumulates between the ionization front and the shock front which precedes it on the neutral side; this decelerating shocked layer may become unstable and fragment on various time scales to form stars. This is the ‘collect and collapse’ model, first proposed by Elmegreen & Lada (1977), in which:
-
•
The layer may be unstable on a short time scale, of the order of the internal crossing time. The resulting stars are not massive, and should be observed, later on, moving ahead of the swept-up layer.
-
•
The layer may also be unstable, on a longer time scale, to gravitational collapse along its length. The fragments are massive enough to form massive stars or clusters (Whitworth et al. 1994), which should be observed in the direction of the parental layer.
It has been shown that, statistically, the more luminous protostellar objects tend to form in molecular clouds adjacent to H ii regions (Dobashi et al. 2001), hence the search we are carrying out for deeply embedded massive stars and clusters at the peripheries of H ii regions. We present here the case of the H ii region Sh 104 (Sharpless 1959). An ultracompact (UC) H ii region, ionized by a deeply embedded cluster, lies at its periphery. This cluster is possibly a second-generation cluster, whose formation has been triggered by the expansion of Sh 104. We present new molecular observations of this region, and discuss the possible origin of the observed massive-star formation.
The molecular observations and the photometry of the cluster will be fully presented and discussed in a forthcoming paper, hereafter Paper II, and a model for the star formation triggered by Sh 104 will be presented in Paper III.
2 Presentation of the region
Sh 104 is a 7′ diameter, optically visible H ii region, whose main exciting star is an O6V with a visual extinction of 4.7 mag (Crampton et al. 1978, Lahulla 1985). The LSR velocity of the ionized gas is 0 km s-1 (Georgelin et al. 1973). The distance to Sh 104 is kpc (see Paper II).
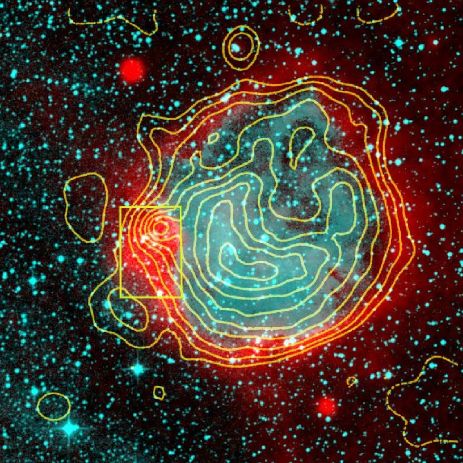
Sh 104 is a thermal radio continuum source (Israel 1977). Fig. 1 shows the radio map obtained by Fich (1993) at 1.46 GHz, with a resolution of 40′′. Sh 104 exhibits a shell morphology, both at optical and radio wavelengths, with the exciting star at the centre of the shell. Sh 104 is a low density H ii region. For the assumed distance, the mass of ionized hydrogen is (Israel 1977). A non-resolved thermal radio source lies at its eastern border, at , (J2000), according to the NVSS Source Catalog (Condon et al. 1998). This UC H ii region coincides with the IRAS20160+3636 source discussed below.
The Sh 104 region appears as a most remarkable object in band A of the MSX Survey (Egan et al. 1999). This band covers the 6.8–10.8 m range with an angular resolution of . Fig. 1 shows a complete emission ring surrounding the ionized region. Band A contains the 7.7m and 8.6m emission bands, often attributed to polycyclic aromatic hydrocarbons (PAHs). This is most probably the origin of the band A emission ring surrounding the Sh 104 ionized region. Continuum emission due to small grains at high temperature may also contribute to the band A emission.
An MSX point source lies in the direction of the dust ring. It is resolved, with a HPBW (corrected for the instrumental PSF) of 21′′(0.41 pc). This MSX point source coincides with the IRAS point source IRAS20160+3636 (). A near-IR cluster lies in the direction of this source. This cluster is most probably the exciting cluster of the UC H ii region, and therefore contains at least one massive star (see Paper II). We obtained images of this cluster at the CFHT 3.6-m telescope in October 2002.
3 Molecular observations and results
The molecular material associated with Sh 104 was observed with the IRAM 30-m telescope in September 2002. The 12CO(2-1) line emission was mapped at 11′′ resolution with the HERA 9-channel heterodyne array in the ‘on-the-fly’ mode. We adopted a reference position located east of the exciting star. The emission at this position was observed in frequency switching mode and subsequently added to the observed spectra. The final map has a size of and is almost fully sampled. CO fluxes are given in units of antenna temperature scale). The emission of the other tracers being limited to the denser regions, and with a much smaller extent, we adopt the main-beam scale for brightness temperatures.
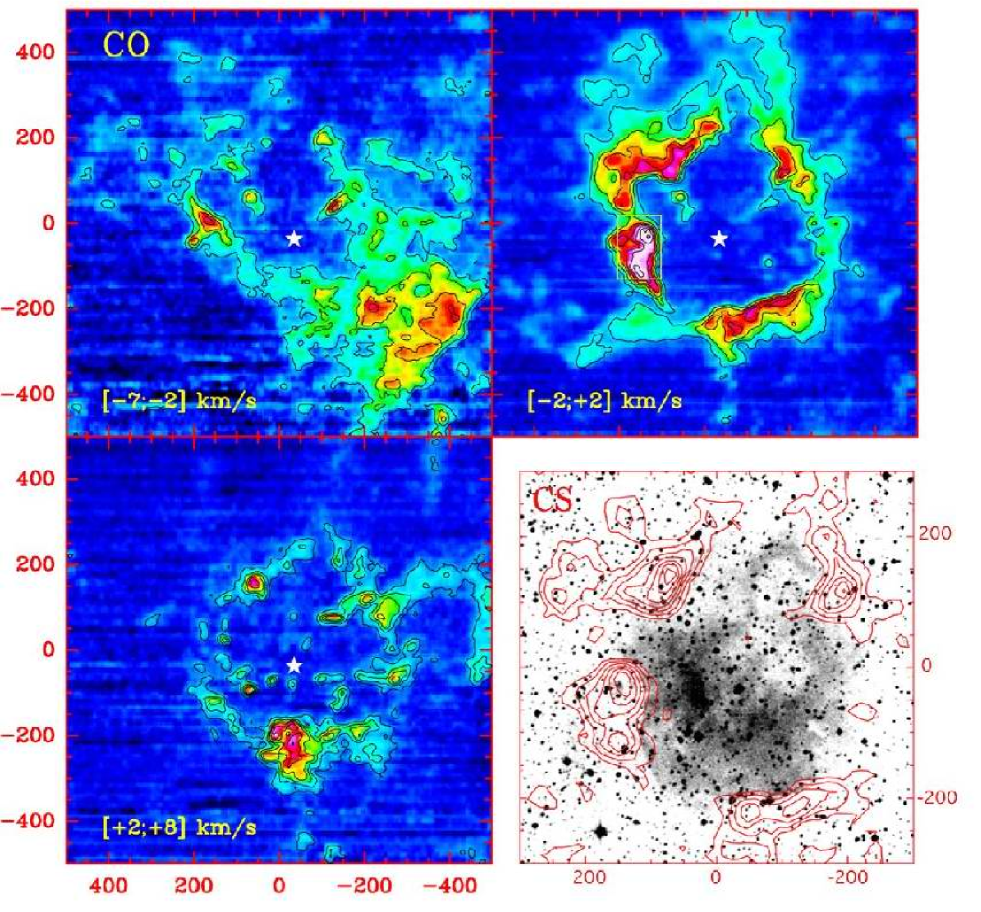
Figure 2 presents the CO emission integrated over three velocity intervals. It shows that the CO material forms a ring which entirely surrounds the H ii region. The CO brightness is highest at the border of the ionized region, and lies in the range 17–27 K.
The emission of the denser material was observed using the standard heterodyne receivers in the lines of CS, HCO+, 13CO and C18O. Fig. 2 shows that the dense gas is mainly concentrated in four large fragments, separated from each other by 4.3 to 6.7 pc.
The brightest fragment is found in the direction of the cluster. Its dimensions are about 3.1 pc 1.5 pc (based on the contour at 20% of the peak C18O(1-0) intensity). From the CO data, we estimate a gas kinetic temperature of K in the fragment. The mass of molecular material inside the fragment is estimated by integrating the flux of the C18O(1-0) line; assuming that the levels are populated according to LTE and that the line is optically thin, we derive a mass of for the fragment and a mean density of .
Integrating the total flux of the 13CO(1-0) line over the whole shell, and assuming the line to be optically thin with an average excitation temperature of 20 K, the total mass of material amounts to .
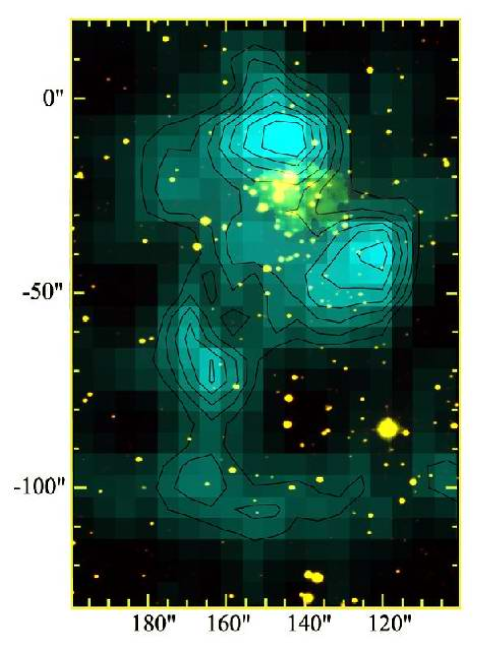
As can be seen in Fig. 2, each fragment consists of several roughly circular subunits, or ‘cores’, with a typical diameter of 0.4–0.6 pc (from CS(3-2)), marginally resolved at 2 mm (and 3 mm). Observations of the C18O(2-1) line show that the fragment associated with the IRAS source is composed of three cores separated by about 0.8 pc (Fig. 3). The stellar cluster lies between two of these cores (at about 10′′ from the centre of the north-eastern core). Their physical properties, as derived from the C18O observations, are very similar. The average gas column density is 3–3.5, which implies core masses of 70 to . From the C18O data, we find an average H2 density of inside the cores.
For the same cores, a large-velocity gradient analysis of three CS transitions shows that the density of the emitting gas is 1.6–2.8 and the average column density . Adopting a standard abundance [CS]/[H2], we derive a mass of .
4 Discussion and conclusions
The existence of a molecular ring surrounding the ionized gas, and the presence, around this ring, of four dense fragments regularly spaced, provide strong evidence in favour of the ‘collect and collapse’ model. This configuration allows us to reject the following hypotheses concerning the formation of the cluster: i) spontaneous collapse of a pre-existing molecular clump; ii) collision of the compressed layer with a pre-existing molecular clump; and iii) collapse of a molecular postshock core formed in the compressed layer propagating in a supersonic turbulent medium (Elmegreen et al. 1995) – in which case the fragments would be randomly located. The cluster is most probably a second-generation cluster, resulting from the fragmentation of the swept-up layer due to gravitational instabilities developing on the long time scale, 1–3 years for an H ii region expanding in a medium of density to cm-3, respectively. The fact that the cluster is still observed in the direction of the compressed layer reinforces this interpretation.
Whitworth et al. (1994) have estimated the characteristics of the fragments formed by gravitational instability in the dense shell swept up when an H ii region expands into an infinite, uniform, neutral medium. The fragment properties are insensitive to the rate at which ionizing photons are emitted by the central star; they depend primarily on the preshock density, , and – very strongly – on the effective sound speed in the postshock gas, . However, with this model, no pair of values of and can simultaneously reproduce the number of fragments observed in Sh 104 (four) and their individual masses (). We have therefore developed a new model for Sh 104.
In the new model, a massive star is formed near the centre of a molecular cloud of finite extent. The H ii region, which the massive star excites, expands and sweeps up the cloud into a dense shell, which then fragments. The model takes account of the self-gravity of the swept-up shell, and also the inertial drag of the material being swept up by the expanding shell. By invoking a cloud which is slightly aspherical, in the sense of being slightly more extended in the plane of the sky than along the line of sight, we can explain why all four fragments are seen – in projection – around the rim of the H ii region. The model will be described in detail in Paper III.
The mean density of the fragments observed around Sh 104 is high, 3100 cm-3; for 30 K, their Jeans length is 0.65 pc. Thus this structure itself must fragment into several cores separated by some 0.65 pc. Such dense cores are observed in the fragment associated with the cluster. Due to their high density, star formation must proceed rapidly in these dense cores (7104 years for the observed density of 2105 cm-3). This is most probably the origin of the observed embedded cluster. The other three fragments observed at the periphery of Sh 104 are potential sites of massive-star formation.
The Sh 104 region appears as the prototype of massive-star formation triggered by the expansion of an H ii region. Thanks to its very simple morphology, Sh 104 is particularly helpful for understanding this sequential star formation mechanism.
Acknowledgements.
We would like to thank the IRAM 30-m Observatory Staff for their support during the observations, and our anonynous referee for his suggestions concerning the figures. This work has made use of the Simbad astronomical database operated at CDS, Strasbourg, France. It has used the NASA/IPAC Infrared Science Archive, which is operated by the Jet Propulsion Laboratory, California Institute of Technology, under contract with the National Aeronautics and Space Administration.References
- (1) Condon, J. J., Cotton, W. D., Greisen, E. W., Yin, Q. F., Perley, R. A., Taylor, G. B., Broderick, J. J. 1998, AJ, 115, 1693
- (2) Crampton, D., Georgelin, Y. M., Georgelin, Y. P. 1978, A&A, 66, 1
- (3) Dobashi, K., Yonekura, Y., Matsumoto, T., Momose, M., Sato, F., Bernard, J.-P., Ogawa, H. 2001, PASJ, 53, 85
- (4) Egan, M. P., Price, S. D., Moshir, M. M., et al. 1999, The Midcourse Space Experiment Point Source Catalog Version 1.2, Explanatory Guide, AFRL-VS-TR-1999-1522, Air Force Research Laboratory
- (5) Elmegreen, B. G., Lada, C. J. 1977, ApJ, 214, 725
- (6) Elmegreen, B. G., Kimura, T., Tosa, M. 1995, ApJ, 451, 675
- (7) Elmegreen, B. G. 1998, in ASP Conf. Ser., 148, 150 ed. C. E. Woodward, J. M. Shull & H. A. Tronson
- (8) Fich, M. 1993, ApJS, 86, 475
- (9) Georgelin, Y. M., Georgelin, Y. P., Roux, S. 1973, A&A, 25, 327
- (10) Israel, F. P. 1977, A&A, 60, 233
- (11) Lahulla, J. F. 1985, A&ASS, 61, 537
- (12) Sharpless, S. 1959, ApJS, 4, 257
- (13) Whitworth, A. P., Bhattal, A. S., Chapman, S. J., Disney, M. J., Turner, J. A. 1994, MNRAS, 268, 291
- (14)