Kinematically quiet halos around 2.5 radio galaxies. Keck spectroscopy††thanks: Based on: a) observations made at the W.M. Keck Observatory which is operated as a scientific partnership among the California Institute of Technology, the University of California and the National Aeronautics and Space Administration (NASA). The observatory was made possible by the generous financial support of the W.M. Keck Foundation b) observations with VLT Antu unit at the European Southern Observatory, Paranal, Chile c) observations with the NASA/ESA Hubble Space Telescope, obtained at the Space Telescope Science Institute, which is operated by the association of Universities for Research in Astronomy d) observations made with the NRAO Very Large Array. The National Radio Astronomy Observatory is a facility of the National Science Foundation operated under cooperative agreement by Associated Universities Inc.
Abstract
We present the results of the kinematic study of the extended gas in a sample of 10 high redshift radio galaxies (2.5) based on high signal to noise Keck II and VLT long slit spectroscopy. In addition to the typical high surface brightness kinematically perturbed regions (FWHM and velocity shifts 1000 km s-1), we find in all objects giant low surface brightness halos which show quieter kinematics with typical emission line FWHM and velocity shifts of several hundred km s-1.
The giant halos often extend for more than 100 kpc and sometimes beyond the radio structures. They emit lines other than Ly (CIV, HeII and NV in some cases), typically found in the spectra of high redshift active galaxies. Continuum is also often detected. The halos are enriched with heavy elements at tens of kpc from the active nucleus. Typical Ly luminosities and surface brightness (within the slit) are in the range 1043-44 erg s-1 and several 10 erg cm-2 s-1 arcsec-2 respectively. Estimated densities are in the range 17-150 cm-3. The quasar continuum is the dominant source of ionization of the quiescent halos along the radio axis. The implied total quasar ionizing luminosities are in the range several 1045-1047 erg s-1, in the same range as radio loud quasars at comparable redshift.
The detection of giant quiescent halos in all objects suggests that they could be a common ingredient of high redshift radio galaxies. The radio galaxies seem to be embedded within the halos. The nature, origin of the halos and the cosmological implications are also discussed.
keywords:
galaxies: formation – galaxies: active – cosmology: early Universe1 Introduction
Our current belief is that the hosts of powerful radio sources in the distant Universe are destined to become the giant ellipticals of today, the most massive galaxies we know (e.g. Lilly & Longair 1984, McLure et al. 1999). They inhabit rich environments that are believed to be galaxy clusters in the process of formation (e.g. Pentericci et al. 2000, Venemans et al. 2002). While some distant powerful radio sources may have commenced their formation at very high redshift, the process of assembly is very active at 2-3. This corresponds to the epoch when luminous quasars appear to have had their maximum space density and the star formation rate of the Universe was two orders of magnitude higher than at present (e.g. Pei 1995, Shaver et al. 1996, Fan 2001).
Our group has recently proved that solar or supersolar metallicities are common in the extended gas (tens of kpc) of radio galaxies at 2.5 (Vernet et al. 2001, Villar-Martín et al. 2001). The relatively high metallicities imply that star formation in these objects has been rapid and intense, enabling a fast chemical enrichment of the gas. Since stellar population analysis of giant ellipticals at low redshift indicates that most stars have been formed during a brief epoch with high star formation rate, this further supports the idea that powerful high redshift radio galaxies are progenitors of the giant ellipticals of today. Star formation is also suggested by the detection at submm wavelengths of some high redshift radio galaxies (e.g. Archibald et al. 2001, Reuland et al. 2003a). Although the nature of the heating mechanism is controversial, some authors have argued that the dust is heated by starbursts, rather than the hidden quasar nuclei (e.g. Tadhunter et al. 2002). By looking at high redshift radio galaxies (2-3, hereafter HzRG) we are therefore likely to be witnessing the formation process of giant elliptical galaxies.
HzRG are surrounded by giant nebulae which often extend for more than one hundred kpc (e.g. McCarthy et al. 1990a, Reuland et al. 2003b) and sometimes beyond the radio structures (e.g. Eales et al. 1993, Kurk et al. 2001, Maxfield et al. 2002). One of the great difficulties in the interpretation of the optical and near infrared data of HzRG is due to the fact that the observed morphological, kinematic and ionization properties are strongly influenced by the nuclear activity and the extreme phenomena associated with the relativistic jets. Most morphological and kinematic studies of HzRG have been focussed on the high surface brightness regions. These are clumpy, irregular (with features such as filaments, plumes, ionization cones, e.g. Reuland et al. 2003b) and often aligned with the radio axis (Chambers, Miley & van Breugel 1987, McCarthy et al. 1987). They are characterized by extreme kinematics, with measured FWHM and velocity shifts 1000 km s-1 (e.g. McCarthy, Baum & Spinrad 1996, Villar-Martín, Binette & Fosbury 1999), compared to values of a few hundred in low redshift radio galaxies (e.g. Tadhunter, Fosbury & Quinn 1989, Baum, Heckman & van Breugel 1990). It is likely that a perturbing mechanism such as shocks induced during jet/gas interactions [van Ojik et al. 1997] is responsible for such extreme kinematics.
However, there is evidence in two HzRG for giant (distance to the nucleus 50 kpc111We assume =0.7, =0.3, H0=65 km s-1 Mpc-1) low surface brightness halos (LSBHs hereafter) of ionized gas with quiet kinematics: 1243+036 at 3.6 (van Ojik et al. 1996, vO96 hereafter) and 0828+193 at 2.6 (Villar-Martín et al. 2002, VM02 hereafter).
These quiescent halos might be residual gas from which the galaxy started to form (VM02). They offer opportunities to study the ionizing photon luminosity of the quasar and with sufficient line measurements the chemical composition of the halo gas. If the gas kinematics is gravitational in origin the halos can be used as mass tracers of radio galaxies at different redshifts. They would provide critical information to constrain models of galaxy formation and evolution. Also, the metallicities of the giant halos will set tight constraints on their chemical enrichment history and, ultimately, on the formation process of the galaxy.
We present in this paper the results of a research project whose goal is to search for kinematically unperturbed halos in HzRG and study their kinematic and ionization properties. An important advantage of the current set of data is that we can use HeII (and CIV in some cases) to constrain the kinematic properties of the gas, rather than using only Ly, which is very sensitive to dust/gas absorption.
The paper is organized as follows: The observations and data analysis are described in §2. General results and results on individual objects are presented in §3. The ionizing mechanism, kinematic patterns, nature of the giant quiescent halos and cosmological implications are discussed in §4. The summary and conclusions are presented in §5.
2 Observations and Data Analysis
2.1 The data
All the sources were selected from the ultra-steep spectrum (USS) radio galaxy survey (see e.g. Röttgering et al. 1994) with redshift 2.2.
The spectra for all the objects (see Table 1) except 2104-242 were obtained with the Low Resolution Imaging Spectrometer (LRIS, Oke et al. 1995) with its polarimeter (Goodrich, Cohen, Putney 1995) at the Keck II 10 m telescope from July 1997 till July 1999 under subarcsec seeing conditions (seeing varying between 0.7 and 1.1 arcsec). The observing log is presented in Vernet et al. (2001).
The LRIS detector is a TEK 20482 CCD with 24 m pixels giving a scale of 0.214 arcsec pixel-1. We used a 300 line mm-1 grating which provides a dispersion of 2.4 Å pixel-1 and a spectral range 3900–9000 Å. The slit width was always 1 arcsec, except for 4C-00.54 and 4C+23.56 for which we used a 1.5 arcsec slit. The slit was always oriented along the radio axis given by Röttgering et al. 1994 and Carilli et al. 1997 (see Table 1).
Each individual frame was calibrated in wavelength and corrected for slit curvature using arc spectra. This initial wavelength calibration was refined using strong sky lines. The FWHM of the instrumental profile (IP, Table 1) was determined from unblended sky lines. These values correspond to a range in resolution of 320–610 km s-1 at the redshifted HeII1640 wavelength. Variations from object to object are probably due to mechanical instabilities within the instrument causing variation on the line spread function.
In order to compensate for the effects of flexure in the instrument, we extracted from every frame a section around Ly and NV1240 and one around CIV1550 and HeII1640. The individual sub-frames corresponding to the same spectral range were spatially aligned (using the continuum centroid) and combined. The two final frames (one for Ly and NV and another one for CIV and HeII) were also spatially aligned, assuming that the continuum centroid has the same spatial position at all wavelengths. This is reasonable in this small spectral range, taking also into account that the spatial resolution element has a large physical size ( 8-9 kpc). For a more detailed description of the observations and data reduction see Vernet et al. (2001).
The observations for 2104-242 were carried out in service mode on 1999 September 2-5 with FORS1 on the 8.2 m VLT Antu telescope (ESO-Chile). The 600B grism was used with a 1 arcsec wide slit. The slit was positioned along the brightest components and the filamentary structure at a position angle of 2 north through east. The exposure time was 10800 sec. The seeing during the observations was 1 arcsec and conditions were photometric. A 2 2 readout binning was used in order to increase the signal-to-noise ratio (S/N). The resultant spectral resolution was 6 Å (FWHM) and the spatial scale was 0.4 arcsec pixel-1. For a detailed description of the data reduction see Overzier et al. (2001).
Radio maps, optical and near infrared HST archive images were also used and registered with the Keck 2D spectra for comparison between the structures observed at different wavelengths. The radio observations and data are described by Carilli et al. (1997) and the HST WFPC2 and NICMOS images are described in Pentericci et al. (1999 and 2001) respectively.
| IAU | 4C | Redshift | Exp. | PA | IP | HST |
|---|---|---|---|---|---|---|
| sec | Å | images | ||||
| 1809+407 | 4C+40.36 | 2.265 | 10742 | 82 | 9.81.2 | No |
| 0211-122 | 2.340 | 28580 | 104 | 9.51.2 | WFPC2/NICMOS | |
| 1931+480 | 4C+48.48 | 2.343 | 12000 | 50 | 11.21.2 | No |
| 1410-001 | 4C-00.54 | 2.360 | 16240 | 134 | 14.31.2 | WFPC2/NICMOS |
| 0731+438 | 4C+43.15 | 2.429 | 22720 | 12 | 10.51.2 | No |
| 2105+236 | 4C+23.56 | 2.479 | 22266 | 47 | 13.61.2 | WFPC2 |
| 2104-242 | 2.491 | 10800 | 2 | 6.00.5 | WFPC2/NICMOS | |
| 1558-003 | 2.527 | 11400 | 72 | 11.01.2 | No | |
| 0828+193 | 2.572 | 18000 | 44 | 10.51.2 | WFPC2/NICMOS | |
| 0943-242 | 2.922 | 13800 | 73 | 10.81.2 | WFPC2 |
2.2 Registration
Several methods of registration between the radio maps and the 2D spectra were used, depending on the availability of HST images and on the presence of a radio core.
For objects presenting a radio core and for which we have both WFPC2 and NICMOS images (0211-122, 0828+193, 1410-001 and 2104-242), the IR peak was assumed to coincide with the radio core. The WFPC2 image was then registered with the NICMOS image using field stars. Finally the 2D spectrum continuum centroid was aligned with the WFPC2 image peak. The total uncertainty with this method is 0.3 arcsec. The error might be larger: since the AGN is expected to be obscured, the near infrared peak probably does not mark its position and therefore, it might be spatially shifted relative to the radio core.
2105+236 is the only object presenting a radio core for which we only have a WFPC2 image. The obvious thing to do would have been to align the radio core with the peak of the WFPC2 image. However, the available astrometry places the radio core on top of a secondary peak of the WFPC2 image, close to the Ly emission vertex in Chambers et al. [Chambers et al. 1996] ground-based narrow band image. We used this registration point instead.
Three objects (0731+438, 1558-003 and 1931+480) have a radio core but HST images are not available. We simply aligned the radio core with the peak of the continuum in our 2D spectra. The total uncertainty with this method is 0.2 arcsec. As above, this error is likely to be larger since the continuum centroid might not mark the position of the active nucleus. (Notice that for 1931+480 we have used a different radio core identification than Chambers et al. 1996).
Two objects do not have a radio core. For 1809+407 the radio map and optical spectrum were aligned using the astrometry from Chambers et al. [Chambers et al. 1996]. We assumed that the optical continuum centroid in the Keck spectrum coincides with the optical identification by Chambers et al. The uncertainty of this method is 0.5 arcsec. For 0943-242, we determined the astrometry of field stars in the WFPC2 image using the GSC2.2 catalogue (accuracy of 0.2-0.3 arcsec) and then aligned it with the radio map. The continuum centroid in the 2D spectrum was then aligned with the peak of the image. The uncertainty of this method is 0.4-0.5 arcsec.
2.3 Data analysis method
The 2D spectra were divided into several apertures along the spatial direction and a spectrum was extracted for each one. The apertures were selected so that the gas has similar kinematic properties across the spatial extent of a given aperture and to obtain enough S/N ratio in Ly, CIV and HeII (if possible) to fit the line profiles. Separate apertures were defined for the gas beyond the radio structures when detected.
The Ly and HeII spectral profiles were analysed and fitted in each aperture with one or more Gaussians depending on the quality of the fit. For each kinematic component the FWHM (corrected for instrumental broadening in quadrature) and the velocity shift relative to the HeII line at the continuum centroid were calculated. HeII has been the most important line in our study because it is a strong single (rather than a doublet) non resonant line. Ly, in spite of its strong sensitivity to absorption by gas and dust has also often provided very valuable kinematic information. CIV is difficult to constrain due to the presence of the doublet components. Results for this line are only shown when they provide convincing evidence for the presence of low velocity gas, a signature of the quiescent halos.
Sometimes different fits produced results of similar quality. In most cases it was possible to discriminate by comparing with the results from (a) adjacent apertures (b) another emission line detected in the same aperture. As an example, it was sometimes found that for a given spectrum one Gaussian component produced as good a fit to the HeII profile as two Gaussians components. The profile of Ly in the same aperture and the fits to the HeII lines in the adjacent apertures provided further constraints that suggested the use of either one or two components. When such discrimination was difficult, no spectral decomposition was attempted.
Any fit which produced lines with observed FWHMobs such that
FWHMobs IP - IP - FWHM
was rejected, where IP is the uncertainty on the FWHM of the IP and FWHMobs is the error on FWHMobs. A kinematic component was considered to be unresolved when FWHMobs was in the range
IP - IP - FWHM FWHMobs IP + IP + FWHM.
In such cases an upper limit for the intrinsic FWHM was set by estimating the intrinsic FWHMint for which FWHMobs = IP + IP + FWHM.
The formal uncertainty in the central wavelength of an emission line is a combination of systematic uncertainties in the wavelength calibration (estimated to be 1 Å), the signal to noise ratio of the line and the errors on the Gaussian fits. The formal uncertainty in the deconvolved width (FWHMint) is a combination of uncertainties in the resolution, the signal to noise ratio of the line and the errors on the multiple Gaussian fits.
The real errors are likely to be larger because the seeing disk might have been smaller than the slit width. Although we are confident that the seeing was always 0.7 arcsec, the assumption that the objects filled the slit introduces additional uncertainties which will be discussed in §3.2. Our conclusions are not seriously affected by this assumption.
3 Results
| Name | FWHM | Detected | ||||||
|---|---|---|---|---|---|---|---|---|
| 10-17 | 1043 | Lines | ||||||
| kpc | kpc | km s-1 | km s-1 | erg s-1 cm-2 arcsec | erg s-1 | |||
| 1809+407 | 27 | 40 | 500-700 | 400 | 2.0 | 1.6 | Ly, NV (?), CIV, HeII | |
| 0211-122 | 62 | 61 | 400-700 | 200 | 1.6 | 1.4 | Ly, NV, CIV, HeII | |
| 1931+480 | 110 | 53 | 450-720 | 450 | 7.1 | 24.7 | Ly, CIV, HeII | |
| 1410-001 | 113 | 62 | 472-800 | 500 | 2.2 | 10.5 | Ly, CIV, HeII | |
| 0731+438 | 42 | 35 | 600 | 100 | 48.9 | 11.6 | Ly, CIV, HeII | |
| 2105+236 | 170 | 61 | 500-650 | 570 | 13.6 | 7.4 | Ly, HeII | |
| 2104-242 | 135 | 65 | 265 | 250 | 2.5 | 0.9 | Ly, HeII(?) | |
| 1558-003 | 61 | 69 | 550-850 | 550 | 2.3 | 13.4 | Ly, CIV, HeII | |
| 0828+193 | 64 | 69 | 300 | 600 | 2.4 | 10.2 | Ly, CIV, HeII | |
| 0943-242 | 17 | 59 | 400-600 | 450 | 1.3 | 1.2 | Ly, NV, CIV, HeII | |
| 1243+036 | 31 | 78 | 250 | 450 | 3.0 | Ly (at least) |
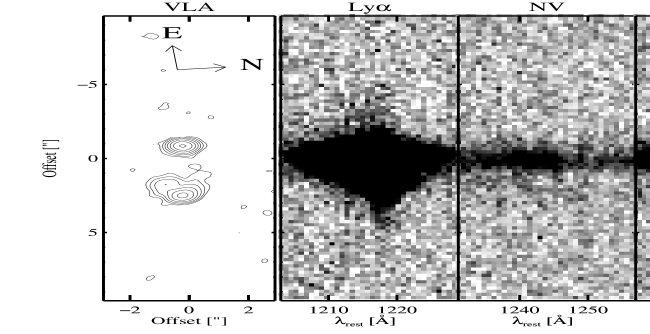
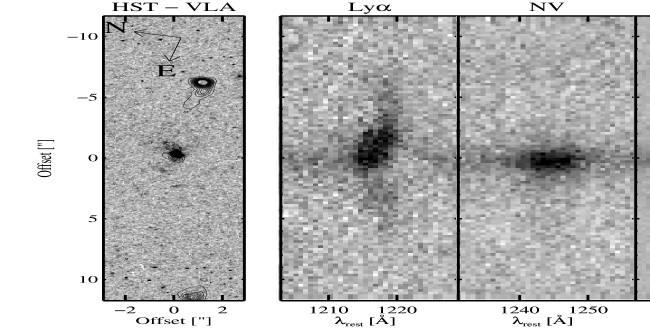
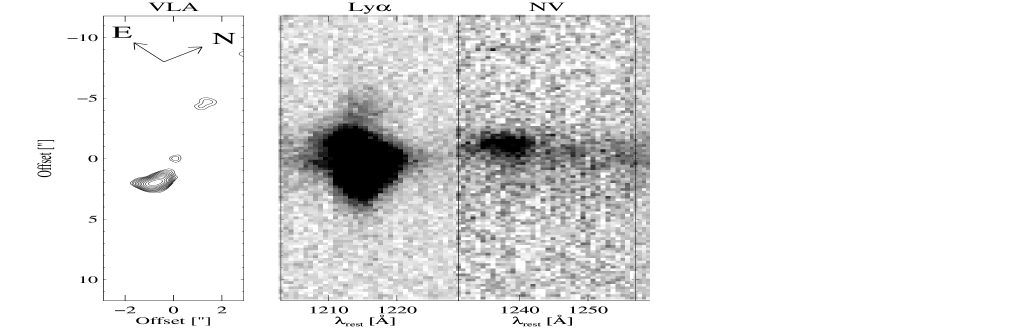
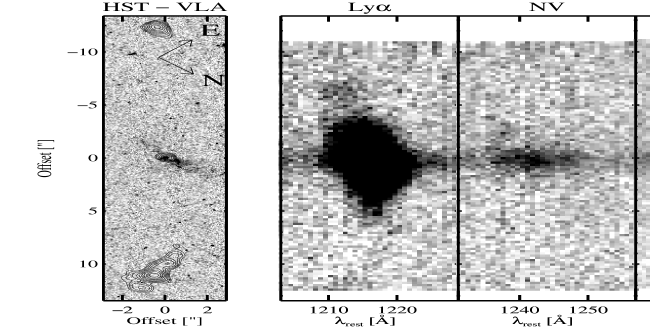
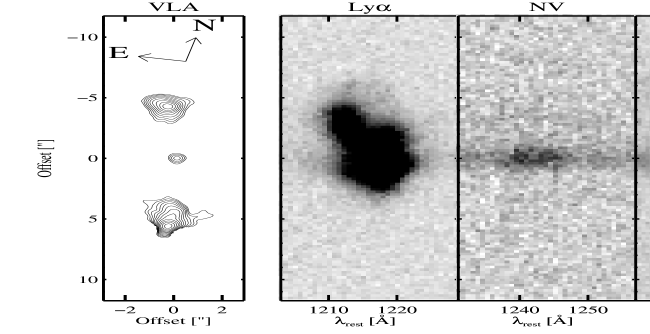
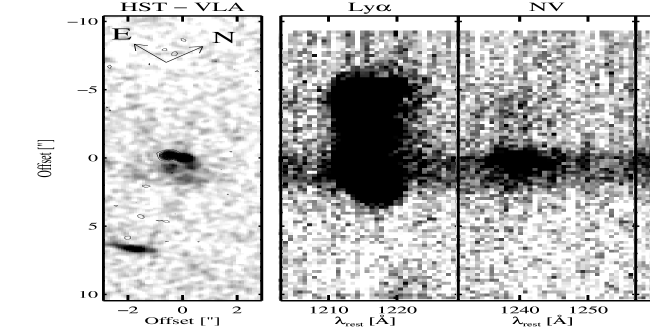
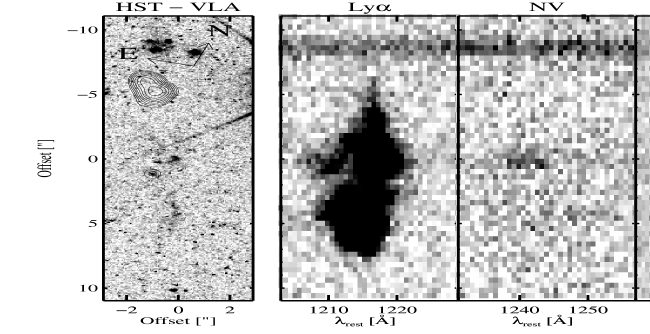
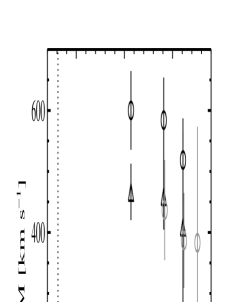
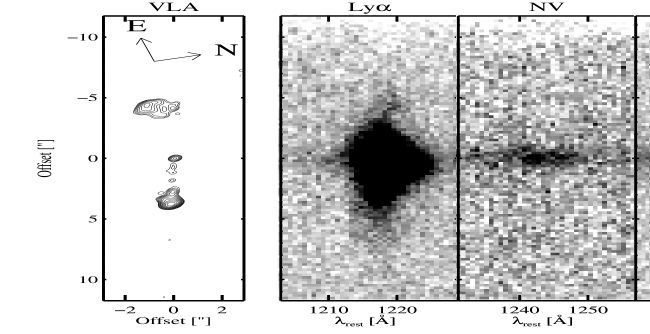
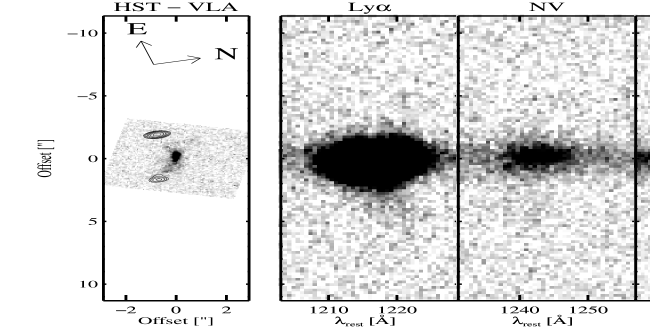
Figures 1 to 9 show the data and results of the kinematic study. Each figure corresponds to one radio galaxy and consists of 3 panels: the top panel shows the overlay of the radio map and the WFPC2 image (when available) spatially aligned with the 2D Ly, NV, CIV and HeII spectra. The apertures selected for the kinematic analysis are indicated. The bottom left panel shows the 1D spectra extracted from the selected apertures and the bottom right panel shows the spatial variation of the kinematic properties (velocity shift and FWHM) of the different components revealed by the spectral fits. When two kinematic components were isolated, these are distinguished with open (narrow components) and solid symbols (broad components). Circles are used for Ly, triangles for HeII and squares for CIV. The dashed vertical lines indicate the maximum extent of the radio structures.
The main results of the kinematics analysis are:
1) All 10 HzRG (including 0828+193, VM02) are associated with giant halos of quiescent gas with FWHM(HeII)850 km s-1 and velocity shifts across the nebulae 600 km s-1.
2) In addition, 8 out of 10 objects contain kinematically perturbed gas. 7 of these objects show a broad component with FWHM1500 km s-1 and high surface brightness. 2104-242 (which was observed at higher resolution) shows signs of kinematic perturbance in the form of split narrow components. The perturbed gas is usually located inside the radio structures.
We show in Table 2 some properties of the quiescent LSBHs. We have included 0828+193 (VM02) and 1243+036 (vO96) for comparison. is the maximum extension measured from the position of the continuum centroid using Ly (the brightest line). Halo sizes are in the range 35-80 kpc222In the Cosmology we have adopted, 78 kpc for the halo detected by vO96 in 1243+036. and they extend sometimes beyond the radio structures (it is possible that radio maps with greater sensitivity might show that the radio plasma extends further out). The giant halos emit lines other than Ly (CIV, HeII and NV in some cases), typically found in high redshift active galaxies. The emission line spectra are typical of active galaxies. Continuum is also often detected. In most cases the quiescent gas is found not only in the outer parts of the objects but across the high surface brightness regions as well.
The kinematic parameters FWHM (maximum and minimum values across the halo) and (maximum velocity shift measured across the halo) in Table 2 refer to HeII, which is a more reliable kinematic tracer than Ly. Ly was used only for 2142-242, since this was the only line detected from the quiescent halo (§3.1.7).
The Ly emission of the quiescent halos is clearly detected in the outer regions of all objects except 0731+193 and 2105+236 (see top panels Fig. 1-9). The surface brightness values presented in Table 2 were measured using these regions. It is important to note that the surface brightness varies spatially and it is often higher in the inner apertures. For 0731+193 and 2105+236 the surface brightness was estimated using the flux of the narrow component isolated with the kinematic analysis and the area of the apertures where this component was detected (see§3.1.5).
The Ly luminosities were calculated integrating the line flux from the quiescent gas across all the apertures where this was isolated. For 0943-242 it was not possible to isolate a narrow component using Ly on the high surface brightness regions (see §3.1). In this case we show the luminosity of the HeII narrow line.
3.1 Notes on individual objects
3.1.1 1809+407
Narrow band H+[NII] imaging obtained by Egami et al. [Egami et al. 2003] using NICMOS on HST shows that the emission line nebulosity is misaligned from the radio axis. Our 2D Ly Keck spectrum (Fig. 1) shows that in addition to the high surface brightness regions, a LSBH with apparently quieter kinematics (narrower Ly) is detected extending 9 arcsec (80 kpc) and beyond the radio structures.
Spectra were extracted from 5 apertures (Fig. 1). The fits to HeII reveal the presence of a narrow component with FWHM in the range 500-700 km s-1 and maximum velocity shift across the nebula of 400 km s-1. These results are consistent within the errors with those obtained using Ly. Our results are in very good agreement with Egami et al. [Egami et al. 2003]. These authors found that the integrated near infrared (optical rest frame) emission lines can be characterized by two components of FWHM560 km s-1 and 1670 km s-1 respectively and shifted by -470 km s-1.
3.1.2 0211-122
The 2D line spectra (Fig. 2, top) show evidence for a low surface brightness halo which extends in Ly for 13 arcsec or 114 kpc. The apparent kinematics of the LSBH seems rather uniform across its entire extension and quieter than in the high surface brightness regions.
Spectra were extracted from six apertures (Fig. 2). Both CIV and HeII (except aperture 3, see below) are very well fitted with single Gaussian profiles. This is not always the case for Ly, which is heavily absorbed in some positions [van Ojik et al. 1994] and therefore not a reliable kinematic tracer in this object. The fits to the line profiles confirm that the kinematics is quieter in the outer parts of the object. Both HeII and CIV are unresolved (FWHM400 km s-1) and the velocity shift ( 100 km s-1) between these two lines is small.
Ly is broad (FWHM1000-1200 km s-1) in the inner apertures (ap. 3 and 5). 333Van Ojik measured FWHM(Ly) 1700 km s-1 in the central 2 arcsec. The authors worked at 24 Å spectral resolution.. Similar highly perturbed kinematics is not apparent in HeII, which shows FWHM700 km s-1. The CIV (1548,1551) profile is also consistent with two components of FWHM700 km s-1 and this is also the case for the NV ( 1239,1243) doublet (ap. 4) when broad underlying wings are taken into account. We therefore conclude that the gas in the inner apertures emits lines with FWHM700 km s-1, except for Ly. The maximum velocity shift for the HeII line across the entire object is 200 km s-1.
It is interesting to note that NV is very strong relative to HeII and CIV at a large distance (45 kpc) from the nuclear region (see spectrum ap. 6, Fig. 2). This will have implications on the chemical abundances (see §4).
3.1.3 1931+480
The Ly image by Chambers et al. (1996) shows a centrally peaked nebula which extends for 10 arcsec aligned with the radio axis. The Keck spectrum (Fig. 3) shows that the Ly emission extends for 13.5 arcsec (118 kpc). The low surface brightness emission shows apparently narrower Ly in the outer regions of the object. Spectra were extracted from five apertures.
The fits to HeII reveal a narrow component in all apertures (2 to 5) with FWHM in the range 450-720 km s-1 and maximum 450 km s-1 across the object. The K+H image of these object shows four distinct clumps [Carson et al. 2001]. Near infrared KeckII spectroscopy of the individual clumps reveals that the FWHM of [OIII]5007 is 525, 390, 840 and 570 km s-1 for the individual clumps. These results are in good agreement with ours.
3.1.4 1410-001
There is a strong misalignment on this object between the radio axis and the optical structures as seen in the HST images (45 deg, Pentericci et al. 2001). The slit was located along the radio axis, therefore the regions within the slit lie far beyond the HST structures (except maybe in the inner 2-3 arcsec).
The 2D Ly spectrum shows low surface brightness emission in the outer parts of the object with apparently quieter kinematics (Fig. 4).
Spectra were extracted from seven apertures. Ly (ap. 7), HeII (ap. 5 and 6) and CIV (ap. 6) are very narrow (unresolved) in the outer parts of the object with FWHM(HeII)472 km s-1. HeII is broader (700-800 km s-1) in the inner apertures. The maximum velocity shift across the object is 500 km s-1. A narrower component is suggested by the very narrow peak found on top of the CIV and HeII profiles at some spatial positions.
3.1.5 0731+438
Narrow band H+[NII] images obtained with the Subaru telescope (Motohara et al. 2000) show diffuse line emission which extends out to 3.3 arcsec from the center. The morphology is aligned with the axis defined by the radio hot spots. The authors interpret the observed morphology as evidence for the ionization cones in this radio galaxy. The Keck spectrum (Fig. 5) shows that Ly extends for 11 arcsec (96 kpc).
Three apertures were selected for the kinematic study (Fig. 5). A narrow component with FWHM600 km s-1 and 100 km s-1 is detected in apertures 2 (Ly and HeII) and 3 (Ly, CIV and HeII). The emission from aperture 1 corresponds to a separate component clearly seen in the 2D spectra which emits broad lines (FWHM1000 km s-1). We have not considered this component as part of the quiescent LSBHs. The results obtained with the three emission lines are in good agreement.
3.1.6 2105+236
Ly narrow band imaging shows two opposing ionization cones with 90 opening angles (Knopp & Chambers 1997). This is one of the rare cases among high redshift radio galaxies with clear ionization cones. The 2D Keck spectrum (Fig. 6, top) shows emission from these two spatial components in all emission lines. Contrary to the rest of the objects in this sample, the 2D spectrum does not show clear evidence for a quiescent LSBH.
Spectra were extracted from six apertures (Fig 6). The fits both to Ly and HeII are rather complex in this object due to the presence of an underlying very broad component (probably scattered light, Vernet et al. 2001) detected across the whole extension of the SW component, which makes the setting of the continuum level uncertain. We have attempted to fit the main peak of the emission line as accurately as possible, rather than the broad underlying wings, which are difficult to reproduce. The errorbars in Fig. 6 (bottom right panels) account for the different possibilities considered as the continuum level for the fits. This uncertainty is large for the high velocity component, but it does not affect seriously the narrow component, at least in HeII.
HeII is narrow in all apertures (2 to 6) with FWHM500-650 km s-1 and the maximum velocity shift across the nebula is 570 km s-1. CIV is also narrow in ap. 5 with FWHM600 km s-1 and similar velocity shift.
The fit to Ly reveals the presence of a broad component (FWHM1800 km s-1) and a narrower component with FWHM500-1100 km s-1. Except in ap. 5, both the FWHM and velocity shift of this component are consistent within the errors with the HeII measurements.
3.1.7 2104-242
The 2D VLT spectra (Fig. 7) show emission from two spatial components that where described for the first time by McCarthy et al. [McCarthy et al. 1990b]. These two clumps are between and aligned with the radio lobes. The Ly emission extends for 15 arcsec (130 kpc), well beyond the structures seen in the Ly image (Pentericci et al. 1999). Very narrow Ly is detected towards the north-east.
Spectra were extracted from 6 apertures. The kinematic structure (see also Overzier et al. 2001) of this object is very complex, but recall that the spectrum has higher spectral resolution than for the rest of the sample. Two narrow (FWHM(HeII)200 and 400 km s-1 respectively) components are found in the southern clump, which is associated with the narrow filament more than 2 arcsec long detected in HST images (Pentericci et al. 1999).
An interesting feature is the very narrow Ly emission (FWHM265 km s-1) detected in the outer regions of the object (ap. 1 and 2). The fit to the Ly profile in ap. 6 reveals a similar component (similar FWHM and velocity shift) also in the outer regions of the object to the south. Absorption of Ly photons could be responsible for the narrowness of the line, but the similarity of the kinematic structure of all the lines shown by the 2D spectra and the large strength of Ly relative to other lines indicates that absorption is not important in this object.
It is uncertain whether the outer very narrow line LSBH is also detected across the high surface brightness regions. Our spectra do not reveal a component of similar FWHM and velocity shift but it might be concealed in the two components of the southern clump. Higher resolution (2.8 Å) spectroscopy reveals three components (rather than 2) with velocity shifts of 140, 670 and 1270 km s-1 respectively (Pentericci et al. 2001; the authors do not provide FWHM values). One of these three components might correspond to the outer LSBH. In Table 2, we have assumed that the quiescent LSBH is the very narrow line emitting gas in the outer parts of the object.
3.1.8 1558-003
Low surface brightness Ly emission is detected beyond the radio structures extending for 14 arcsec (120 kpc) with apparently narrower lines (Fig. 8, top). Spectra were extracted from 6 apertures. The fits reveal a narrow component with FWHM in the range 550-630 km s-1 in Ly (ap. 1), HeII (ap.2) and CIV (ap. 5). The maximum velocity shift for HeII across the nebula is 550 km s-1.
HeII is broader in the central regions (FWHM750-850 km s-1) but the presence of a narrow component is suggested by the very narrow peak found on top of the CIV and HeII profiles (ap. 4). Although the errors are large (40% for the FWHMobs of the narrow component) the spectral profile of HeII in ap. 3 and 4 is well reproduced by a narrow unresolved component with FWHM410 km s-1 and +230 and +340 km s-1 respectively, and a broad component of FWHM 1000 km s-1. (Because of the large errors, we have ignored the results of these fits in Table 2).
It is interesting to note that broad Ly (FWHM1200 km s-1) is found beyond the radio structures. This was also reported by Villar-Martín, Binette & Fosbury (1999).
3.1.9 0943-242
Clear evidence for a low surface brightness very extended halo with apparently quiet kinematics is found in the 2D spectrum of all (Ly, NV, CIV and HeII) lines (Fig. 9, top). This gas extends for 8 arcsec (67 kpc) from the continuum centroid, well beyond the radio structures.
Spectra were extracted from 5 apertures. The double peaked profile found in some of them is due to absorption (e.g. Röttgering et al. 1995). Since the effect is so dramatic on the profile of the line, we have focussed the kinematic analysis on the HeII line instead.
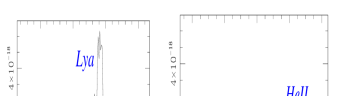
A narrow component of FWHM400-600 km s-1 is found in HeII in all apertures with maximum velocity shift 450 km s-1 across the nebula. The results for CIV are in very good agreement. An interesting feature is the strength of the NV line in the quiescent halo relative to other lines (Fig. 10).
3.2 Seeing disk and slit width: Uncertainties
So far we have assumed that the objects filled the slit. In some cases, the seeing disk was smaller than the slit width and our assumption introduces additional uncertainties. On one hand, if the objects are clumpy, the image of a spatially unresolved clump may be smaller than the slit width and the instrumental profile at that particular position is narrower than the profile measured with the sky or arc lines. This would lead to an underestimation of the intrinsic FWHM of the emission lines. On the other hand, it is possible that some clumps may be displaced in the dispersion direction relative to the center of the slit. The net effect will be errors in the velocity fields since these may partially reflect the distribution of the emitting gas within the slit.
We do not expect these uncertainties to affect the results on 0731+438, 0828+193, 1809+407, 1931+480 and 2104-242. For 0731+438, 0828+193 and 2104-242 we are confident that the seeing disk filled the slit. For 1809+407 and 1931+480, it is reassuring that our results are in good agreement with Egami et al. [Egami et al. 2003] and Carson et al. [Carson et al. 2001] respectively.
For the rest of the sample at least part ot the data where obtained with seeing size smaller than the slit width.
We have estimated the maximum uncertainties on both the FWHM and values assuming the worse case scenario, i.e., the best seeing measured during the observations for each object and a clumpy morphology. The uncertainties estimated in this way are therefore upper limits. The instrumental profile for a spatially unresolved source would be IP, where IP is measured using the sky lines (Table 1). The range of FWHM we obtain across the halos are: 550-790 km s-1 for 0211-122; 540-700 km s-1 for 0943-242; 710–960 km s-1 for 1410-001; 680-940 km s-1 for 1558-003; and 700-810 for 2105+236. It could also be that some of the emission lines which we have found to be unresolved turn out to be resolved.
We estimate that the maximum velocity shift (for HeII) which could be artificially introduced due to the spatial displacement between unresolved clumps in the direction perpendicular to the slit would be 310-365 km s-1 (depending on the object) for 0211-122, 0943-242 and 1558-003 and 600 km s-1 for 1410-001 and 2105+236.
Since all the estimations above have been done for the worse case scenario, we are confident that our main conclusion relative to the existence of quiescent gas in all objects are not affected. Our assumption that the objects filled the slit could have some non-negligible impact on some of the calculations in §4.4. This will be mentioned when appropriate.
4 Discussion
In this section we will investigate the origin of the velocity patterns, the ionizing mechanism, and the nature of the LSBHs as well as the cosmological implications of our results.
4.1 Nature of the kinematic components
There is evidence that the kinematic and ionization properties of high redshift radio galaxies can be determined in varying degrees by shocks driven during interactions between the radio structures and the ambient gas as well as photoionization by the central quasar (e.g. Best, Röttgering & Longair 2000). This is also the case of some intermediate redshift radio galaxies. As an example, Villar-Martín et al. [Villar-Martín et al. 1999] explained the kinematics and optical emission line spectrum of the radio galaxy PKS2250-41 (0.3) in terms of two kinematic components one of which is emission from kinematically perturbed shocked gas and the other is non perturbed gas photoionized by the continuum from the active nucleus or the continuum generated by the shocked hot gas.
We have found that all objects in our sample are associated with giant gaseous reservoirs with quiescent kinematics that sometimes extend beyond the radio structures. In addition, we have found highly perturbed gas in 8 out of 10 objects in the sample, usually located inside the radio structures. We propose that these are the emission from ambient non shocked gas and the emission from shocked gas respectively.
There are other examples in the literature that support our interpretation. Spectroscopic observations of 4C41.17 (3.8, van Breugel et al. 2001) and 1243+036 [van Ojik et al. 1996] show that the gas kinematics is highly perturbed inside the radio structures and along the radio axis. Beyond the radio hot spot the velocity shifts and FWHM of the lines decrease abruptly. See also Maxfield et al. [Maxfield et al. 2002].
The discovery of a quiescent reservoir of gas in all the objects in our sample suggests that it might be a common ingredient of high redshift radio galaxies.
4.2 Properties of the quiescent LSBHs
4.2.1 Sizes
Baum et al. (1988) and Baum & Heckman (1989) studied the emission line properties of a sample of 43 low redshift (0.6) powerful radio galaxies. In 85% of these sources the line emission was spatially resolved. They found that the median total extent of the emission line nebulae is 10 kpc, with only one object (3C227) with size (96 kpc) larger than the minimum total extension of the quiescent halos in our sample (60 kpc; the maximum total extension is 140 kpc). The LSBHs are giant structures.
There are a few examples in the literature of HzRG with Ly emission on the 100 kpc scale (McCarthy et al. 1990a, Francis et al. 2001, Pentericci et al. 1998, Reuland et al. 2003b). Our work shows that all the objects in our sample are associated with giant halos which extend far beyond the continuum structures revealed by the HST images and the high surface brightness emission line regions.
4.2.2 Luminosities
The H luminosities of the quiescent halos within the slit expected from the measured Ly luminosities (assuming case B recombination Ly/H=8.8) are in the range 0.1-2.81043 erg s-1 (these are lower limits because Ly absorption has been neglected). Baum & Heckman (1989) found that the median emission line luminosity in H+[NII] in their low redshift sample is 31041 erg s-1. Since the halos are likely to occupy a much larger spatial region outside the slit, it is clear that the total luminosities are probably much higher than line luminosities in low redshift radio galaxies.
We have estimated the total Ly luminosity expected from the halos, assuming that the gas is photoionized by the quasar continuum (see §4.3.1) We emphasize the approximate nature of these calculations due to the strong assumptions relative to the geometry of the ionized gas, the neglection of Ly absorption and the constant value of the Ly luminosity per unit volume across the halo. A biconical geometry with cone opening angle 90 is naturally expected in this scenario (Barthel 1989). We have assumed that the two cones have convex base and heights given by the extension of the LSBHs at both sides of the continuum centroid. The Ly luminosities (Table 2) and the volumes of the LSBHs within the slit and within the ionization cones were used to estimate an average luminosity per unit volume and the total luminosity expected from the two cones. We obtain in the range 7.71043 - 1.21045 erg s-1. For comparison, Reuland et al. (2003b) measured total Ly luminosities of the giant nebulae in 3 radio galaxies at 3.4-3.8 in the range 5.91044-1.41045 erg s-1. These values include the emission from the high surface brightness perturbed regions. This suggests that the quiescent gas emits a large fraction of the total line luminosity in HzRG.
The implied H luminosities are 8.71042-1.41044 erg s-1, i.e., about 100-1000 times higher than those of low redshift powerful radio galaxies (Baum et al. 1989).
4.2.3 Kinematics
The maximum velocity shift measured across the total extension of the quiescent halos in our sample is 600 km s-1 and the maximum FWHM, except for 1410-001 and 1558-003, is 700 km s-1 (Table 2). In those two radio galaxies, the maximum FWHM is 800-850 km s-1. It is important to note that spectral decomposition of HeII was not attempted in these two objects, but in both cases the presence of a narrower component is expected (see §3.1).
Baum et al. (1990) studied the kinematic properties of the extended gas in a sample of 19 low redshift powerful radio galaxies. Emission line FWHM and maximum velocity shifts across the extended nebulae are in general 500 km s-1. At low redshift, although rare, there are some objects where velocity shifts as high as 800 km s-1 have been measured and which present regular motions consistent with rotation (e.g. Tadhunter, Fosbury & Quinn 1989).
Although the lines in the HzRG halos are somewhat broader the FWHM values are not extreme and do not imply kinematic perturbation. FWHM larger than 600 km s-1 are very rare in the extended nebulae (Baum et al. 1990) of low redshift radio galaxies, but some examples with no signs of kinematic perturbation exist: for instance, PKS 1345+125, which was classified by Baum, Heckman & van Breugel (1992) as a ‘rotator’.
The broader lines in our sample might also be a consequence of the larger linear size covered by the apertures used in our kinematic analysis (10 kpc, compared with 1 kpc in Baum, Heckman & van Breugel (1990) study). Velocity shifts 200 km s-1 across less than 10 kpc are common in low redshift radio galaxy nebulae. Such shifts will broaden the line profiles when integrating over larger (linear scale) apertures. As a reference for comparison, the typical line-of-sight stellar velocity dispersion of a giant elliptical galaxy is 300 km s-1, corresponding to a characteristic line width (FWHM) of 700 km s-1 (e.g. Heckman et al. 1991a).
Therefore, the velocity shifts across the quiescent halos are consistent with measurements in low redshift radio galaxies. The lines are often somewhat broader, but the FWHM values are not extreme and consistent with quiet (non perturbed) kinematics.
4.2.4 Densities
Electron densities for the quiescent halos were estimated using the relation = 4 10 erg s-1, where is the filling factor, and the volume of ionized gas inside the slit (McCarthy et al. 1990a) The same geometry as in §4.2.2 was assumed: is the slice of the convex cones included in the slit. Large uncertainties affect the calculations due to the assumptions on the geometry, the neglection of Ly absorption effects, the uncertainty on the values and the assumption that the density is constant across the halo. values have been estimated to be 10-5 10-4 for typical emission line regions of HzRG [McCarthy 1993] 444 values in low redshift radio galaxies (where the density can be constrained using the [SII] doublet) are in the range 10-6-10-4 (Heckman et al. 1984, van Breugel et al. 1985). However, values in the range 10-7-10-8 were obtained in studies of Ly nebulosities associated with high redshift quasars (Heckman et al. 1991b). The advantage in this case is that one knows the properties of the ionizing source with some confidence.
We obtain densities in the range 17-150 cm-3 for 10-5 (a factor of 10 higher if =10-7). In spite of all the sources of uncertainty, the calculated densities are similar to estimations by other authors using other techniques (e.g. Heckman et al. 1989, Heckman et al. 1991b) for gaseous nebulae associated with high redshift radio galaxies and quasars. As an example, McCarthy et al. [McCarthy et al. 1990a] calculated an upper limit for the density of the ionized gas in 3C294 of 150 cm-3 based on estimations of the pressure in the diffuse radio plasma.
4.2.5 Masses
The masses are calculated as , where is the proton mass and is the volume within the ionization cones. For the densities derived above and assuming the same biconical geometry and 10-5, the mass of ionized gas in the quiescent halos is in the range 109-10 M⊙ (a factor of 10 lower for =10-7). For comparison, McCarthy (1993) quoted typical masses of ionized gas in HzRG of 109 M⊙.
4.3 LSBH energetics
We investigate in this section the excitation mechanism of the giant LSBHs: photoionization by the quasar continuum, photoionization by the continuum generated by the hot shocked gas, photoionization by stars, cooling radiation from a cooling flow nebula.
4.3.1 Quasar
We estimate in this section the total quasar ionizing luminosities implied by the Ly luminosities of the quiescent halos. The total Ly luminosities expected from the ionization cones were calculated in §4.2.2. We have estimated assuming that in case B recombination 68% of hydrogen ionizations yield a Ly photon (Osterbrock 1989). We have also assumed a covering factor 0.15 of the quiescent halos as seen by the nucleus (Heckman et al. 1991a). We obtain in the range 3.11055 -7.01056 photons s-1.
If the ionizing continuum follows a power law of index =-1.0 [Villar-Martín, Tadhunter & Clark 1997], the total ionizing luminosities are in the range 4.41045-1047 erg s-1. In spite of the large uncertainties involved in the calculations, it is interesting to note that the values we have obtained are in the same range as radio loud quasars (McLure & Dunlop 2001) at comparable redshift 555High redshift quasars (2-3.4) with luminosities as high as 1048 erg s-1 have been reported (Kaspi et al. 2003).
We conclude that the halo luminosities and measured sizes can be naturally explained by quasar photoionization. This is further supported by the emission line spectra (strong CIV, HeII and in some cases NV emission) typical of active galaxies, and inconsistent with star forming objects.
4.3.2 Shocks
We have calculated the UV ionizing luminosity generated by shocks of different velocities (range 500-900 km s-1, Bicknell et al. [Bicknell et al. 2000]) which can explain the measured Ly luminosities of the LSBHs 666The quiet kinematics of the halos suggests that this gas has not been shocked, therefore, we reject collisional ionization.. Combining equations (4.1) and (4.4) in Dopita & Sutherland (1996) and assuming case B recombination value for Ly/H=26.5:
The total luminosity radiated by the shock is 2 (Dopita & Sutherland 1996) and a large fraction should be emitted within the optical filters. Using the Ly luminosities measured within the slit for the objects in our sample the resulting values are in the range several 1044-45 erg s-1 for 500 km s-1 shock velocity (higher values are obtained for higher velocities).
There is, however, no evidence for such source of continuum in the extended regions of HzRG. The high velocity gas gives us an idea of the spatial extent of the shocked gas. According to this, the continuum should have surface brightness in the range several 10-14-10-15 erg s-1 cm-2 arcsec-2. This is a gross lower limit, since we have only considered the gas within the slit. Typical optical surface brightness of HzRG measured from WFPC2/HST images are however few 10-16 erg s-1 cm-2 arcsec-2.
Another argument against shock processes is the extreme mass flow rates (Ṁ) through the shock required to explain the Ly luminosity (Villar-Martín et al. 1999). The required values are in the range 103-4 M⊙ yr-1 for =500 km s-1 (a factor 2.1 smaller for =900 km s-1). If the age of the radio source is 107 yr and it is entraining material during its pass through the gaseous environment, this would imply that the total amount of material ‘consumed’ by the shock is in the range 1010-11 M⊙. These masses are larger than the total mass of ionized gas in high redshift radio galaxies (e.g. McCarthy et al. 1990a, van Ojik et al. 1997, Villar-Martín et al. 2002). The amount of ‘consumed’ gas is likely to be higher, since we are only considering the one required to produce the luminosity measured inside the slit.
It is therefore unlikely that the excitation of the quiescent halos is due to shock related processes.
4.3.3 Cooling radiation
Steidel et al. (2000) proposed that the Ly giant (100 kpc) nebulae found around Ly break galaxies at 3 can be powered by radiative cooling of gas. Could this be the origin of the emission from the quiescent LSBHs in our sample?
Models of high redshift cooling flows for galactic systems in the process of formation [Fardal et al. 2001] predict Ly luminosities due to cooling radiation as high as few 1044 erg s-1. According to these models the range of measured Ly luminosities from the quiescent halos (Table 2) imply star forming rates (SFR) in the range 50-700 M⊙. These are gross lower limits, since we have used only the luminosity within the slit and neglected Ly absorption effects.
Using the luminosity (within the slit) at 1500 Å Vernet et al. [Vernet et al. 2001] estimated a range in SFR of 2-60 M⊙ yr-1 for the objects in our sample, not taking into account dust reddening. Although the estimations are affected by large uncertainties, it is interesting to compare with the model predictions by Fardal et al (2001). If the ratio of un-obscured to obscured SFR is similar to that of Lyman break galaxies at 3 (i.e. 25, Sawicki & Yee 1998), the SFR in our objects could be in the range 50-1500 M⊙ yr-1. If this is the case and according to Fardal et al. models, it is possible that in some cases the measured Ly luminosities are consistent with cooling radiation.
A problem for these models is that the line emission is expected to be concentrated in a very small region of radius 10 kpc or less for the most luminous halos (few 1043 erg s-1). To explain the large sizes of the Ly nebulae around Ly break galaxies discovered by Steidel et al. (2000), the authors propose that the Ly photons from gravitational cooling are scattered by neutral hydrogen in the outer neutral regions. However, we reject this interpretation since we have detected HeII and CIV in the outer parts of the quiescent halos and therefore, this gas is ionized.
Similar cooling flow models by Haiman, Spaans & Quataert [Haiman et al. 2000] predict Ly luminosities in the range 1043-44 erg s-1 due to cooling radiation within measured angular sizes in the range 11 to 15 arcsec for 2 to 3, consistent with the values in Table 2. One of the important differences with Fardal et al. [Fardal et al. 2001] models is the assumption that Ly is produced out to the virial radius, while Fardal et al. (2001) predict a much more concentrated Ly emission. A problem for Haiman, Spaans & Quataert [Haiman et al. 2000] models is that the expected surface brightness for the halos is few 10-19 erg s-1 cm-2 arcsec-2, a factor of at least 100 lower than we observe.
In summary, it is unlikely that the line emission from the giant quiescent halos is due to cooling radiation. Some high redshift cooling flow models can explain the measured Ly luminosities within the slit, however the models are inconsistent with the measured surface brightness or the angular sizes of the halos. In addition, a cooling flow nebula is likely to occupy a much larger volume than that within the slit and in such case, the high expected Ly luminosities would be also difficult to reconcile with cooling flow models.
4.3.4 Stars
Continuum has been detected from some of the LSBHs, which could be due to stars. We cannot confirm this, however. Scattered light or nebular continuum might be dominant (Vernet et al. 2001). A strong argument against stellar photoionization is the detection of high ionization lines such as CIV, NV and HeII, which require a much harder ionizing continuum. The LSBH emission line spectra are typical of high redshift active galaxies and very different from high redshift star forming objects.
Therefore, we conclude that the ionization of the quiescent giant halos along the radio axis is dominated by the quasar continuum. We do not reject the possibility that other mechanisms excite the gas in other regions across the LSBHs. The giant Ly nebulae revealed by narrow band images obtained by Reuland et al. (2003b) show Ly emission in regions which are also outside any putative ionization cones. Unless Ly is scattered (Villar-Martín, Binette & Fosbury, 1996) another mechanism must be responsible for the excitation of this gas.
4.4 Origin of the halos and dynamical masses of HzRG
4.4.1 Are the halos settled in a stable configuration ?
Rotating disks
VO96 and VM02 proposed that the giant quiescent halos could be settled in rotating disks. Both observations and theory [Barnes 2002] indicate that much of the interstellar gas in merging galaxies may settle into gaseous disks which may extend to several times the remnant half-light radii. Rotation of the extended emission line gas in some powerful radio galaxies at low redshifts suggests the presence of young disks of gas acquired in a recent interaction or merger with a gas rich galaxy [Baum, Heckman & van Breugel. 1992]. Large scale (up to 100 kpc) HI disk like structures have been found in several low redshift radio galaxies [Morganti et al. 2002] and elliptical galaxies [Oosterloo et al. 2002].
We have investigated whether there are signs of rotation in the LSBHs of our sample of HzRG.
-
•
3 objects (0211-122, 1558-003 and 1931+480) show velocity curves inconsistent with rotation.
-
•
4 objects (0943-242, 1410-001, 2104-242, 2105+236) show velocity fields consistent with rotation curves with the slit located along or close to the line of nodes. For 1410-001, the velocity shifts at the positive side of the spatial zero might map half of the rotation curve (Fig. 4, bottom)
-
•
1 object (1809+407) shows a velocity field consistent with a rotation curve with the typical V shape expected when the slit is located perpendicular to the line of nodes and with some impact parameter relative to the rotation center. This is also the case of 0828+193 (VM02)
-
•
for 0731+438 it is not possible to say, since the quiescent gas is detected only in two apertures.
Therefore, 6 (including 0828+193) out of 10 objects in the sample have velocity fields consistent with rotation. The rotation center (probably located at the position of the active nucleus) is clearly shifted from the spatial continuum centroid in some objects. This is expected, since the optical continuum is not direct AGN light, but nebular, stellar and/or scattered quasar light.
When the rotation curve is measured along the line of nodes, the dynamical mass can be calculated as , where is the radius of the disc, is half the amplitude of the rotation curve and is the inclination angle of the disk with respect to the plane of the sky. We have calculated dynamical masses for 0943-242, 2104-242 and 2105+236. is the maximum extension of the LSBH from the rotation center. This was determined for 0943-242 from the rotation curve (Fig 9, bottom). We have assumed that this position is marked by the radio core in 2104-242 and 2105+236. This is a good assumption for 2105+236, since the radio core was aligned with the vertex of the ionization cones (§2.2), where the active nucleus is expected to be. For 2104-242 the assumption might be wrong, since the NIR continuum centroid (which was aligned with the radio core) might be spatially shifted from the AGN. The results, however, are not strongly affected when considering a reasonable range of possible positions for the rotation center.
We obtain 2.8, 0.3 and 2.91012 M⊙ for 0943-242, 2104-242 and 2105+236 respectively777If the gas across 0943-242 and 2105+236 did not fill the slit, the velocity curves might partially reflect the gas distribution within the slit rather than rotation (see §3.2).. For comparison, vO96 estimated 1012 M⊙ for 1243+036. Typical masses of cD galaxies at low redshift are 1013 M⊙ or more. If the radio galaxies above have similar masses, this implies disk inclination angles 30 relative to the plane of the sky.
Alternative possibilities that would produce shallow rotation curves are 1) locating the slit across the rotation center and at certain angle (90 degr) relative to the line of nodes 2) the objects are less massive than cD giant ellipticals at low redshift. This result was also obtained by Tadhunter, Fosbury & Quinn [Tadhunter et al. 1989] from the kinematic study of the extended gas in low redshift powerful radio galaxies.
Companion satellites
As VM02 proposed, the halos might consist of a number of satellite companions. There is evidence that powerful radio galaxies at low redshift lie in rich environments, with numerous companions at small distances from the main galaxy (within the inner 100 kpc). Some examples are 3C171 [Heckman, van Breugel & Miley 1984], PKS2250-40 [Tadhunter et al. 1994] and Coma A [Tadhunter et al. 2000]. HzRG are known to lie in rich environments (Pentericci et al. 2002a, Venemans et al. 2002) and numerous star forming companions have been found in the field of at least one high redshift radio galaxy [Pentericci et al. 2002a].
However, the continuous detection of the quiescent halos across tens of kpc and the AGN type spectrum suggests that they are gaseous reservoirs, rather than companion (proto)galaxies. Although we could think of a scenario where the central (proto)galaxy is surrounded by a high number of active galaxies [Pentericci et al. 2002b] or that the central quasar ionizes the gas in the companion galaxies, a more natural explanation is that the halos are gaseous reservoirs. The diffuse and chaotic (filaments, plumes, cones) morphologies of the giant Ly nebulae revealed by recent narrow band images of high redshift radio galaxies [Reuland et al. 2003b] further support this interpretation. Companion satellites might be embedded in the diffuse halos but the line emission is likely to be dominated by the halos. Reuland et al. [Reuland et al. 2003b] find ‘gaps’ in the giant Ly nebulae which coincide with companion satellites revealed by K band images.
Gaseous spherical envelopes
Rather than settled in a disk, the quiescent halos could be gaseous envelopes supported against gravitation by the velocity dispersion within the halos (rather than rotation). The dynamical mass enclosed within a radius can be calculated as , where is in this case the radial velocity dispersion of the clouds [Carroll & Ostlie 1999] within the halo (given by the of the emission lines) and is (Table 2). The estimated masses are shown in Table 3.
| Name | within | within | |
|---|---|---|---|
| 1809+407 | 2.1 | 4.1 | |
| 0211-122 | 1.2 | 6.3 | |
| 1931+480 | 2.3 | 5.8 | |
| 1410-001 | 2.9 | 8.3 | |
| 0731+438 | 1.8 | ||
| 2105+236 | 3.2 | 5.4 | |
| 2104-242 | 1.0 | ||
| 1558-003 | 4.4 | 10.0 | |
| 0828+193 | 1.3 | ||
| 0943-242 | 2.3 | 4.4 | |
| 1243+036 | 1.0 |
Therefore, Mseveral 1012 M⊙ for most objects888The calculations for 0211-122, 0943-242, 1410-001, 1558-003 and 2105+236 could be affected by seeing effects (see §3.2). Considering the worse case scenario the masses would change to 8.1, 7.1, 12.1, 13.0, 8.5 1012, M⊙ respectively, using the maximum FWHM measured across the quiescent halos (Table 2). If the halos are virialized systems of clouds, these results suggest that most radio galaxies in this sample are less massive than nearby cD giant elliptical galaxies.
4.4.2 Inflows or Outflows
The possibility that the quiescent halos are cooling flow nebulae was discussed in §4.2. Although we concluded that the line emission is likely to be powered by the quasar continuum, this does not exclude the possibility that the halos are cooling flow nebulae (but with the quasar dominating the emission line processes). This will be discussed in more detail in §4.5.
An alternative possibility is that the halo has been deposited by galactic superwinds. Winds are needed to explain the chemical enrichment of the quiescent halos at tens of kpc from the nuclear region (the strength of the NV line relative to CIV and HeII in 0211-122 and 0943-242 suggests at least solar metallicities, Vernet et al. 2001; Humphrey et al. 2004 in prep.). We have calculated some basic parameters (following Heckman et al. 1990) characterizing a superwind which explains the kinematic properties and sizes of the quiescent giant halos: (1) energy injection rate ; (2) dynamical time ; (3) infrared luminosity expected from the starburst ; (4) required star forming rate ; (5) supernova rate ; (6) mass injection rate . The results for all the objects are shown in Table 4. We have assumed in our calculations a pre-shock density of 1 cm-3 (Heckman et al. 1990). Another parameter needed in the calculations is , which is half the separation in velocity between the two components of the double peak profile produced by the expanding bubble. The double peak is not resolved in our spectra and we can only estimate an upper limit for . We estimate that two unresolved emission lines separated by a given velocity would produce a line of FWHM2 = 4. Therefore , where we have assumed FWHM = FWHMmin in Table 2. The values for , , , and are likely to be high upper limits (lower limits for ) due to the strong dependence of these parameters with (). Typical values of low redshift starburst driven galactic superwinds are several hundred km s-1 at several kpc from the center. values might be smaller for the LSBHs, since the putative bubble has expanded to much larger distances (tens of kpc) and is likely to have decelerated.
| (1) | (2) | (3) | (4) | (5) | (6) | (7) | |
|---|---|---|---|---|---|---|---|
| Name | log() | ||||||
| 1045 erg s-1 | 108 yr | M⊙ yr-1 | M⊙ yr-1 | M⊙ yr-1 | |||
| 1809+407 | 0.9 | 3.2 | 13.1 | 3450 | 26 | 530 | |
| 0211-122 | 1.1 | 6.1 | 13.2 | 4200 | 32 | 650 | |
| 1931+480 | 1.2 | 4.7 | 13.2 | 4550 | 34 | 690 | |
| 0731+438 | 1.2 | 2.3 | 13.2 | 4570 | 35 | 700 | |
| 2104-242 | 0.4 | 9.8 | 12.7 | 1370 | 11 | 710 | |
| 1558-003 | 4.8 | 4.6 | 13.7 | 17970 | 138 | 2760 | |
| 0828+193 | 0.6 | 9.2 | 12.9 | 2200 | 17 | 340 | |
| 0943-242 | 1.0 | 5.9 | 13.2 | 3830 | 29 | 590 | |
| 1243+036 | 1.0 (*) | 3.8 (*) | 13.2 | 3000 (*) | 29 | 255 | |
| IRAS 00812-7112 | 0.6 | 12.9 | 2000 | 300 |
The derived upper limits are consistent with those measured for ultraluminous infrared galaxies (ULIRGs, 1012L⊙). Similar rest frame FIR luminosities have also been estimated for high redshift radio galaxies from submm observations (Hughes, Dunlop & Rawlings 1997).
Since the calculated parameters are gross upper limits, we can only say that a scenario such that the halos have been deposited by galactic winds is not excluded by the data set.
4.5 Cosmological implications
The discovery of the giant quiescent halos in all objects in the sample we have studied suggests that they are a common ingredient of high redshift radio galaxies. Although the nature of the halos – be they disks, spherical envelopes, cooling flow nebulae, gas deposited by winds – is not clear, they are giant gaseous reservoirs within which the radio galaxy is embedded.
Our results suggest that the halos surround the object completely. The gas we see in emission is the fraction of the halo inside the ionization cones which has been ionized by the quasar continuum. The gas outside these cones is likely to have much lower ionization level. Evidence for extended reservoirs of neutral gas associated with distant radio galaxies has been found by van Ojik et al. (1997; see also de Breuck et al. 2003).
We proposed in VM02 that the LSBHs could be part of the initial gas reservoir from which the galaxy started to condense. According to galaxy formation models (e.g. Haiman, Spaans and Quataert 2000), dark matter halos collapse in a cooling flow manner. As a result the baryons settle into rotationally supported exponential disks embedded in the dark matter halo. Circular velocities of few hundred km s-1 (consistent with our observations) would be expected for halos with masses several 1012 M⊙.
According to Haiman, Spaans and Quataert (2000), the expected line widths are of order 30[(1+)/6] Å , which corresponds to 915 km s-1 for HeII. The observed FWHM of the lines from the quiescent halos can be easily reconciled with the models taking into account that most disks are probably not seen edge on.
According to the models, due to Ly cooling radiation, the halos would have surface brightness few 10-19 erg cm-2 s-1 arcsec-2 out to the virial radius (15 arcsec). However, if a quasar switches on at some point and illuminates the halos, the expected surface brightness would rise to 10-16-17 erg cm-2 s-1 arcsec-2 [Haiman & Rees 2001] within the Strögrem radius consistent with our observations. The line widths, velocity shifts, measured angular sizes, line luminosities and surface brightness of the giant quiescent halos are consistent with this scenario.
The interpretation of a cooling flow and a rotating disk do not exclude each other, they could be two consecutive phases of the same process. What is clear in our case, is that the halos are not made of pristine material. They have been already enriched with heavy elements, which suggests an advanced state in the process. We have also found preliminary evidence for rotation in some of the halos (although it is not possible to discard other interpretations).
If this galaxy formation scenario is valid, we expect that similar structures exist associated with normal and active galaxies at different redshifts. The halos are likely to be more easily detected around powerful active galaxies, since the active nucleus provides an intense supply of ionizing photons. In fact, giant quiescent (total extension 100 kpc) emission line halos have been found in some 1 radio galaxies (e.g. Stockton, Ridgway & Kellogg 1996, Solórzano-Iñarrea, Tadhunter & Axon 2001).
The quiescent LSBHs could be related (progenitors?) to the giant HI disk like structures found around some low redshift radio galaxies [Morganti et al. 2002] and elliptical galaxies [Oosterloo et al. 2002]. An important difference is that the HI absorption line in these objects is usually much narrower (100 km s-1) than the emission lines from the quiescent LSBHs. This suggests that the high redshift structures are less settled.
It is possible that similar giant gaseous structures have also been found around non active galaxies at different redshifts. Steidel et al. (2000) discovered two giant (physical extent 100 ) diffuse Ly emitters apparently associated with previously known Ly break galaxies at 3.09. At low redshift, observations of absorption line systems in the spectra of background quasars have provided evidence for large (100 kpc) extended gaseous envelopes that surround galaxies of a wide range of luminosity and morphological type (e.g. Chen, Lanzetta & Webb 2001; Lanzetta et al. 1995). These galactic envelopes might have similar origin and nature as the giant quiescent halos we have discussed around high redshift radio galaxies.
Therefore, we propose a scenario such that a cooling flow has been triggered as a result of the collapse of a dark matter halo. The baryons will end up settling in a rotationally supported disk. During this process, the quasar has switched on and illuminates and excites the gas. This could happen before or after the gas has settled into the disk. The emission from the gas becomes easily detectable in this way, since its surface brightness is much brighter than expected from pure Ly cooling radiation. During the process, intense star formation has already taken place and outflows associated with supernovae explosions or the quasar activity have enriched the halos with heavy elements at tens of kpc from the nuclear region.
5 Summary and conclusions
We have studied the kinematic properties of the extended gas in a sample of 10 high redshift (2.5) radio galaxies observed with the Keck II and VLT telescopes. We have discovered in all 10 HzRG (including 0828+193, VM02) giant halos of quiescent gas with FWHM(HeII)850 km s-1 and velocity shifts across the nebulae 600 km s-1. This component often extends over about 50 kpc from the nuclear region and sometimes beyond the radio structures. The emission line spectra of the quiescent halos are typical of active galaxies. In addition, 8 out of 10 objects contain kinematically perturbed gas usually with high surface brightness and located inside the radio structures.
We propose that we have isolated the emission from gas whose kinematics has been perturbed by jet-induced shocks and the emission from ambient non shocked gas (the quiescent halos).
The quiescent halos often extend for more than 100 kpc and sometimes beyond the radio structures. Typical Ly surface brightness and luminosities (within the slit) are in the range few10 erg s-1 cm-2 arcsec-2 and 1043-44 erg s-1. Estimated densities are in the range 17-150 cm-3. The quiescent halos are enriched with heavy elements at tens of kpc from the active nucleus. The quasar continuum is the dominant excitation mechanism of the quiescent halos along the radio axis. The implied quasar luminosities are in the range several1045-1047 erg s-1, in the same range as radio loud quasars at comparable redshift. Cooling radiation, shock photoionization and stellar photoionization cannot explain at the same time all measured properties (line luminosities, surface brightness, sizes, line ratios) of the quiescent halos along the radio axis. We do not reject the possibility that other mechanisms excite the gas in other regions of the halos.
The quiescent halos are likely to be giant gaseous reservoirs (rather than companion galactic satellites). The detection in all objects suggests that they could be a common ingredient of high redshift radio galaxies. Whatever their nature (rotating disks, spherical envelopes, cooling flow nebulae, gas deposited by galactic winds) the radio galaxy seems to be embedded within the halos.
We propose a scenario such that the quiescent halos are part of dark matter halos that collapsed in the early phases of formation of what will become a giant elliptical galaxy. A cooling flow is generated. For the more evolved halos, the baryons have settled in a rotationally supported disk. In other objects, the cooling flow is in an earlier phase. At some point, a quasar has switched on and the halos have become observable thanks to strong line emission powered by the quasar continuum. Intense star formation has already been triggered and associated stellar winds or quasar outflows have enriched the halos with heavy elements at tens of kpc from the nucleus. The measured sizes, emission line widths, velocity shifts, presence of heavy elements, surface brightness and emission line luminosities of the quiescent halos are consistent with this scenario. 2D spectroscopy is now critical to map the kinematic, ionization and morphological properties of the halos in two spatial dimensions.
Acknowledgments
We thank Marshall Cohen for his help to collect the Keck data and useful scientific discussions. We thank Andrea Cimatti and Bob Goodrich for their support to collect the Keck set of data. We thank Chris Carilli for providing the radio VLA maps and the Leiden HzRG group for the 2104-242 VLT spectrum. RAEF is affiliated to the Astrophysics Division, Space Science Department, European Space Agency.
References
- [Archibald et al. 2001] Archibald E., Dunlop J., Hughes D., Rawlings S., Eales S., Ivison R., 2001, MNRAS, 323, 417
- [Barnes 2002] Barnes J., 2002, MNRAS, 333, 481
- [Barthel 1989] Barthel P., 1989, ApJ, 336, 606
- [Baum, Heckman & van Breugel 1988] Baum S., Heckman T., Briddle A., van Breugel W., Miley G., 1988, ApJ Suppl., 68, 833
- [Baum & Heckman 1989] Baum S., Heckman T., 1989, ApJ, 336, 681
- [Baum, Heckman & van Breugel 1990] Baum S., Heckman T., van Breugel W., 1990, ApJS, 74, 389
- [Baum, Heckman & van Breugel. 1992] Baum S., Heckman T., van Breugel W., 1992, ApJ, 389, 208
- [Best, Röttgering & Longair 2000] Best P., Röttgering H., Longair M., 2000, MNRAS, 311, 23
- [Bicknell et al. 2000] Bicknell G., Sutherland R., van Breugel W., Dopita M., Dey A., Miley G., 2000, ApJ, 540, 678
- [Carilli et al. 1997] Carilli C., Röttgering H., van Ojik R., Miley G., van Breugel W., 1997, ApJS, 109, 1
- [Carroll & Ostlie 1999] Carroll B, Ostlie D., 1999, in An Introduction to Modern Astrophysics. Addison-Wesley Publishing Company
- [Carson et al. 2001] Carson J., Larkin J., McLean I. et al., 2001, ApJ, 563, 63
- [Chambers et al. 1987] Chambers K., Miley G., van Breugel W., 1987, Nat, 329, 604
- [Chambers et al. 1996] Chambers K., Miley G., van Breugel W., Bremer M., Huang J., Trentham N., 1996, ApJS, 106, 247
- [Chen et al. 2001] Chen H-W., Lanzetta K., Webb J., 2001, ApJ, 556, 158
- [de Breuck et al. 2003] de Breuck C., Neri R., Morganti R. et al., 2003, A&A, 401, 911
- [Dopita & Sutherland 1996] Dopita M., Sutherland R., 1996, ApJSS, 102, 161
- [Eales et al. 1993] Eales S., Rawlings S., Dickinson M., Spinrad H., Hill G., Lacy M., 1993, ApJ, 409, 578
- [Egami et al. 2003] Egami E., Armus L., Neugebauer G., Murphy Jr T., Soifer B., Matthews K., Evans A., 2003, AJ, 125, 1038
- [Fan et al. 2001] Fan X., Strauss M., Schneider P., et al., 2001, AJ, 121, 54
- [Fardal et al. 2001] Fardal M., Katz N., Gardner J., Hernquist L., Weinberg D., Romeel D., 2001, ApJ, 562, 605, 617
- [Francis et al. 2001] Francis P., Williger G., Collins N. et al. 2001, ApJ, 554, 1001
- [Goodrich et al. 1995] Goodrich R., Cohen M., Putney A., 1995, PASP, 107, 179
- [Haiman et al. 2000] Haiman Z., Spaans M., Quataert E., 2000, ApJ, 537, L5
- [Haiman & Rees 2001] Haiman Z., Ress M., 2001, ApJ, 556, 87
- [Heckman, van Breugel & Miley 1984] Heckman T., van Breugel, Miley G., 1984, ApJ, 286, 509
- [Heckman et al. 1989] Heckman T., Baum S., van Breugel W., McCarthy P., 1989, ApJ, 338, 48
- [Heckman, Armus & Miley 1990] Heckman T., Armus L., Miley G., 1990, ApJS, 74, 833
- [Heckman et al. 1991a] Heckman T., Lehnert M, Miley G., van Breugel W., 1991a, ApJ, 381, 373
- [Heckman et al. 1991b] Heckman T., Lehnert M, van Breugel W., Miley G., 1991b, ApJ, 370, 78
- [Hughes, Dunlop & Rawlings 1997] Hughes D., Dunlop J., Rawlings S., 1997, MNRAS, 289, 766
- [Kaspi et al. 2003] Kaspi S., Netzer H., Maoz D., Shemmer O., Brandt W., Schneider D., 2003, in ‘Active Galactic Nuclei: from Central Engine to Host Galaxy’. ASP Conference Series, Vol. 290, p. 615. S. Collin, F. Combes and I. Shlosman eds.
- [Knopp & Chambers 1997] Knopp G., Chambers K., 1997, ApJS, 109, 367
- [Kurk et al. 2002] Kurk J., Pentericci L., Röttgering H, Miley G., 2002, Revista Mexicana de Astronomía y Astrofísica (Serie de Conferencias), Vol. 13, pp. 191-195
- [Lanzetta et al. 1995] Lanzetta K., Bowen D., Tytler D., Webb J., 1995, ApJ, 442, 538
- [Lilly & Longair 1984] Lilly S., Longair M., 1984, MNRAS, 211, 833
- [Maxfield et al. 2002] Maxfield L., Spinrad H., Stern D., Dey A., Dickinson M., 2002, AJ, 123, 2321
- [McCarthy et al. 1987] McCarthy P., van Breugel W., Spinrad H., Djorgovsky S., 1987, ApJ 321, L29
- [McCarthy et al. 1990a] McCarthy P.J., Spinrad H., van Breugel W., Liebert J., Dickinson M., Djorgovski S., Eisenhardt P., 1990b, ApJ, 365, 487
- [McCarthy et al. 1990b] McCarthy P.J., Kapahi V., van Breugel W., Subrahmanya C., 1990b, AJ, 100, 1014
- [McCarthy 1993] McCarthy P.J., 1993, ARA&A, 31, 639
- [McCarthy, Baum & Spinrad 1996] McCarthy P.J., Baum S., Spinrad H., 1996, ApJS, 106, 281
- [McLure et al. 1999] McLure R., Kukula M., Dunlop J., Baum S., O’Dea C., Hughes D., 1999, MNRAS, 308, 377
- [Morganti et al. 2002] Morganti R., Oosterloo S., Tinti S., Tadhunter C., Wills K., van Moorsel G., 2002, in ‘Seeing Through the Dust: The Detection of HI and the Exploration of the ISM in Galaxies’ ASP Conference Proceedings, Vol. 276. Taylor R., Landecker T. & Willis A. eds. ISBN: 1-58381-118-4. San Francisco: Astronomical Society of the Pacific, p.423
- [Motohara et al. 2000] Motohara K. Iwamuro F., Terada H. et al. 2000, PASJ, 52, 33
- [Oke et al. 1995] Oke J., Cohen M., Carr M., et al., 1995, PASP, 107, 375
- [Oosterloo et al. 2002] Oosterloo T., Morganti R., Sadler E., Vergani D., Caldwell N., 2002, AJ, 123, 729
- [Osterbrock1989] Osterbrock D., 1989, Astrophysics of Gaseous Nebulae and Active Galaxies (Mill Valley, CA: University Science Books)
- [Overzier et al. 2002] Overzier R., Röttgering H., Kurk J., De Breuck C., 2001, A&A, 367, L5
- [Pei 1995] Pei Y. 1995, ApJ, 428, 623
- [Pentericci et al. 1998] Pentericci L., Röttgering H., Miley G., Spinrad H., McCarthy P., van Breugel W., Macchetto F., 1998, ApJ, 504, 139
- [Pentericci et al. 1999] Pentericci L., Röttgering H., Miley G., McCarthy P., Spinrad H., van Breugel W., Macchetto F., 1999, A&A, 341, 329
- [Pentericci et al. 2000] Pentericci L., Kurk J., Röttgering H., Miley G., van Breugel W., Carilli C., Ford H., Heckman T., McCarthy P., Moorwood A., 2000, A&A, 361, L25
- [Pentericci et al. 2001] Pentericci L., McCarthy P., Röttgering H., Miley G., van Breugel W., Fosbury R., 2001, ApJS, 135, 63
- [Pentericci et al. 2002a] Pentericci L., Kurk J., Röttgering H., Miley G., Venemans B. 2002a, in ‘Tracing Cosmic Evolution with Galaxy Clusters’. ASP Conference Proceedings, Vol. 268. Borgani S., Mezzetti M., Valdarnini R. eds. ISBN: 1-58381-108-7 San Francisco, Astronomical Society of the Pacific, p.27
- [Pentericci et al. 2002b] Pentericci L., Kurk J., Carilli C., Harris D., Miley G., Röttgering H., 2002b, A&A, 396, 109
- [Reuland et al. 2003a] Reuland M., Röttgering H., van Breugel W., 2003a. To appear in the proceedings of the conference ”Radio Galaxies: Past, present and future”, Leiden, 11-15 Nov 2002, eds. M. Jarvis, et al (astro-ph/0303321)
- [Reuland et al. 2003b] Reuland M., van Breugel W., Röttgering H., de Vries W., Standford S., Dey A., Lacy M., Bland-Hawthorn J., Dopita M., Miley G., 2003b, ApJ, in press (astro-ph/0303637)
- [Röttgering et al. 1994] Röttgering H., Lacy M., Miley G., Chambers K., Saunders R., 1994, A&AS, 108, 79
- [Röttgering et al. 1995] Röttgering H., Hunstead R., Miley G., van Ojik R., Wieringa M., 1995, MNRAS, 277, 389
- [Sawicki & Yee1998] Sawicki M., Yee H., 1998, AJ, 115, 1329
- [Shaver et al. 1996] Shaver P., Wall J., Kellermann K., Jackson C., Hawkins M., 1996, Nat, 384, 439
- [Solórzano-Iñarrea et al. 2001] Solórzano-Iñarrea C., Tadhunter C., Axon D., 2001, MNRAS, 323, 965
- [Stockton et al. 1996] Stockton A., Ridgway S., Kellogg M., 1996, AJ, 112, 902
- [Steidel et al. 2000] Steidel C., Adelberger K., Shapley A., Pettini M., Dickinson M., Giavalisco M., 2000, ApJ, 532, 170
- [Tadhunter et al. 1989] Tadhunter C., Fosbury R., Quinn P., 1989, MNRAS, 240, 225
- [Tadhunter et al. 1994] Tadhunter C., Shaw M., Clark N., Morganti R., 1994, A&A, 288, L21
- [Tadhunter et al. 2000] Tadhunter C., Villar-Martín M., Morganti R., Bland-Hawthorn J., Axon D., 2000, MNRAS, 214, 849
- [Tadhunter et al. 2002] Tadhunter C., Dickson R., Morganti R., Robinson T., Wills K., Villar-Martín M., Hughes M., 2002, MNRAS, 330, 977
- [van Breugel et al. 1985] van Breugel W., Miley G. Heckman T. Butcher H., Bridle A., 1985, ApJ, 290, 496
- [van Breugel et al. 2001] van Breugel W., Reuland M., Kurk J., Venemans B., Röttgering H., Miley G., 2001, in proceedings of the conference ‘ Galaxies: the Third Dimension’ held in Cozumel, Mexico, 3-7 December 2001. Rosado M., Binette L. & Arias L. eds. To be published in ASP Conf. Series
- [van Ojik et al. 1994] van Ojik R., Röttgering H., Miley G.K., Bremer M.N., Macchetto F., Chambers K., 1994, A&A, 289, 54
- [van Ojik et al. 1996] van Ojik R., Röttgering H., Carilli C.L., Miley G.K., Bremer M.N., Macchetto F., 1996, A&A, 313, 25 (vO96)
- [van Ojik et al. 1997] van Ojik R., Röttgering H., Miley G., Hunstead R., 1997, A&A, 317, 358
- [Venemans et al. 2002] Venemans B., Kurk J., Miley G., et al., 2002, ApJ, 569, L11
- [Vernet et al. 2001] Vernet J., Fosbury R., Villar-Martín M., Cohen M., Cimatti, A., di Serego Alighieri S., Goodrich R., 2001, A&A, 366, 7
- [Villar-Martín, Binette & Fosbury 1996] Villar-Martín M., Binette L., Fosbury R., 1996, A&A, 312, 751
- [Villar-Martín, Tadhunter & Clark 1997] Villar-Martín M., Tadhunter C. & Clark N., 1997, A&A, 323, 21
- [Villar-Martín et al. 1999] Villar-Martín M., Binette L., Fosbury R., 1999, A&A, 346, 7
- [Villar-Martín et al. 1999] Villar-Martín M., Tadhunter C., Morganti R., Axon D., Koekemoer A., 1999, MNRAS, 307, 24
- [Villar-Martín et al. 2001] Villar-Martín M, Fosbury R., Vernet J., Cohen M., Cimatti A., di Serego Alighieri S., 2001, ApSSS, 277, 571
- [Villar-Martín et al. 2002] Villar-Martín M., Vernet J., di Serego Alighieri S., Fosbury R., Pentericci L., Cohen M., Goodrich R., Humphrey A., 2002, MNRAS, 336, 436