On total inelastic cross-sections and the average depth of the maximum of extensive air showers
Abstract
The model dependence of the development of extensive air showers generated by high-energy cosmic-ray particles in the atmosphere is studied. The increase of proton-proton and proton-air inelastic cross-sections and values for the elasticity are varied in the hadronic interaction model QGSJET. Using the CORSIKA simulation program, the impact of these changes is investigated on air shower observables like the average depth of the shower maximum and the number of muons and electrons at ground level. Calculating the mean logarithmic mass from experimental values, it is found that a moderate logarithmic increase of the proton-proton inelastic cross-section from mb at GeV to mb at GeV and an elasticity, additionally increased by 10% to 15%, describes the data best. Using these parameters, the mean logarithmic mass derived from measurements is compatible with the extrapolations of the results of direct measurements to high energies using the poly-gonato model.
pacs:
96.40.Pq, 13.85.Tp-
Submitted to J. Phys. G: Nucl. Part. Phys.24 Apr 2003, accepted 29 Aug 2003;
Preprint astro-ph/0309010
-
Keywords: cosmic rays; air shower; hadronic cross-sections; average depth of shower maximum; mass composition
1 Introduction
Cosmic rays above energies of eV are investigated by measurements of extensive air showers in the atmosphere. These cascades of secondary particles are generated by interactions of high-energy particles with air nuclei. While the shower develops in the atmosphere the number of particles increases up to a depth where the average energy of the secondaries equals a critical energy. Beyond this point the number of particles decreases approximately exponentially. The depth where the cascade reaches the largest number of charged particles is usually referred to as the depth of the shower maximum .
Two basic methods are used to examine air showers. In the first, the debris of the particle cascade on the Earth’s surface is observed in large detector arrays, measuring electrons, muons, and hadrons, viz. particle distributions at ground level. The second, calorimetric method investigates the longitudinal development of the shower by registration of Čerenkov or fluorescence light, generated by the shower particles in the atmosphere, and eventually is derived.
Recently, the author has compiled the results of many air shower experiments with the intention to estimate the best primary all-particle spectrum (Hörandel 2003). For this purpose, the energy spectra of individual elements as directly measured at the top of the atmosphere below 1 PeV have been extrapolated to high energy using power laws and assuming individual rigidity dependent cut-offs. The all-particle spectrum of these direct measurements was compared with air shower observations at higher energies. For the indirect measurements it turned out that the individual energy scales had to be renormalized to match the all-particle spectrum of direct measurements at 1 PeV. Only small energy shifts were necessary, all within the errors quoted by the experiments. But most shifts had a negative sign, indicating an overestimation of the primary energy. A likely explanation for this effect will be discussed later in chapter 6.
As a result all experiments yielded consistent all-particle energy spectra. The extrapolations of the direct measurements have been fitted to the average all-particle flux of the indirect measurements to determine the parameters of the individual cut-offs mentioned above. It has been shown, that the experimental data can be parametrized consistently within a phenomenological model, the poly-gonato model. The mean logarithmic mass obtained from the model is compatible with results from experiments measuring particle distributions at ground level. But the mass composition disagrees with results from experiments investigating the longitudinal shower development in the atmosphere.
A possible cause for the discrepancy might be, that the measured cascades penetrate deeper into the atmosphere than predicted by the simulations, viz. the codes predict a too small value of . A similar conclusion was drawn by Erlykin and Wolfendale (2002). Investigating the muon production height with the KASCADE experiment, Büttner et al(2001) also find an indication for a deeper penetration of cascades into the atmosphere as compared with predictions of the air shower simulation program CORSIKA (Heck et al1998) with the high-energy interaction model QGSJET (Kalmykov et al1997).
Reasons why the codes predict too small -values may be numerous. Objective of the present article is to study the influence of model parameters like the inelastic cross-sections or the elasticity on the average value of and, consequently, on the mean logarithmic mass derived from it. Goal of the investigations is to perhaps resolve the discrepancies in outlined above.
Some aspects of the impact of the complex system of parameters in simulation codes on are briefly summarized in chapter 2. Variations of the interaction model QGSJET are described in chapter 3. The resulting changes of and the consequences on are presented in chapters 4 and 5. For completeness, the influence of the changes on the number of electrons and muons at ground level is briefly sketched in chapter 6.
2 Model parameters and the average depth of the shower maximum
The longitudinal development of the nuclear cascade depends among others essentially on following physics quantities: The inelastic cross-sections of primary and secondary particles with air nuclei, the average number of particles produced in an interaction — the multiplicity , and the average fraction of energy transferred into secondary particles — the inelasticity . An increase of the inelastic cross-sections results in an earlier development of the cascade. A similar effect has an increased inelasticity. The particles lose more energy, hence the shower reaches its maximum earlier in the atmosphere. A reduction of the multiplicity produces less particles in the first interactions. Due to energy conservation they will be more energetic and the shower develops more slowly, i.e. the maximum is deeper in the atmosphere. Pajares et al(2000) derived a parametrization for the relative change of as function of the changes of and
| (1) |
A similar relation for the dependence of on inelastic cross-sections will be given below in chapter 4.
A variety of models has been used to study the development of extensive air showers and the effects of different parameters in the simulations on have been elaborated in the literature. Some of the findings are summarized in the following.
The average depths of the shower maximum obtained for different interaction models implemented in CORSIKA — i.e. DPMJET 2.5 (Ranft 1995 and 1999), NEXUS 2 (Drescher et al2001), QGSJET 01, and SIBYLL 2.1 (Fletcher et al1994, Engel et al1999) — have been compared by Knapp et al(2003). At knee energies a spread of the models of about 50 g/cm2 has been found for proton induced showers and 20 g/cm2 for primary iron nuclei.
Similar results have been obtained by Fowler et al(2001). The systematic differences in between different models in CORSIKA — HDPM (Capdevielle et al1992), QGSJET, SIBYLL, VENUS (Werner 1993) — at 1 PeV are specified as 45 g/cm2 for primary protons and 25 g/cm2 for iron nuclei.
The longitudinal shower development for the hadronic interaction models SIBYLL and QGSJET embedded in the framework of the MOCCA (Hillas 1997) and CORSIKA programs has been explored by Pryke (2001). At 1 PeV the differences in between CORSIKA/QGSJET and MOCCA with its internal hadronic interaction model amount to 45 g/cm2 for primary protons and to 30 g/cm2 for iron induced showers. The differences between the interaction models are related to distinct inelasticities: QGSJET produces more inelastic events, which lead to less deeply penetrating showers. Using the MOCCA frame in connection with its internal and the SIBYLL interaction model, the values differ only by about 5 to 10 g/cm2. This is compatible with estimates of Dickinson et al(1999) who obtained an increase of about 10 g/cm2 from MOCCA/MOCCA to MOCCA/SIBYLL.
Wibig (2001) discussed the influence of various hadronic interaction models — FRITIOF (Anderson et al1991), GMC (Wibig 1997), HDPM, QGSJET, SIBYLL, and VENUS — on the predictions for using the shower simulation program CORSIKA. For a primary energy of 1 PeV he found differences in the order of 40 g/cm2 for primary protons and 18 g/cm2 for iron nuclei.
A fast one-dimensional hybrid method has been used to simulate air showers by Alvarez-Muñiz et al(2002a). The models QGSJET 98 and two versions of SIBYLL (1.7 and 2.1) have been applied to describe the hadronic interactions. For SIBYLL 2.1 the inelastic proton-air cross-section rises faster with energy as compared with QGSJET, whereas the inelasticities are almost equal in both models. On the other hand, the multiplicity of charged secondary particles produced in proton-air collisions grows rapidly with energy for QGSJET. Compared with QGSJET, for SIBYLL 2.1 the mean values of of proton induced showers are about 6 g/cm2 larger at energies of 1 PeV and 10 g/cm2 at 1 EeV.
Gaisser et al(1993) investigated the statistical model (Landau 1969, Fowler 1987), the Kopeliovich-Nikolaev-Potashnikova (KNP) model (Kopeliovich 1989), and the mini-jet model (Gaisser and Halzen 1987). The characteristic differences between them are the energy dependences of the inelasticity. In the statistical model the inelasticity decreases with energy, almost constant values are obtained for the mini-jet model, and in the KNP model the inelasticity grows with energy. At 1.25 EeV the depth of the maximum of proton initiated showers varies by about 45 g/cm2. Due to the larger inelasticity the showers develop faster in the KNP model as compared with the statistical model. The latter represents the other extreme, generating relatively long showers.
The impact of internal parameters in the Quark Gluon String model (QGSJET) on the average depth of the shower maximum was examined by Kalmykov et al(1995). Different implementations for the contributions of semihard processes lead to differences in for primary protons of about 18 g/cm2 and 40 g/cm2 at 1 PeV and 100 PeV, respectively. The role of the production of charm particles for the air shower development was found to be negligible, the estimated differences are in the order of 3 g/cm2.
The effect of the multiplicity of secondary particles on was scrutinized by Anchordoqui et al(1999) using the AIRES program (Sciutto 1998) with the models SIBYLL and QGSJET. For both models the AIRES cross-sections have been utilized in the calculations. As a consequence of the lower inelasticity in SIBYLL, the model produces fewer secondaries than QGSJET. Hence, there is a delay in the shower development for SIBYLL generated cascades. Primary protons with energies of 1 PeV penetrate deeper into the atmosphere by about 45 g/cm2 and 100 g/cm2 at 1 EeV.
Capdevielle and Attallah (1995) pointed out how uncertainties in the description of parton distribution functions of hadrons influence the longitudinal development of air showers. The effects on inelastic cross-sections, multiplicity and inelasticity were derived. The maximal uncertainty in was estimated to be at 1 EeV in the order of 95 g/cm2 for proton induced showers and 40 g/cm2 for iron primaries.
A second step cascading mechanism was discussed in the geometrical multichain model by Wibig (1999). Second step cascading is defined as the interaction of a wounded nucleon of one nucleus with another nucleon from the same nucleus before hadronization occurs. These internuclear cascades result in an increase of the hadron air inelasticity for heavy nuclei. Results of CORSIKA simulations with this interaction model indicate that this mechanism results in an earlier shower development for iron nuclei of 10 g/cm2 to 30 g/cm2 at energies of 10 PeV to 10 EeV.
New effects in high-energy interactions like percolation, quark gluon plasma, or string fusion were anticipated by Pajares et al(2000). The authors concluded that these effects dump the multiplicity and increase the inelasticity. This leads to larger values of .
Erlykin and Wolfendale (2002) linked the observed discrepancies in to two effects in nucleus-nucleus collisions not been taken into account before: A few percent energy transfer into the electromagnetic component due to electron-positron pair production or electromagnetic radiation of quark gluon plasma and a small slow-down of the cascading process in its initial stages associated with the extended lifetime of excited nuclear fragments. The latter displaces the shower deeper into the atmosphere.
To summarize, several hypothetical effects have been described which could change the longitudinal shower development and their influence is not easy to segregate from each other. The maximum model ambiguities, taking into account all considerations as discussed, amount in the knee region to about g/cm2 for primary protons and 25 g/cm2 for iron induced showers. These uncertainties increase with energy to g/cm2 for proton induced showers at 1 EeV. In principle, the quoted ambiguities could be reduced (by some 30%) as some model approaches can be rejected by theoretical arguments and/or comparison with accelerator or cosmic-ray data. In addition to the model ambiguities discussed so far, there are experimental uncertainties, which will be discussed in chapter 4.
3 Inelastic hadronic cross-sections and other model parameters
Among the various parameters which control the shower development, the inelastic cross-sections and the elasticity will be scrutinized more closely. The actual situation can be recapitulated as follows.
3.1 Inelastic cross-sections
Inelastic cross-sections for proton-proton interactions are of great interest for particle physics. They have been measured in detail in collider experiments, but studied also at highest energies using cosmic rays. At energies exceeding TeV the knowledge about the increase of the proton-proton cross-section as function of energy is limited by experimental errors of both, collider and cosmic-ray experiments. The insufficient knowledge of the high-energy cross-sections restricts the reliability of simulation programs to calculate the interactions of high-energy cosmic rays.
A recent review of cross-sections from collider experiments has been given by Hagiwara et al(2002). At present, the highest energies at colliders are available at the Tevatron ( TeV). There, values for the total cross-section disagree by about 10% between different experiments, i.e. mb (E-811, Avila et al1999), mb (E-710, Amos et al1992), and mb (CDF, Abe et al1994a).
In cosmic-ray experiments the attenuation of the proton flux entering the
atmosphere is used to derive the inelastic proton-air cross-section. Then, the
latter is utilized to derive the proton-proton cross-section using the Glauber
theory (Glauber and Matthiae 1970). In air shower experiments three basic
methods are applied to obtain cross-sections:
1) The ratio of the proton flux at the top of the atmosphere to the
flux of surviving protons measured below the atmosphere at a depth
. From these quantities the interaction lengths of protons in air
is determined using the relation . This method needs high fluxes of penetrating
primary protons and, therefore, can be applied at relatively low energies only,
see Yodh et al(1983).
The second and third method take advantage of the fact that cosmic-ray
protons interact in the atmosphere at rates which decrease exponentially with
increasing depth.
2) For a fixed primary energy and zenith angle the distribution of the average
depth of the shower maximum has an exponential tail with a slope given by the
attenuation length , see e.g. (Baltrusaitis et al1984) or (Gaisser
et al1993).
3) The last method to derive utilizes the zenith angle distributions
of the shower intensity for fixed primary energies, as described by Hara et al(1983).
The attenuation length is connected with the interaction length by the relation
| (2) |
is a model dependent proportional factor, which among others depends on the mean inelasticity of the interactions . is the total inelastic proton-air cross-section, the effective atomic weight of air with the proton mass .
The conversion of the attenuation lengths to cross-sections depends essentially on theoretical assumptions on , for a discussion and theoretical motivation see e.g. (Kopeliovich et al1989), (Engel et al1998), or (Block et al2000). For example, using a different value for in equation (2), total inelastic cross-sections obtained by Baltrusaitis et al(1984) and Honda et al(1993) around c.m. energies TeV have been reduced by 10% to 15% by Block et al. The original value of the Fly’s Eye experiment mb at TeV has been rescaled to mb.
The subsequent conversion of proton-air to proton-proton cross-sections depends on theoretical uncertainties as well. The details required to apply Glauber theory in this context have been discussed by Gaisser et al(1987) as well as by Wibig and Sobczyńska (1998). The latter apply a geometrical scaling hypothesis, use an exact Glauber formalism and conclude, that the proton-proton cross-sections reported by Baltrusaitis et aland Honda et alare overestimated by about 10%.
Besides the theoretical uncertainties, all methods require that the primary cosmic-ray flux contains a sufficient fraction of protons, e.g. Hara et al(1983) derive cross-sections under the assumption of a contribution of at least 10% protons. Thus, additional systematic errors have to be taken into account concerning the unknown mass composition at high energies.

In early cosmic-ray work an increase of the inelastic cross-section as function of energy has been found by Yodh et al(1972, 1973). In the energy range up to 100 TeV the measured flux of unaccompanied hadrons at ground level has been used to calculate lower bounds for the proton-air cross-sections by Yodh et al(1983) combining several experimental results and also by Mielke et al(1994) using the KASCADE prototype calorimeter. Particle numbers measured with the EAS-TOP experiment have been used to deduce a value for the inelastic proton-air cross-section at knee energies (Aglietta et al1997). At the highest energies has been derived from the shower attenuation length by the Fly’s Eye experiment (Baltrusaitis et al1984) using the exponential tail of distributions and by the AGASA experiment (Honda et al1993) measuring particle numbers at ground level. Dyakonov et al(1990) derived lower limits for cross-sections from investigations of the Yakutsk data, applying two methods, fits to the exponential tail of and observing the zenith angle distribution of the shower intensity for fixed energies. A second analysis of the Yakutsk data (Knurenko et al1999) takes into account the tail of the distributions at fixed energies. The results obtained are shown in figure 1 as function of laboratory energy .
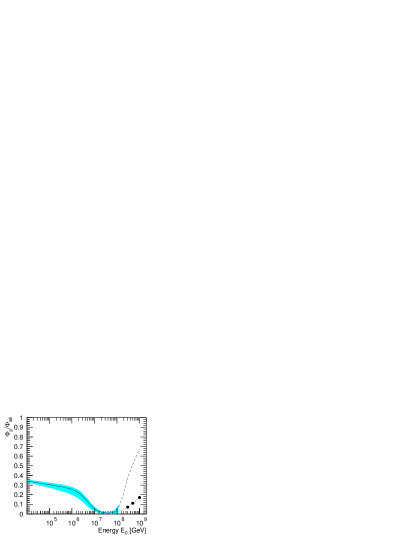
The experimental values shown in figure 1 have been derived assuming a sufficiently large contribution of protons in primary cosmic rays. The validity of this assumption shall be examined next. For this reason, the fraction of protons as function of energy is shown in figure 2. It has been obtained from the analysis of direct measurements and air shower data applying the poly-gonato model, as outlined in the introduction. The solid line represents the ratio for the cosmic rays which shall be denoted, with precaution, as the ”galactic component”. The error band indicates the uncertainties expected from the model. Since the average all-particle spectrum is reasonably well known, the error indicated depends essentially on the parametrization of the proton flux and its errors. According to the poly-gonato model the galactic component is characterized by cut-offs of the flux of individual elements at energies proportional to their nuclear charge (), starting with protons at an energy PeV. Above GeV this galactic component is not sufficient to describe the observed all-particle spectrum within the model. Hence, an additional component has to be introduced ad hoc in order to account for the measured flux values. Above GeV the dashed line gives an upper limit for the proton fraction, assuming the ad-hoc component being protons only. The proton fraction decreases with energy from 35% at GeV to below 1% at GeV. Beyond this energy the upper limit increases again. However, taking the error band into account, at least between and GeV protons contribute only little to the all-particle flux (). Thus, one of the premises to derive proton-air cross-sections in this energy region is weakened and, maybe, the values obtained from air shower measurements have to be corrected.
In order to check the impact of inelastic cross-sections on the development of extensive air showers, the cross-sections are altered within a particular model. The present studies have been carried out using the simulation program CORSIKA version 6.0190. Investigations by the KASCADE group (Antoni et al1999, Milke et al2001) indicate that the interaction model QGSJET 98 describes the measured data most consistently. Hence, the latest version of this code, i.e. QGSJET 01, has been chosen for the simulations. Within this program the parametrizations for the inelastic hadronic cross-sections have been modified in order to change their energy dependence at high energies, the contribution of mini-jets has been reduced. The changes affect all inelastic cross-sections, like proton-proton, proton-air, and pion-air at the same time. In addition, a parameter had to be readjusted which essentially influences the multiplicity of produced particles in order to match pseudo-rapidity distributions of collider experiments. This implies a reduction of the average number of charged particles produced.
In the following the original QGSJET code is referred to as model 1, while the two modifications with smaller cross-sections are labeled model 2 and 3, respectively. In addition, for model 3 the average transverse momentum has been reduced and the elasticity has been increased, these changes are combined in model 3a.

The inelastic cross-sections for models 1 to 3 for proton-proton collisions are shown in figure 3 as function of laboratory energy. At GeV the cross-sections vary between mb for the original QGSJET model and mb for model 3. At the Tevatron ( GeV) for the total elastic cross-section the values mb (E-811, Avila et al1999), mb (E-710, Amos et al1990), and mb (CDF, Abe et al1994b) have been measured. Together with the total cross-sections mentioned above, values for the total inelastic cross-section are obtained as shown in the figure. Model 1 corresponds to the CDF value, model 2 to the results of E-710 and E-810, while model 3 marks approximately the lower error bound for the last two experiments.
Next, the model predictions are compared with air shower measurements. The proton-air cross-sections for models 1 to 3 have been plotted in figure 1 and are compared with experimental results. At GeV values between mb for the original QGSJET 01 (model 1) and mb for model 3 are obtained. At low energies up to GeV the results by Yodh et al(1983) and Mielke et al(1994) are compatible with the QGSJET cross-sections for all three cases considered. The cross-section obtained by the EAS-TOP collaboration is still lower, even when compared with model 3. On the other hand, the results from AGASA and Fly’s Eye are about 1 to 2 above the calculated curve for model 3. Taking into account the low proton content of primary cosmic rays in this energy region according to the poly-gonato model, the experimental values are likely too large. The results of the EAS-TOP and AGASA experiments rely on the measurements of particle numbers at ground level. As has been pointed out by Alvarez-Muñiz et al(2002a), intrinsic shower fluctuations strongly influence the cross-sections obtained from such measurements. The experimental uncertainties may be illustrated by two analyses of the Yakutsk data. The cross-sections obtained by Dyakonov et al(1990) are found to be compatible with model 3, while on the other hand, the more recent values of Knurenko et al(1999) are about above model 3. Summarizing, no serious disagreement between experimental values and the cross-sections for model 3 can be stated.


In figure 4 the cross-sections for models 1 to 3 are compared with results of other model calculations. In the left-hand panel the values for the models DPMJET 2.5, HDPM, SIBYLL 2.1, VENUS (Knapp et al2003), and NEXUS 2 (Bossard et al2001) as implemented in CORSIKA are shown. Compared with model 3 the cross-sections for DPMJET, NEXUS, and SIBYLL grow faster as function of energy. At energies below GeV the HDPM cross-sections are smaller than the values for model 3, while VENUS exhibits nearly the same behavior as model 3.
The right-hand graph summarizes further theoretical considerations. Kopeliovich et al(1989) extrapolate results from collider experiments and calculate inelastic proton-air cross-sections. Their results for a QCD pomeron with an asymptotic intercept are presented, these cross-sections are slightly larger than those for model 3. Also Frichter et al(1997) extrapolate results from accelerator measurements to high energies. They use relative low inelasticities and in turn obtain cross-sections larger as the previous model. But they admit that such low inelasticities are unable to account for the Fly’s Eye data reported by Gaisser et al(1993) and Bird et al(1993). Similar values as for model 3 are obtained by Huang et al(2003) using the COSMOS simulation code. Gaisser et al(1993) investigate the falling slope of the observed distribution as measured by the Fly’s Eye experiment and conclude, that this decrement is consistent with a near linear energy dependence of the inelastic proton-air cross-section. Their results are shown in the figure as well and are found to coincide with the values for model 3. The authors conclude further, when the extrapolations of proton-proton cross-sections from collider experiments to high energies by Block et al(1992) are converted to proton-air cross-sections (Gaisser et al1987), one obtains values which are slightly above the dependence mentioned above. Also these values are compatible with those of model 3.
| Total inelastic cross-sections [mb] | ||||||||
| Energy | model 1 | model 2 | model 3 | |||||
| [GeV] | ||||||||
| 30 | 265 | 30 | 265 | 30 | 265 | |||
| 35 | 289 | 35 | 289 | 35 | 289 | |||
| 40 | 317 | 40 | 315 | 40 | 314 | |||
| 48 | 349 | 46 | 344 | 45 | 339 | |||
| 57 | 385 | 54 | 375 | 51 | 364 | |||
| 68 | 422 | 63 | 408 | 57 | 390 | |||
| 80 | 460 | 74 | 443 | 64 | 416 | |||
| 93 | 498 | 85 | 478 | 72 | 443 | |||
| 107 | 536 | 98 | 514 | 80 | 470 | |||
The inelastic cross-sections for both, proton-proton and proton-air interactions according to models 1 to 3 are listed in table 1 as function of energy for reference.
3.2 Other model parameters

The reduction of the contribution of mini-jets also influences the pseudo-rapidity . Therefore, another parameter — mainly reducing the multiplicity — had to be readjusted in order to match measurements at the Tevatron ( TeV ), shown in figure 5 together with the predictions of the models 1 to 3a. For central collisions () the values increase from model 3a to model 1. While for large values the distributions for all models almost coincide. In conclusion, all four models yield very similar distributions, which describe well the CDF-measurements (Abe et al1990), taking their error bars into account.


The frequency distributions of the number of charged particles simulated for proton-antiproton collisions at TeV are plotted on the left-hand side of figure 6. The results obtained with the four models are very similar. A closer look reveals, the right-hand tail of the distributions is slightly steeper for models 3 and 3a as compared with model 1. At the same time, the average multiplicity is reduced by up to 5% from (model 1) to for model 3 and for model 3a. The model predictions are compared with measurements at the Tevatron (E-735, Alexopoulos et al1998). The data have been normalized to the calculated values for model 1 over a range of multiplicities starting at the peak of the distributions around . At medium multiplicities () model 1 slightly overestimates the production probability, while at high multiplicities all four models are below the measured values.
Of great importance for the air shower development are pion-nitrogen collisions. The average multiplicity of charged particles for these interactions is shown in figure 6 (right-hand side) as function of laboratory energy. For models 3 and 3a the average multiplicity is significantly lower as compared with model 1. The differences amount to more than a factor of three at the highest energies shown. Compared with other interaction models like DPMJET, NEXUS, or SIBYLL, relatively large values for are obtained with the original QGSJET at high energies (Knapp et al2003). On the other hand, the multiplicities obtained with models 3 and 3a coincide with the values for DPMJET 2.5.

The average elasticity of the most energetic meson in pion-nitrogen interactions is plotted in figure 7 as function of laboratory energy for the four models. As can be seen in the figure, the reduction of the mini-jet contribution, as described above, also increases the elasticity at high energies. In model 3a the elasticity has been increased additionally by 10% to 15% relative to model 3 to check the influence of this parameter on the shower development.


Reducing the inelastic cross-sections in QGSJET via a reduction of the mini-jet contribution also reduces the average transverse momentum . Average values of for charged pions and kaons in proton-antiproton collisions are shown in figure 8 (left-hand graph) as calculated with the different versions of QGSJET in the energy region of the Tevatron. Measurements from experiment E-735 are depicted for comparison. The average obtained with models 1 to 3 is up to 15% larger than the measurements for pions. Therefore, the average predicted with model 3a has been adjusted to the experimental values shown. Unfortunately, the trend of the energy dependence of for kaons is less well described by all models discussed. But, since pions are clearly dominant for the air shower development, emphasis is given to a correct description of the transverse momenta for pions.
The average transverse momentum of charged particles in pion-nitrogen collisions is shown in figure 8 (right-hand graph) as function of laboratory energy. At the highest energies the values for model 3a are about 15% below the average as calculated with model 1.
In summary, it may be concluded that the four models exhibit distinct differences in certain quantities. Individual experimental results are described better by one or another model. But in a general view, all four versions of QGSJET are compatible with results from collider and air shower experiments, or at least no serious disagreement between the models and the measurements can be stated.
4 The average depth of the shower maximum
In this chapter, the consequences of changing the inelastic cross-sections and the other modified parameters on the longitudinal development of air showers shall be investigated. For this purpose, in the energy range from GeV up to GeV, 500 showers induced by primary protons and 100 by iron nuclei have been simulated for each energy in steps of half a decade using the CORSIKA program. To describe the high-energy hadronic interactions the models 1 to 3a have been used together with the GHEISHA code for energies below 80 GeV. The discussion of the results is divided in two sections, on average values and on distributions.
4.1 Average -values

The average depth of the shower maximum as obtained by the calculations is shown in figure 9 as function of energy for primary protons and iron nuclei for the four models considered. The original QGSJET yields the smallest values, with model 3a the showers penetrate deepest into the atmosphere. The values change at GeV from g/cm2 to g/cm2 for proton induced showers and from g/cm2 to g/cm2 for iron primaries. is listed in table 2 as function of energy for the four versions of the QGSJET model.
The simulated values are compared with experimental results from various experiments in the figure. Two different techniques are used to measure , namely the imaging technique, using telescopes to obtain a direct image of the shower and the non-imaging method, in which the height of the shower maximum is derived from the lateral distribution of the Čerenkov light (or electrons in case of Haverah Park) measured at ground level. The DICE, Fly’s Eye, and HiRes experiments use the imaging method, while all other experiments belong to the second group. The data show systematic differences of g/cm2 at 1 PeV increasing to g/cm2 close to 10 PeV. A more detailed discussion of the measurements is given elsewhere (Hörandel 2003). Some of the experimental uncertainties may be caused by changing atmospheric conditions. The experiments measure a geometrical height which has to be converted into an atmospheric depth. Measuring longitudinal atmospheric profiles during different seasons, Keilhauer et al(2003) found that the atmospheric overburden for a fixed geometrical height (e.g. 8 km a.s.l.) varies by at least 25 g/cm2.
| Average depth of the shower maximum [g/cm2] | |||||||||||||||||||
| Energy | model 1 | model 2 | model 3 | model 3a | |||||||||||||||
| [GeV] | p | Fe | p | Fe | p | Fe | p | Fe | |||||||||||
| 496 | 6 | 349 | 3 | 492 | 4 | 346 | 3 | 486 | 4 | 338 | 4 | 494 | 5 | 345 | 3 | ||||
| 524 | 4 | 382 | 3 | 528 | 4 | 384 | 3 | 525 | 4 | 383 | 3 | 528 | 4 | 384 | 3 | ||||
| 555 | 5 | 428 | 3 | 561 | 4 | 426 | 3 | 558 | 4 | 420 | 3 | 568 | 4 | 420 | 3 | ||||
| 587 | 4 | 464 | 3 | 590 | 3 | 462 | 3 | 594 | 4 | 458 | 3 | 599 | 4 | 463 | 3 | ||||
| 612 | 3 | 503 | 3 | 614 | 3 | 500 | 3 | 634 | 4 | 498 | 2 | 641 | 4 | 501 | 3 | ||||
| 641 | 3 | 535 | 2 | 649 | 3 | 542 | 3 | 663 | 4 | 533 | 2 | 673 | 4 | 537 | 3 | ||||
| 668 | 3 | 567 | 2 | 684 | 3 | 575 | 2 | 692 | 3 | 568 | 3 | 702 | 3 | 577 | 2 | ||||
| 698 | 3 | 599 | 2 | 711 | 3 | 604 | 3 | 731 | 4 | 608 | 3 | 739 | 4 | 617 | 3 | ||||
| 722 | 3 | 626 | 2 | 743 | 3 | 635 | 2 | 762 | 4 | 640 | 3 | 776 | 3 | 650 | 2 | ||||
| 754 | 3 | 663 | 2 | 770 | 3 | 668 | 3 | 804 | 5 | 673 | 3 | 808 | 3 | 684 | 2 | ||||
| 777 | 5 | 695 | 2 | 797 | 3 | 700 | 2 | 830 | 3 | 710 | 2 | 842 | 3 | 712 | 2 | ||||
| 801 | 3 | 722 | 2 | 818 | 3 | 735 | 2 | 866 | 4 | 747 | 3 | 870 | 3 | 752 | 2 | ||||
The ambiguities between the different experiments are of the same order as the systematic differences between individual models as discussed in chapter 2, where ambiguities of about 45 g/cm2 for proton and about 25 g/cm2 for iron induced showers have shown up. It can be noticed that up to 4 PeV the measured values increase faster as function of energy than the simulated values for the original QGSJET (model 1). With the modifications in model 3a the simulated showers penetrate deeper into the atmosphere and the increase is almost parallel to the data.
An estimate for the dependence of on the multiplicity and the inelasticity has been given in equation (1). The present investigations confirm the dependence of on the inelasticity. The correlations between changes in the inelastic proton-proton as well as proton-air cross-sections and can be estimated by
| (3) |
Since the changes of the parameters in QGSJET affect all cross-sections simultaneously, the dependencies on one particular cross-section can not be disentangled.
In the superposition model of air showers, the development of a cascade induced by a primary particle with energy and nuclear mass number is described by proton induced subshowers of energy . Hence, the shower maximum of a proton induced shower should be equal to that for an iron primary at higher energy
| (4) |
The quantity defined as
| (5) |
specifies the increase of the curve in the energy interval , it relates to the frequently used elongation rate as . The right-hand side of equation (5) follows immediately from equation (4). This indicates, that the slopes of the curves are correlated with the difference between the proton and iron curves at a given energy. Such a behavior is visible in figure 9. For model 3a the curves for protons and iron nuclei are almost straight lines in the logarithmic plot. In the energy range shown, changes from about 150 g/cm2 to approximately 120 g/cm2 only. On the other hand, the logarithmic slope of the two curves for model 1 decreases significantly with rising energy and the difference between protons and iron diminishes from g/cm2 to g/cm2.
In the previous chapter cross-sections for several models have been presented. It is interesting to compare the depths of the shower maxima calculated with these codes to the depths obtained with the QGSJET modifications. values for primary protons and iron nuclei for the interaction models DPMJET 2.5, NEXUS 2, and SIBYLL 2.1 have been calculated by Knapp et al(2003) using the CORSIKA program. The results are compared in figure 10 to values for models 1 to 3a. SIBYLL predicts relatively early developing cascades with values between models 1 and 2. On the other hand, DPMJET generated showers penetrate deeper into the atmosphere similar to model 3a. The validity of the NEXUS code is guaranteed by its authors up to GeV and, correspondingly, up to this energy is plotted. The depths calculated with this code are very similar to the SIBYLL predictions. Depths simulated with the MOCCA code using the internal interaction model (Pryke 2001) are significantly larger as compared with the other codes. With the original QGSJET 01 (model 1) the shortest development of the cascades is obtained.

In figure 4 it has been shown, that the inelastic cross-sections for SIBYLL rise faster as compared with DPMJET. This is compatible with deeper penetrating showers for DPMJET, as can be inferred from figure 10. How also the other parameters, like the multiplicity, effect the longitudinal development can be seen as an example with DPMJET. Its showers penetrate deeper into the atmosphere than those generated with model 1, despite the almost identical cross-sections (see figure 4). However, the multiplicity of charged particles grows faster with energy for QGSJET as compared with DPMJET, e.g. at GeV the multiplicities differ by about a factor of 3 (see figure 6).
4.2 -distributions
In addition to the average depths, probability distributions of values have been published and can be investigated. In the energy range from to beyond GeV experimental -distributions from the Fly’s Eye (Gaisser et al1993) and HiRes (Abu-Zayyad et al2001) experiments are presented in figure 11. Early distributions of the Yakutsk experiment (Dyakonov et al1990) are not compatible with more recent average values (Dyakonov et al1993), shown in figure 9, and are therefore not taken into account.


The results of the measurements are compared with calculated distributions using model 3a for primary protons, helium, oxygen, iron, and ultra-heavy nuclei. The CORSIKA code allows primary nuclei with mass numbers . The distributions for ultra-heavy nuclei have been estimated assuming , based on the simulated values for protons and iron nuclei. For each energy interval the mass composition is taken according to the poly-gonato model, i.e. the abundances are taken as predicted and listed in table 3. Distributions for five mass groups, represented by the nuclei mentioned above, have been calculated. The resulting -distributions are shown in figure 11 as solid histograms. For the three energy intervals the left-hand side of the Fly’s Eye distributions is described reasonably well by the galactic component. It should be stressed that the agreement has not been achieved by a fit to the distributions. Instead, the mass composition as obtained with the poly-gonato model has been chosen.
When comparing the same Fly’s Eye data to results obtained with the original QGSJET code, an offset g/cm2 had to be added to the simulated values in order to reconcile the measured with the simulated distributions (Hörandel 2003). A shift in the opposite direction has been performed by Gaisser et al(1993) in order to achieve agreement between calculations with the KNP model and the Fly’s Eye data, the simulated values have been shifted by g/cm2. As can bee seen in figure 11, with model 3a no artificial offset is necessary to describe the Fly’s Eye distributions at the side of low . This indicates experimental evidence for deeper penetrating showers as obtained with model 3a.
The galactic component accounts only for a fraction of the observed cosmic rays in the energy range considered in figure 11. As mentioned in chapter 3, close to GeV the heaviest elements of the galactic component reach their cut-off energies and a new component starts to dominate the all-particle spectrum. For the additional component only the flux but not the mass composition can be predicted. Assuming only protons for this component cannot explain the experimental distributions. Hence, helium and the CNO group have been added. A fit to the Fly’s Eye data using the simulated distributions for protons, helium, and oxygen yields the dashed histograms as the sum of the galactic and the ad-hoc component. The relative abundances obtained are listed in table 3 in brackets. As can be seen in the figure, the dashed histograms reproduce well the Fly’s Eye distributions, indicating a mixed mass composition for the ad-hoc component. The contribution of the CNO group seems to be essential to describe the peak region of the experimental distributions. Protons account for the long, asymmetric tail towards large values of . The steep gradients on the left-hand side originate in the relative narrow distributions for the ultra heavy elements of the galactic component with their small intrinsic fluctuations in the shower development.
| Energy [GeV] | ||||
| protons | 1 | (7) | (11) | (17) |
| helium | 2-5 | (19) | (28) | (37) |
| CNO | 6-14 | (10)+2 | (12)+1 | (13) |
| heavy | 15-27 | 22 | 10 | 4 |
| ultra heavy | 28-92 | 40 | 38 | 29 |
Using the HiRes data for the fit would result in a slightly lighter mass composition. But due to the relatively large errors for the energy range GeV a fit seems not to be meaningful.
The fraction of protons obtained for the ad-hoc component is plotted in figure 2 as function of energy (filled points). Between and GeV the primary cosmic-ray flux is not dominated by protons. Between GeV and GeV the fraction amounts to less than 10%, between GeV and GeV its value is even below 5%. One has to bear in mind this indication when proton-air cross-sections are derived from air shower measurements.
The low inelastic cross-sections and higher values for the elasticity assumed in model 3a have implications on the mass composition derived from measurements at energies above GeV as pointed out above. With the low cross-sections also intermediate and heavy elements are important in this energy region. In the energy region between and GeV a relatively heavy composition has been found also by Alvarez-Muñiz et al(2002b), viz. consisting of 85% Fe, 10% CNO, 4% He, and 1% protons. Similar values are calculated with the poly-gonato model at GeV: 86% heavy and ultra-heavy (), 9% CNO (), 4% He (), and % protons. A key issue of the present investigations is that cosmic rays above GeV, i.e. the ad-hoc component, contain a significant contribution of particles heavier than protons. A mass composition heavier than protons only in this region is also obtained by Erlykin and Wolfendale (2002).
5 Mean logarithmic mass
Many scientists characterize the mass composition of high-energy cosmic rays by the mean logarithmic mass. It is defined as
| (6) |
with the relative fraction of nuclei with mass . Knowing the average depth of the shower maximum for protons and iron nuclei from simulations, the mean logarithmic mass can be derived in the superposition model from the measured values using
| (7) |
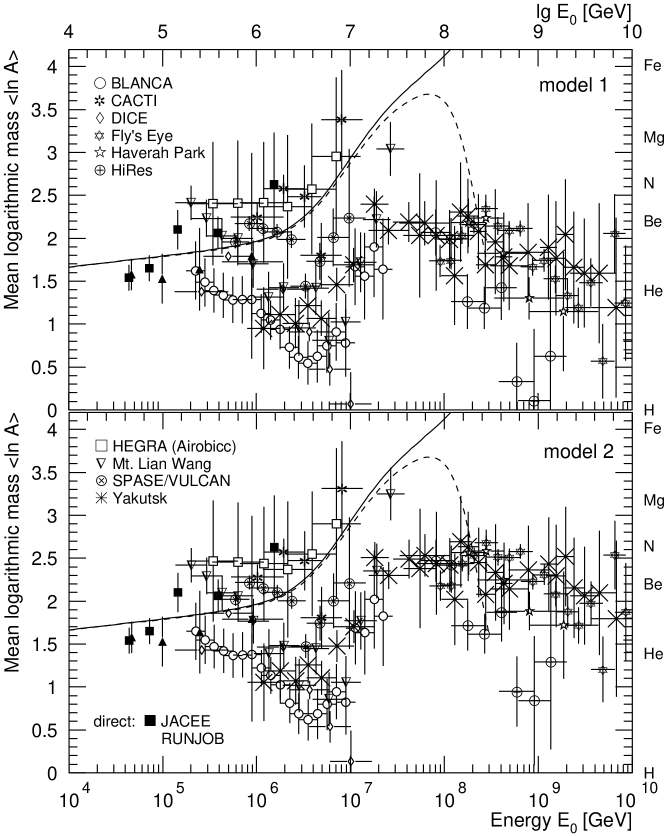
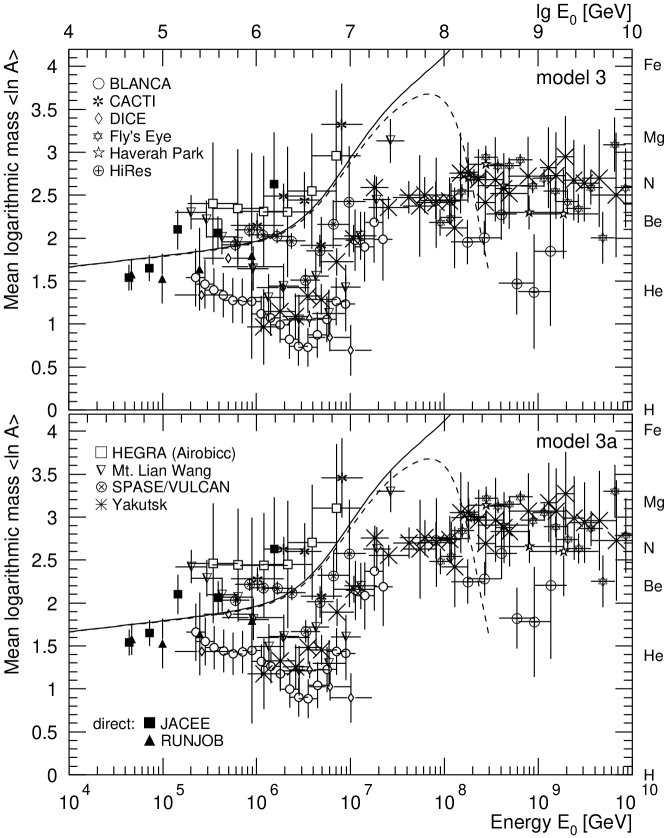
The corresponding values for the variations of QGSJET 01, obtained from the data presented in figure 9, are plotted versus the primary energy in figure 12 for models 1 and 2 as well as for models 3 and 3a in figure 13. The average increases as the cross-sections decrease from model 1 to model 3. For the original QGSJET the results of many experiments exhibit a (strong) decrease of up to about GeV and an increase above this energy. The energy of this dip in the values coincides with the energy of the knee in the all-particle energy spectrum. The dip becomes less striking with lower inelastic cross-sections and higher values for the elasticity. For model 3a only a modest dip can be recognized. At 4 PeV the average values increase from for model 1 to for model 3a. Around GeV the average logarithmic mass compared with model 1 is about larger for model 3 and larger for model 3a. These examples illustrate how strong the interpretation of air shower measurements depends on model parameters like the inelastic cross-sections or elasticities used. At Tevatron energies the cross-sections vary within the error range given by the experiments and at GeV the proton-air cross-sections of models 1 and 3 differ only by about 10%, but the general trend of the emerging distributions proves to be significantly different.
At this point the circle closes. If we assume in the energy region from to GeV a small proton fraction only, the cross-sections have to be corrected and lowered to the region of values for model 3. In turn a heavier composition is obtained for model 3 as has been demonstrated in figure 13. Thus, at least qualitatively the arguments are consistent.
Results from the balloon experiments JACEE (Shibata 1999) and RUNJOB (Apanasenko et al2001) are presented in figures 12 to 14 (filled points) for comparison. No hint for a decreasing mean logarithmic mass is indicated by these measurements. The solid lines shown in the figures are predictions according to the poly-gonato model for the galactic component and the dashed lines include an ad-hoc component of protons only. Both, the results of the balloon experiments shown as well as the values calculated with the poly-gonato model seem to support model 3a.
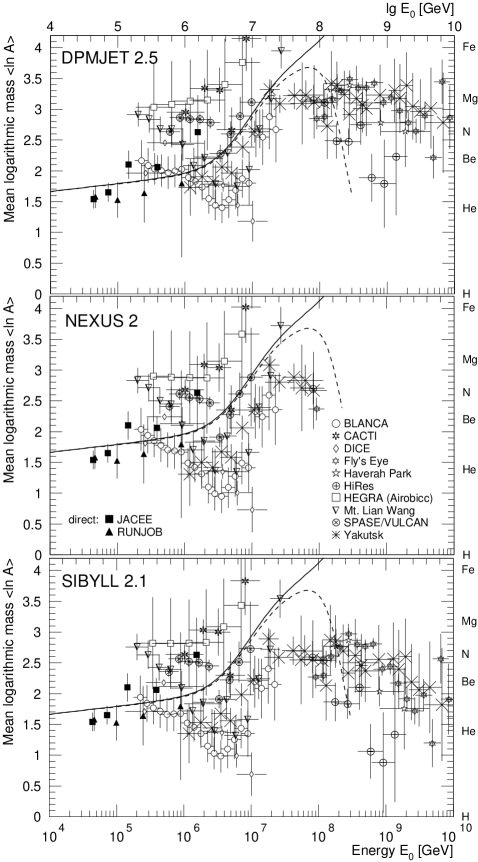
In addition to the modifications of QGSJET, it would be interesting to look at the mean mass which is deduced from the measurements applying other models. values for the models DPMJET, NEXUS, and SIBYLL have been presented in figure 10. Taking these predictions the experimental results lead to mean logarithmic masses shown in figure 14. At 4 PeV the average mass values range from for SIBYLL and NEXUS to for DPMJET. For NEXUS the authors of the model guarantee validity up to GeV, as mentioned above, for this reason is shown up to this energy only. As can be inferred from figure 10, very similar depths are obtained for the models NEXUS and SIBYLL, both are hardly discernable from model 2. As a consequence, the mean logarithmic masses derived are very much alike. On the other hand, the depths predicted by DPMJET are very similar to the results of model 3a and for both models a heavier mass composition is obtained. For the program MOCCA with its internal interaction model the showers penetrate extremely deep into the atmosphere and a relative heavy mass composition is obtained, not compatible with direct measurements (Hörandel 2003).
At knee energies the average experimental values vary from 1.2 when the data are interpreted with the original QGSJET (model 1) to 2.0 for a DPMJET interpretation. One has to admit that the model ambiguities result in an uncertainty . At this energy the scatter in the measured average depth of the shower maximum, as presented in figure 9, yields a rms value of the individual experimental results in the order of . This value is compatible with obtained for experiments measuring particle distributions at ground level, as discussed elsewhere (Hörandel 2003).
Also other authors have studied the effects of different interaction models on . The systematic influence of the models HDPM, QGSJET, SIBYLL, and VENUS on the results of the BLANCA experiment is discussed by Fowler et al(2001). At knee energies a maximum offset between QGSJET and SIBYLL as well as HDPM is obtained. The investigations of Wibig (2001) yield a maximum difference between VENUS and SIBYLL. Comparing results from QGSJET 98 and SIBYLL 1.6 an uncertainty of is found by Swordy et al(2002) at knee energies. Investigations of several hadronic observables by the KASCADE group yield model ambiguities of around the knee (Hörandel et al1998). These estimates from the literature seem to be well compatible with the ambiguities determined above.
As already mentioned in the introduction, the mean logarithmic mass as obtained with experiments investigating particle distributions at ground level is compatible with the results of the poly-gonato model. But these results disagree with values obtained from measurements of the longitudinal shower development interpreted with QGSJET 01. This incompatibility can be seen in figure 12, as well as for the models NEXUS 2 and SIBYLL 2.1 presented in figure 14. For several experiments the mean logarithmic mass decreases as function of energy up to knee energies, a tendency not supported by the extrapolation of the direct measurements. This effect is strongest for QGSJET 01.
Using lower cross-sections and larger values for the elasticity in the model QGSJET the values obtained are comparable with the results of experiments investigating particle distributions. In other words, the disagreement between the two groups of experiments can be reduced, if model 3a is taken. With the altered inelastic cross-sections and the larger elasticity consistency can be achieved between the predictions of the poly-gonato model and the mass composition derived from observed values. Similar values of as for model 3a are also obtained using DPMJET 2.5 to interpret the data. The main conclusion of the present investigation is that relatively deep penetrating showers with values similar to the ones obtained with model 3a or DPMJET 2.5 seem to yield most consistent values. On the other hand, investigations of secondary particles produced in air showers by Milke et al(2001), based on CORSIKA simulations with the low energy model GHEISHA, reveal that for a given number of muons DPMJET 2.5 transports more hadronic energy to the observation level as compared with the measurements of the KASCADE experiment. Hence, presently model 3a is the preferred model to describe air shower measurements most consistently.
6 Number of electrons and muons
The modified cross-sections and elasticity values influence not only the average depth of the shower maximum but also other air shower observables. The implications on shower sizes at ground level might be strong and, therefore, are investigated in the following. Many air shower arrays use the correlation between the number of electrons and the number of muons to determine the cosmic-ray mass composition. For showers with primary energies between and GeV the average number of muons with energies above 100 MeV is plotted versus the average number of electrons with energies above 0.25 MeV in figure 15 (left-hand side). Correlations from CORSIKA/QGSJET simulations for proton and iron induced showers are shown, using the original QGSJET 01 and model 3a. The first impression is, no significant differences between the two models can be found and, consequently, no significant changes in the mass composition derived are expected.

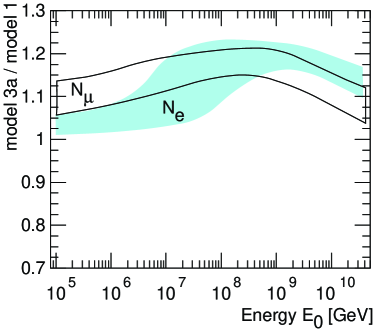
A closer look, when investigating the relative changes for the numbers obtained reveals small deviations. The number of electrons and muons obtained with model 3a normalized to the results of the original QGSJET model are shown on the right-hand side of the figure. At energies of the knee (4 PeV) the number of electrons increases by about 5% when using model 3a for both primaries, protons and iron nuclei. The increase in the number of muons amounts to about 15%. This outcome may qualitatively explain the need to accommodate the energy scales of many air shower experiments with respect to direct measurements as outlined in the introduction. It has been found that at knee energies air shower experiments overestimate the energy on average by about 3%. This can be understood, if the interaction models predict too small electron and muon numbers, since these quantities are mostly used by experiments to estimate the primary energy. In fact, the change in electron and muon numbers from models 1 to 3a corresponds to an energy uncertainty of about 5% and 15%, respectively. These numbers depend on the threshold for electrons as well as muons and differ from experiment to experiment. A quantitative investigation for each experiment would require detailed detector simulations. However, the numbers indicate that the observed energy overestimation of air shower experiments relative to direct measurements may be explained by too high inelastic cross-sections and too low values for the elasticity.
At higher energies around GeV the number of both, electrons and muons, generated by model 3a is increased by about 15% to 20% as compared with the original QGSJET (model 1). The changes in and correspond to energy shifts in the order of 10% to 20%. In this energy region the air shower experiments overestimate the primary energy on average by about 10% according to the above mentioned investigations. This value is comparable with the systematic offset between models 1 and 3a. Again, the exact numbers depend on individual detection thresholds for each experiment. These findings are an independent hint for a slower logarithmic rise of the inelastic cross-sections as well as slightly increased elasticities and, consequently, deeper penetrating cascades as presumed so far.
It may be summarized that differences between the models shift the data points parallel to the lines on the left-hand side of figure 15 (i.e. in ”energy direction”) and not perpendicular (i.e. in ”mass direction”), hence only a change in energy and no significant change in the mass composition derived from the data are expected. More detailed investigations are necessary to study the implications of the modifications on observables, performing detector simulations for individual experiments, but this is beyond the scope of the present article. In addition, to interpret experimental data not only high-energy interaction models as discussed presently are important, but also models to describe interactions below 100 GeV, as for example GHEISHA, FLUKA, or UrQMD, all available in CORSIKA. For a final conclusion, the complex interplay between low and high-energy models as well as their influence on observables measured in ground arrays has to be studied.
7 Summary and conclusion
The impact of reduced inelastic cross-sections and increased values for the elasticity on the development of extensive air showers has been studied with the simulation program CORSIKA. Within the high-energy hadronic interaction model QGSJET the logarithmic increase of the inelastic cross-sections as function of energy has been lowered and the elasticity has been increased. The average depth of the shower maximum was calculated for primary protons and iron nuclei and compared with experimental values. The mean logarithmic mass was derived from the experimental data for three assumptions for the increase of the inelastic cross-sections and two hypotheses for the elasticity.
The disagreement in the observed values between experiments measuring particle distributions at ground level and experiments measuring the average depth of the shower maximum could be reduced. The data exhibit still a scattering in the order of but the general trend of the increase as function of energy is now similar for both classes. A reduced and only modest increase of the cross-sections as function of energy had to be applied. Best agreement is obtained for model 3a with an increase of the total inelastic proton-proton cross-section to 72 mb at GeV and an additional increase of the elasticity of about 10% to 15%. In turn, the increase of with energy according to the poly-gonato model becomes compatible with the two classes of experiments. As a result, model 3a allows a consistent description of the extrapolations of individual element spectra as obtained by direct measurements and the all-particle energy spectrum as well as the cosmic-ray mass composition obtained by most air shower experiments.
References
References
- [1] [] Abe F et al1990 Phys. Rev.D 41 2330
- [2] [] —–1994a Phys. Rev.D 50 5518
- [3] [] —–1994b Phys. Rev.D 50 5550
- [4] [] Abu-Zayyad T et al2000 Phys. Rev. Lett.84 4276
- [5] [] —–2001 Ap. J. 557 686
- [6] [] Aglietta M et al1997 Proc. 25th Int. Cosmic Ray Conf. (Durban) 6 37
- [7] [] Alexopoulos T et al1993 Phys. Rev.D 48 984
- [8] [] —–1998 Phys. Lett.B 435 453
- [9] [] Alvarez-Muñiz J et al2002a Phys. Rev.D 66 033011
- [10] [] —–2002b Phys. Rev.D 66 123004
- [11] [] Amos N A et al1990 Phys. Lett.B 243 158
- [12] [] —–1992 Phys. Rev. Lett.68 2433
- [13] [] Anchordoqui L A et al1999 Phys. Rev.D 59 094003
- [14] [] Anderson B et al1991 Z. Phys. C 50 405
- [15] [] Antoni T et al1999 J. Phys. G: Nucl. Part. Phys.25 2161
- [16] [] Apanasenko A V et al2001 Proc. 27th Int. Cosmic Ray Conf. (Hamburg) 5 1622
- [17] [] Arqueros F et al2000 Astron. & Astrophys. 359 682
- [18] [] Avila C et al1999 Phys. Lett.B 445 419
- [19] [] Baltrusaitis R M et al1984 Phys. Rev. Lett.52 1380
- [20] [] Bird D J et al1994 Ap. J. 424 491
- [21] [] Block M M et al1992 Phys. Rev.D 45 839
- [22] [] —–2000 Phys. Rev.D 62 077501
- [23] [] Bossard G et al2001 Phys. Rev.D 63 054030
- [24] [] Büttner C et al2001 Proc. 27th Int. Cosmic Ray Conf. (Hamburg) 1 153
- [25] [] Capdevielle et al1992 Report KfK 4998, Kernforschungszentrum Karlsruhe
- [26] [] Capdevielle J N and Attallah R 1995 J. Phys. G: Nucl. Part. Phys.21 121
- [27] [] Cha M et al2001 Proc. 27th Int. Cosmic Ray Conf. (Hamburg) 1 132
- [28] [] Dickinson J E et al1999 Proc. 26th Int. Cosmic Ray Conf. (Salt Lake City) 3 136
- [29] [] Drescher H J et al2001 Phys. Rep. 350 93
- [30] [] Dyakonov M N et al1990 Proc. 21st Int. Cosmic Ray Conf. (Adelaide) 9 252
- [31] [] —–1993 Proc. 23rd Int. Cosmic Ray Conf. (Calgary) 4 303
- [32] [] Engel R et al1998 Phys. Rev.D 58 014019
- [33] [] —–1999 Proc. 26th Int. Cosmic Ray Conf. (Salt Lake City) 1 415
- [34] [] Erlykin A D and Wolfendale A W 2002 Astropart. Phys. 18 151
- [35] [] Fletcher R S et al1994 Phys. Rev.D 50 5710
- [36] [] Frichter G M et al1997 Phys. Rev.D 56 3135
- [37] [] Fowler G N et al1987 Phys. Rev.D 35 870
- [38] [] Fowler J W et al2001 Astropart. Phys. 15 49
- [39] [] Gaisser T K and Halzen F 1987 Phys. Rev. Lett.54 1754
- [40] [] Gaisser T K et al1987 Phys. Rev.D 36 1350
- [41] [] —–1993 Phys. Rev.D 47 1919
- [42] [] Glauber R J and Matthiae G 1970 Nucl. Phys.B 21 135
- [43] [] Hagiwara K et al(Particle Data Group) 2002 Phys. Rev.D 66 010001
- [44] [] Hara T et al1983 Phys. Rev. Lett.50 2058
- [45] [] Heck D et al1998 Report FZKA 6019, Forschungszentrum Karlsruhe; and http://www-ik3.fzk.de/heck/corsika/
- [46] [] Hillas A M 1997 Nucl. Phys.B (Proc. Suppl.) 52B 29
- [47] [] Honda M et al1993 Phys. Rev. Lett.70 525
- [48] [] Hörandel J R et al1998 Proc. 16th European Cosmic Ray Symposium (Alcala de Henares) 579
- [49] [] Hörandel J R 2003 Astropart. Phys. 19 193
- [50] [] Huang J et al2003 Astropart. Phys. 18 637
- [51] [] Keilhauer B et al2003 Auger Technical Note GAP-2003-009
- [52] [] Kalmykov N N et al1995 Proc. 24th Int. Cosmic Ray Conf. (Rome) 1 123
- [53] [] —–1997 Nucl. Phys.B (Proc. Suppl.) 52B 17
- [54] [] Knapp J et al2003 Astropart. Phys. 19 77
- [55] [] Knurenko S P et al1999 Proc. 26th Int. Cosmic Ray Conf. (Salt Lake City) 1 372
- [56] [] —–2001 Proc. 27th Int. Cosmic Ray Conf. (Hamburg) 1 177
- [57] [] Kopeliovich B Z et al1989 Phys. Rev.D 39 769
- [58] [] Landau L D 1969 Men of Physics: L D Landau-II, edited by D ter Haar, Pergamon, New York, p 131
- [59] [] Mielke H H et al1994 J. Phys. G: Nucl. Part. Phys.20 637
- [60] [] Milke J et al2001 Proc. 27th Int. Cosmic Ray Conf. (Hamburg) 1 241
- [61] [] Pajares C et al2000 Astropart. Phys. 12 291
- [62] [] Paling A et al1997 Proc. 25th Int. Cosmic Ray Conf. (Durban) 5 253
- [63] [] Pryke C L 2001 Astropart. Phys. 14 319
- [64] [] Ranft J 1995 Phys. Rev.D 51 64
- [65] [] —–1999 Preprint hep-ph/9911213
- [66] [] Sciutto S J 1998 Auger technical note GAP-98-032; AIRES users guide and reference manual, available at http://www.fisica.unlp.edu.ar/auger/aires/eg_Aires.html
- [67] [] Shibata T 1999 Nucl. Phys.B (Proc. Suppl.) 75A 22
- [68] [] Swordy S P and Kieda D B 2000 Astropart. Phys. 13 137
- [69] [] Swordy S P et al2002 Astropart. Phys. 18 129
- [70] [] Watson A A 2000 Phys. Rep. 333 - 334 309
- [71] [] Werner K 1993 Phys. Rep. 232 87
- [72] [] Wibig T 1997 Phys. Rev.D 56 4350
- [73] [] —–1999 J. Phys. G: Nucl. Part. Phys.25 557
- [74] [] —–2001 J. Phys. G: Nucl. Part. Phys.27 1633
- [75] [] Wibig T and Sobczyńska D 1998 J. Phys. G: Nucl. Part. Phys.24 2037
- [76] [] Yodh G B et al1972 Phys. Rev. Lett.28 1005
- [77] [] —–1973 Phys. Rev.D 8 3233
- [78] [] —–1983 Phys. Rev.D 27 1183