Revealing the AGN in the Superantennae through L-band spectroscopy11affiliation: Based on observations collected at the European Southern Observatory, Chile (proposal ESO 69.A-0643)
Abstract
We present an L-band spectrum of the Ultraluminous Infrared Galaxy IRAS 19254-7245 (the Superantennae), obtained with VLT-ISAAC. The high signal to noise ratio allows a study of the main spectral features with unprecedented detail for an extragalactic source. We argue that the main energy source in the IR is an obscured AGN. This is indicated by the low equivalent width of the 3.3 m PAH feature, the broad absorption feature at 3.4 m, and the steep continuum at m (). The substructure of the 3.4 m absorption feature indicates that the absorption is due to hydrocarbon chains of 6-7 carbon atoms.
1 Introduction
Ultraluminous Infrared galaxies (L) have been extensively studied at all wavelengths from the radio to the hard X-rays, in order to unveil the energy source - starburst or Active Galactic Nucleus (AGN) - responsible for the huge infrared luminosity. Determining the AGN role in ULIRGs is fundamental to evaluate the contribution of accretion to the infrared background, and to have a complete view of the population of AGNs in the near Universe.
Several diagnostics have been proposed for this purpose. In the optical, the presence of high-ionization narrow emission lines is an indication of the presence of an AGN. However, it is difficult to estimate the contribution of the AGN to the total luminosity just from the optical emission lines. Hard X-rays are in principle a powerful tool. The ratio between X-ray and IR emission in starburst-dominated ULIRGs is expected to be , while in AGN-dominated ULIRGs the ratio is (Risaliti et al. 2000). However, if the AGN is covered by a column density NH higher than 1025 cm-2, the presence of the AGN and its total luminosity are hard to determine. In general, all these methods are useful when they can directly measure the AGN luminosity, but they fail in determining whether an AGN is present or not in case of a nondetection.
Mid-infrared spectroscopy provides a powerful way to disentangle the starburst and AGN contribution. Genzel et al. (1998) used the Polycyclic Aromatic Hydrocarbon (PAH) molecules emission lines as an indicator of starburst activity in ISO spectra of the brightest ULIRGs. Since PAH molecules are destroyed by the X-ray radiation emitted by AGNs, a high equivalent width (EW) of PAH lines is an indicator of the absence of a strong AGN. Genzel et al. (1998) used the EW of the PAH emission feature at m as main diagnostics, and concluded that most ULIRGs are starburst-dominated. Recently Imanishi & Dudley (2000) showed that ground-based telescopes can provide similarly good -or probably better- data for this kind of diagnostics. In particular, L-band spectroscopy of low redshift ULIRGs allows the direct measurement of the m PAH feature (indicator of starburst activity, similarly to the 7.7 m feature) and of the carbonaceous dust absorption dip at m (indication of an absorbed point source like an AGN). Most importantly, the L-band is wide enough for a correct estimate of the continuum level, needed to measure both the equivalent width of the PAH feature and the detection of the carbon dip. In this way Imanishi et al. (2001) and Imanishi & Maloney (2003) clearly discovered signatures of an AGN dominating the energy output in UGC 5101, which was previously classified as starburst-dominated using ISO spectra only.
The ULIRG IRAS 19254-7245 (the Superantennae, Mirabel, Lutz & Maza 1991) is optically classified as a Seyfert 2. ISO mid-infrared spectroscopy indicates the presence of an AGN in IRAS 19254-7245, but it does not provide a clear indication on which is the dominant energy source, the EW of the 7.7 m PAH feature being intermediate between typical AGN and typical starburst values (Genzel et al. 1998). Recently Charmandaris et al. (2002) classified the source as AGN-dominated, based on the same ISO data.
XMM-Newton data in the 2-10 keV band suggests that IRAS 19254-7245 is AGN-dominated (Braito et al. 2002). The X-ray spectrum suggests that the source is Compton-thick, i.e. the absorbing column density is higher than 1024 cm-2. The total luminosity of the AGN is estimated to be of the order or higher than 1044 ergs s-1. Berta et al. (2003) fitted the SED of IRAS 19254-7245 from the U to the mm-band, with a starburst+AGN model, estimating a contribution of the AGN to the bolometric luminosity of 40-50%.
Here we present an L-band spectrum of IRAS 19254-7245, obtained with the instrument ISAAC on the VLT as part of a mini-survey of bright ULIRGs. Thanks to the superb quality of both the telescope and the instrument, this is probably the best L-band spectrum of a ULIRG ever published, and shows the potentiality of ground-based L-band spectroscopy in the study of active and star forming galaxies.
2 Data reduction and analysis
IRAS 19254-7245 is a system consisting of two colliding spiral galaxies, at z=0.062. The separation of the two nuclei is 8.5” ( kpc111We assume H0=75 km s-1 Mpc-1.). The southern galaxy is classified as a Seyfert 2 (Mirabel et al. 1991), while the northern galaxy shows an optical spectrum typical of starbursts (Colina, Lipari & Macchetto 1991). At 2 m, the southern galaxy is brighter by 1 magnitude than the northern galaxy (Duc, Mirabel & Maza 1997). Images at 10 m show that the mid-IR emission is concentrated in the nuclei, and the southern one is more than 5 times brighter than the northern one. Finally, ISOCAM observations (Charmandaris et al. 2002) show that more than 90% of the 5-20 m emission is due to the southern source.
We performed 2 observations of IRAS 19254-7245 with ISAAC-VLT, on June 02, 2002, and on June 3, 2002. Each observation was 1 hour long. The two nights were photometric, and the seeing was around 1”. In the image acquired before the spectroscopic observation, we detected the two nuclei and we oriented the 1” slit in order to obtain spectra of both. However, the northern nucleus turned out to be too faint to obtain a useful spectrum. Therefore, we will not discuss it further.
The spectroscopic observations have been performed in “chopping” mode, with single exposures of 0.56 sec. The data were merged, flat-fielded and sky-subtracted using standard procedures in the IRAF package. A spectrum of the spectrophotometric standard star HIP 183 (B4III, L=5.5, Teff=15,800 k) was acquired in the same way for both observations, and used to obtain the instrumental response, in order to correct the source spectrum.
Since the calibration lamp lines were too faint to be useful, the wavelength calibration was performed using the nominal instrumental range and the wavelength of the carbon absorption features (as described in the next Section). Throughout this paper we always refer to rest frame wavelengths, unless otherwise stated.
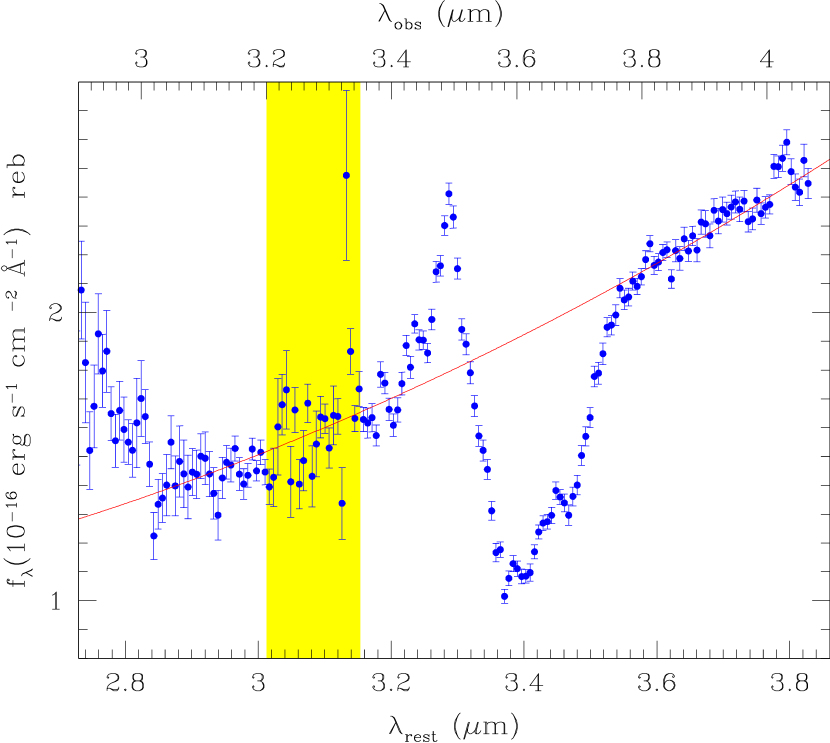
The absolute flux calibration has been obtained analyzing the profile of the star along the slit, and estimating the fraction of flux inside the slit, assuming a perfect centering. We estimate that this procedure has an error of the order of 10%. We checked that the two final spectra were consistent, and we finally merged the results of the two observations. The final spectrum, rebinned by a factor of 5, is shown in Fig. 1. The error bars are estimated from the Poissonian noise in the sky counts (which are by far the dominant source of noise).
3 Discussion
Previous optical and infrared observations indicated the presence of an AGN in the nucleus of IRAS 19254-7245, but the relative importance of the AGN and starburst components was not clear: the 7.7 m PAH feature detected by ISO (Genzel et al. 1998) has an intermediate strength (S=0.8, where S is the ratio between the peak 7.7 m flux and the continuum at the same wavelength) with respect to pure starbursts and pure AGN (S3.6 and S0.04 respectively, Genzel et al. 1998). However, the determination of the continuum level is highly uncertain in the ISOPHOT spectra, due to the presence of absorption features and the poor signal-to-noise ratio. In the optical and near-IR, the presence of an AGN is clearly revealed from the high [OIII]/H ratio and from the presence of strong coronal lines (Vanzi et al. 2002).
The ISAAC spectrum presented here is probably the highest S/N L-band spectrum of a ULIRG so far. Thanks to the high signal and to the moderately high spectral resolution, the starburst and AGN indicators can be studied with unprecedented detail.
The signatures of the AGN activity in the L-band spectrum of IRAS 19254-7245 are quite clear: 1) the deep absorption at m (rest frame) strongly suggesting the presence of a point source behind a screen of dusty gas; 2) the PAH feature at 3.3 m with a much lower equivalent width than typical starburst-dominated sources; 3) the rather steep continuum slope above m, suggesting the presence of warm, AGN-heated dust. We discuss each of these points in the following.
3.1 The absorption feature at 3.4 m
The broad absorption feature at m (rest frame) is present in the spectra of many AGNs and ULIRGs (Imanishi & Dudley 2000, Imanishi 2000). We clearly detected such feature in the spectrum of IRAS 19254-7245, with an optical depth . The absorption is believed to be due to C-H stretching vibration in hydrocarbon dust grains (Sandford et al. 1991 and references therein). Imanishi & Maloney (2003) showed that an optical depth of this feature higher than requires a centrally-concentrated source, i.e. an AGN, unless dust absorption in the host galaxy is significant. Indeed, absorption features at 3.4 m are commonly observed in AGNs (Imanishi 2000) while they are never found in galaxies known to be dominated by starburst.
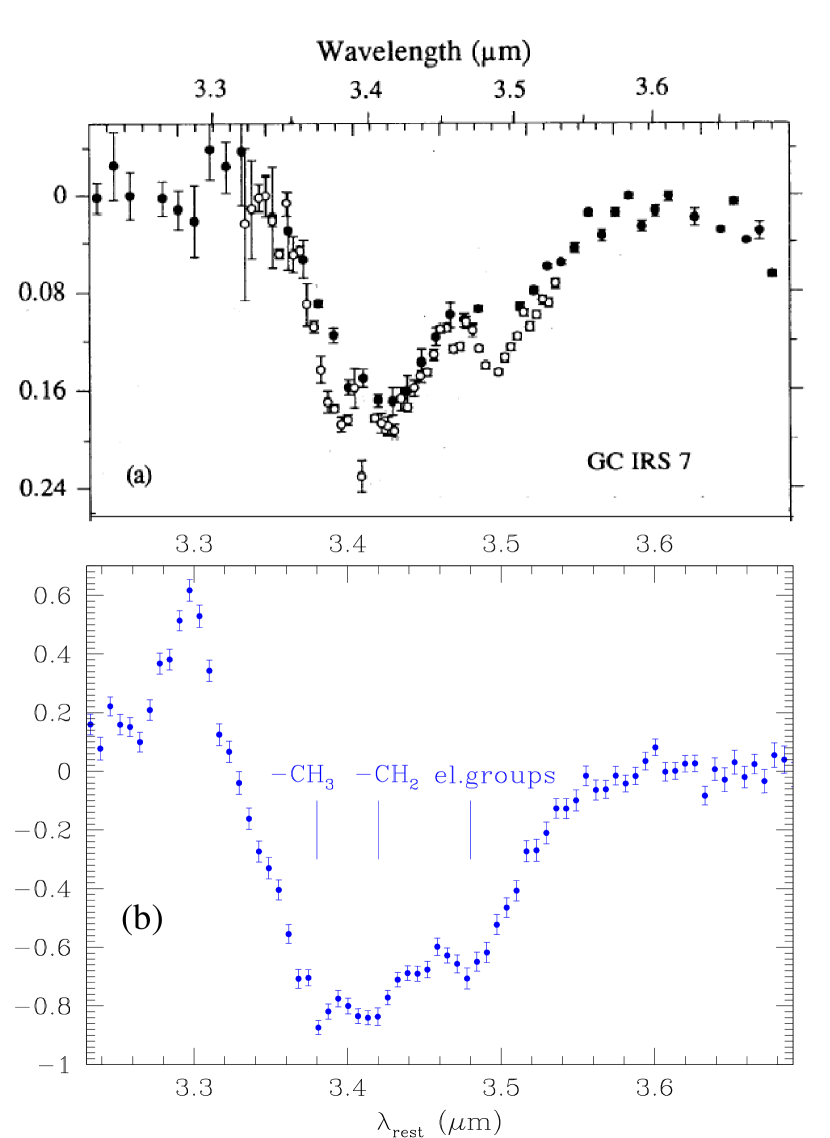
Since the same dust grains are present in the Galactic interstellar medium, the most detailed studies of the 3.4 m absorption have been done on Galactic center sources (Sandford et al. 1991, Pendelton et al. 1994). In these cases the high statistics available allows to resolve the substructure of the absorption feature in at least two major components, due to -CH2 and -CH3 groups, respectively. In Fig. 2b we plot the ratio between the observed spectrum and the continuum shown in Fig. 1, obtained with a polynomial fit of the regions with observed wavelengths in the ranges 2.9-3.1 m, 3.3-3.5 m, 3.8-4.1 m. A similar spectrum of the Galactic center source IRS7 from Pendelton et al. 1994 is plotted in Fig. 2a. The similarity between the two profiles is remarkable, and suggests a similar composition of the carbonaceous dust grains. A deblending of the single absorption components is quite uncertain: at least three components are present at rest frame wavelengths of 3.38, 3.42 and 3.485 m (Fig. 2). Moreover, the absorbed continuum is blended with the long wavelength tail of the PAH emission feature at 3.3 m.
A qualitative analysis is possible comparing our data with those of the source IRS 7. Following Sandford et al. (1991) the absorption features at 3.38 m and at 3.42 m are due to -CH3 and -CH2 groups, respectively, in saturated aliphatic hydrocarbons. The ratio between the two absorption peaks is an indication of the average length of hydrocarbon chains222The structure of a saturated hydrocarbon chain is CH3-(CH-CH3, therefore the ratio between the strength of -CH3 and -CH2 absorption features is a direct measure of .. Since the relative strength of the two features in IRAS 19254-7245 is compatible within the errors with those in IRS 7, the average ratio between -CH2 and -CH3 groups is the same, i.e. . This corresponds to relatively complex molecules made of 6-7 carbon atoms. The third absorption feature is due to the same C-H stretching vibrations, when the -CH2 and CH3 groups are perturbed by an electronegative group, such as -CN, -OH, or aromatic chains. The higher depth of this feature in IRAS 19254-7245 with respect to the Galactic source IRS 7 indicates that the absorbing medium in IRAS 19254-7245 is rich of organic molecules with such electronegative groups (see Fig. 7 in Sandford et al. 1991).
3.2 The emission feature at 3.3 m
The broad emission feature at 3.3 m is due to Polycyclic Aromathic Hydrocarbon molecules. It has been empirically shown that this emission feature is weak or absent in AGNs, while is strong in starbursts (Roche et al. 1991). This is probably due to the destruction of PAH molecules by the strong X-ray and EUV emission of AGNs, and to the dilution of the continuum stellar component . As a consequence, a low equivalent width (EW) of the 3.3 m emission feature is an indicator of AGN emission. Typical EW for starburst galaxies are in the range 1000-1500 Å (Moorwood 1986, Imanishi & Dudley 2000), while in AGN-dominated sources EW 100-300 Å (Imanishi 2002). The estimated value for IRAS 19254-7245 is EW=120 Å, suggesting that the emission is dominated by the active nucleus.
We emphasize that the broad spectral range is crucial for a correct estimate of the EW. In particular, if the continuum at rest-frame wavelengths m is not available, the line flux is easily over-estimated, while the continuum at 3.4 m is under-estimated because of the broad 3.4 m absorption feature. To illustrate this fact, we tried to fit the rest-frame 3.0-3.7 m spectrum with a simple power law and an emission line, and we obtained an equivalent width of 700 Å, in the range typical of starburst-dominated sources. Another possible source of uncertainty in the measurement of the 3.3 m feature EW is the overlap with the 3.4 m absorption feature. However, the 3.3 m emission line appears to be symmetric with respect its peak wavelength (which is exactly at 3.3 m), and the absorption feature in the comparison source in Fig. 2a does not extend below m. We conclude that the 3.3 m PAH feature is not significantly affected by the absorption at 3.4 m.
It is possible to use the measurement of the 3.3 PAH line to estimate the AGN/starburst contribution to the infrared emission. An interesting indicator is the ratio between the flux of the 3.3 m feature, , and the total far infrared flux,FIR, as estimated from the four IRAS filters (Sanders & Mirabel 1996). The typical value for starburst galaxies is , while in AGN-dominated sources is more than 1-2 orders of magnitude lower (Imanishi 2002). For IRAS 19254-7245 we have F erg cm-2 s-1 and F erg cm-2 s-1. As a consequence, . This indicator suggests that the detected starburst can account for only a small fraction of the infrared luminosity of IRAS 19254-7245.
A direct way to obtain a rough quantitative estimate of the AGN contribution to the infrared luminosity is to subtract a starburst template from the L-band spectrum, and then compare the L-band flux with the total Far Infrared flux as measured by IRAS. We expect that in case of AGN dominance these two fluxes are equal. We assumed that the PAH emission is entirely due to the starburst, and that the starburst continuum is reproduced by a flat (const) spectrum normalized in order to have EW3.3μm=1000 Å(in agreement with starburst spectra in Imanishi & Dudley 2000). The resulting “pure AGN” spectrum is steeper (, with and erg s-1 cm-2. Assuming the Galactic extinction curve of Pendelton et al. 1994 (, , where is the extinction in the L-band), we obtain . Correcting the observed 3 m flux for this extinction we end up with . This result is an indication that the AGN is dominant in the IR, and that the extinction curve in the Superantennae is probably quite different from the Galactic one.
3.3 Continuum slope
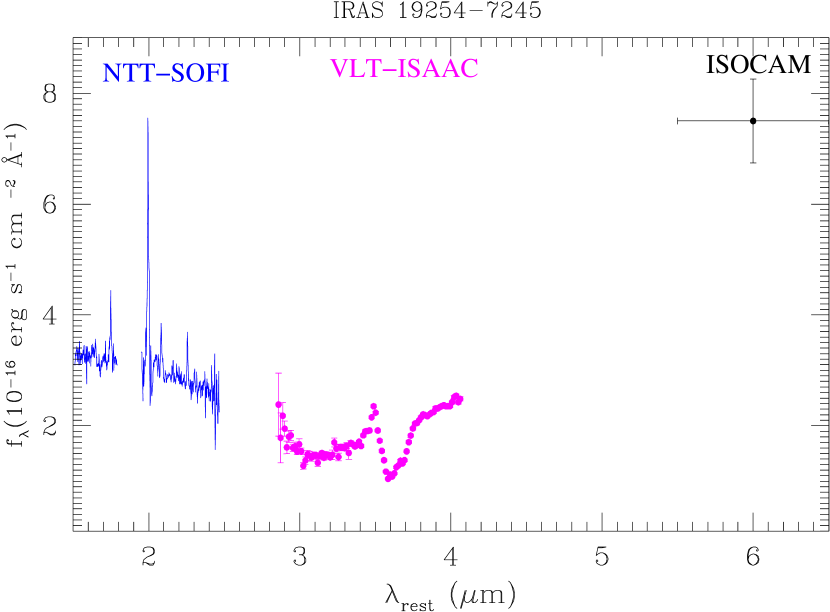
The slope of the continuum at wavelengths m is rather steep (). This suggests a strong emission by warm dust, typical of AGN spectra (Granato, Danese & Francecshini 1997). Interestingly, analyzing the 3-4 m spectra of ULIRGs available in the literature we note that a positive slope in the 3.5-4.0 m continuum is only found in AGN-dominated sources. The opposite is not true: a few sources exist (MKN 231, NGC 6240) with negative 3.5-4.0 m slope, which are known to host a powerful AGN from observations at other wavelengths. This issue will be discussed in further detail in a forthcoming paper (Risaliti et al. 2003, in preparation). At m an inversion of the slope is clearly seen. In Fig. 3 we plot the L-band spectrum with the near-IR spectrum obtained at the NTT (Vanzi et al. 2002) and the ISOCAM point at 6 m (Laurent et al. 2000). The extrapolation of the continuum matches well both the K spectrum and the 6 m point. This shows that the three observations are well cross-calibrated, and our flux calibration error is lower than 5%.
The minimum in the L-band spectrum, at 3.1 m is the absolute minimum in the optical-infrared spectrum of IRAS 19254-7245. At shorter wavelengths the emission is dominated by radiation from the host galaxy, since the AGN is highly obscured-, while at longer wavelengths the radiation is mainly due to the reprocessing of the AGN direct emission. Imanishi & Maloney (2003) detected a broad absorption feature at 3.1 m in several ULIRGs, due to ice-covered dust grains. In principle we cannot exclude that the minimum observed at 3.1 m is partly due to this effect. However, we note that if a significant fraction of carbonaceous dust grains are covered by ice, they do not contribute to the 3.4 m absorption. This would imply that the optical extinction for a given is even higher than that assumed in Sect. 3.2. If this is the case, the correction to the observed 3 m continuum would also be higher, worsening the problem of the too high 3 m flux compared with the FIR emission.
4 Conclusions
We presented a high signal-to-noise L-band spectrum of
the ultra-luminous infrared galaxy IRAS 19254-7245.
The signatures of a powerful AGN dominating the energy output in the infrared
are clear:
The broad absorption feature at m, suggests
the presence of a powerful point source. The substructure of this feature shows
that the absorption is due to hydrocarbon molecules consisting of chains of 6-7 carbon atoms,
rich in electronegative groups, as -CN, -OH.
The EW of the PAH emission feature at 3.3 m, when the continuum is
correctly estimated taking into account the broad absorption at 3.4 m, is
typical of AGN-dominated sources.
The continuum at m is rather steep, indicating the
presence of hot dust.
The above conclusions show the potential of high signal-to-noise L-band
spectroscopic observations with VLT-ISAAC. We are now completing
a work in which we extend the present study to a sample of 6 more bright
ULIRGs of the Genzel et al. (1998) sample (Risaliti et al. 2003, in
preparation).
References
- (1) Berta, S., et al. 2003, A&A, submitted
- (2) Braito, V., et al. 2003, A&A, 398, 107
- Colina, Lipari, & Macchetto (1991) Colina, L., Lipari, S., & Macchetto, F. 1991, ApJ, 379, 113
- (4) Charmandaris, V., et al. 2002, A&A, 391, 429
- Duc, Mirabel, & Maza (1997) Duc, P.-A., Mirabel, I. F., & Maza, J. 1997, A&AS, 124, 533
- (6) Genzel, R., et al. 1998, ApJ, 498, 579
- (7) Granato, G.L., Danese, L., & Franceschini, A. 1997, ApJ, 486, 147
- (8) Imanishi, M. 2000, MNRAS, 319, 331
- (9) Imanishi, M., & Dudley, C.C. 2000, ApJ, 545, 701
- (10) Imanishi, M., Dudley, C. C., & Maloney, P. R. 2001, ApJ, 558, L93
- (11) Imanishi, M. 2002, ApJ, 569, 44
- (12) Imanishi, M. & Maloney, P. R. 2003, ApJ, 588, 165
- (13) Laurent, O., et al. 2000, A&A, 359, 887
- (14) Mirabel, I.F., Lutz, D., Maza, J., 1991, A&A, 243, 367
- Moorwood (1986) Moorwood, A. F. M. 1986, A&A, 166, 4
- (16) Pendleton, Y.J., Sandford, S.A., Allamandola, L.J., Tielens, A.G.G.M., & Sellgren, K. 1994, ApJ, 437, 683
- (17) Risaliti, G., Gilli, R., Maiolino, R., & Salvati, M. 2000, A&A, 357, 13
- (18) Roche, P. F., Aitken, D. K., Smith, C. H., & Ward, M. 1991, MNRAS, 248, 606
- Sanders & Mirabel (1996) Sanders, D. B. & Mirabel, I. F. 1996, ARA&A, 34, 749
- (20) Sandford, S.A., Allamandola, L.J., Tielens, A.G.G.M., Sellgren, K., Tapia, M., & Pendleton, Y.J. 1991, ApJ, 371, 607
- (21) Vanzi, L., Bagnulo, S., Le Floc’h, E., Maiolino, R., Pompei, E., & Walsh, W. 2002, A&A, 386, 464