A Characteristic Dense Environment or Wind Signature in Prompt GRB Afterglows
Abstract
We discuss the effects of synchrotron self-absorption in the prompt emission from the reverse shock of GRB afterglows in a dense environment, such as the wind of a stellar progenitor or a dense ISM in early galaxies. We point out that, when synchrotron losses dominate over inverse Compton losses, the higher self-absorption frequency in a dense environment implies a bump in the reverse shock emission spectrum, which can result in a more complex optical/IR light curve than previously thought. This bump is prominent especially if the burst ejecta is highly magnetized. In the opposite case of low magnetization, inverse Compton losses lead to a prompt X-ray flare. These effects give a possible new diagnostic for the magnetic energy density in the fireball, and for the presence of a dense environment.
1 Introduction
Snapshot fits of the broadband spectrum of gamma-ray burst (GRB) afterglows to standard forward shock models have been found, in many cases, to be consistent with an external environment density cm-3 typical of a dilute interstellar medium (ISM) which, to first order, can be taken to be approximately independent of distance from the burst (Frail et al 2001). In other cases, the forward shock is better fitted with an external density which depends on distance as , typical of a stellar wind environment (Chevalier & Li 1999, 2000; Li & Chevalier 2003). The two types of fits have been critically analyzed by e.g., Panaitescu and Kumar (2002), the conclusion being that at least some bursts may occur in high mass-loss winds, as expected from massive progenitors. The parameters for such wind fits are uncertain, due to poorly known stellar mass loss rates.
In this Letter we show that observations of prompt optical/IR and/or X-ray emission attributable to reverse shock emission could constrain the GRB environment. The reverse shock emission tends to be in the regime where the electron cooling time is shorter than the dynamical expansion time. In high density environments, such as a stellar progenitor wind or a dense ISM in early galaxies, the self-absorption (SA) frequency is much higher than in the normal ISM, and it could be higher than the typical injection peak frequency (Wu et al. 2003). Here we argue, from general radiative transfer considerations, that in such situations when the emission is in the fast cooling regime and the SA frequency is higher than the injection frequency, the SA frequency and its scaling are different from, and the flux at the SA frequency is appreciably larger than, what had been previously estimated. This implies a different light curve time behavior for the afterglow prompt flash in a dense environment. This is of significant interest, since observations of the SA frequency and the net flux could provide constraints on the otherwise poorly known wind mass-loss rates of progenitors stars, or on the presence of a dense ISM. These new features are expected to be pronounced if the inverse Compton process does not play a dominant role. This could happen in the case of highly magnetized fireball ejecta, whose presence has been suggested by some recent studies (Zhang, Kobayashi & Mészáros 2003; Kumar & Panaitescu 2003) and by reports of high gamma-ray polarization (Coburn & Boggs 2003). The strength of the SA features would then provide a constraint on the magnetization parameter.
2 The Model
We consider a relativistic shell (fireball ejecta) with an isotropic energy , an initial Lorentz factor and an initial width expanding into a surrounding medium with a density distribution . The shell width is related to the intrinsic duration of the GRB as (Kobayashi, Piran & Sari 1997) where is the redshift of the burst. The interaction between the shell and the wind is described by two shocks: a forward shock propagating into the wind and a reverse shock propagating into the shell. The shocks accelerate electrons in the shell and in the wind material, and the electrons emit photons via synchrotron process.
The evolution of the reverse shocks can be classified into two cases depending on the value of the initial bulk Lorentz factor relative to a critical value (Sari & Piran 1995; Kobayashi & Zhang 2003b). If (thick-shell case), the reverse shock starts out relativistic and it significantly decelerates the shell material, to . If (thin-shell case), the reverse shock is initially Newtonian and becomes only mildly relativistic traversing the shell. Most bursts in a wind environment fall in the thick-shell class, (), because the high density implies a critical Lorentz factor lower than the typical value in fireball models (e.g., Lithwick & Sari 2001), where , ergs, the duration sec, and g cm-1 is a typical wind mass loss rate. We are especially interested in long bursts with minute, for the purpose of analyzing the light curve behavior of the reverse shock emission. We focus on the thick-shell case, for which one can take the shock crossing time and the bulk Lorentz factor during the shock crossing () is .
If we neglect synchrotron self-absorption (which is discussed in the next section) the spectrum of the reverse shock is described by a broken power law with a peak and two break frequencies: a typical frequency and a cooling frequency (Sari, Piran & Narayan 1998). Assuming that constant fractions ( and ) of the internal energy produced by the shock go into the electrons and the magnetic field, the reverse shock spectrum at a shock crossing time is characterized by (Kobayashi & Zhang 2003b),
| (1) | |||||
| (2) | |||||
| (3) |
where , , , cm), is the luminosity distance of the burst, and cm for the standard cosmological parameters (, and ). The value of assumed for the reverse shock emission are larger (smaller) than in some previous broadband fits of afterglow forward shocks (e.g. Wijers & Galama 1999; Panaitescu & Kumar 2001). However, the values of the equipartition parameters can in principle differ in the forward and reverse shock regions, and as shown recently, in the reverse (fireball ejecta) shock could be much higher than in the forward shock (Zhang, Kobayashi & Mészáros 2003; Kumar & Panaitescu 2003).
3 Self-absorption and O/IR reverse flash
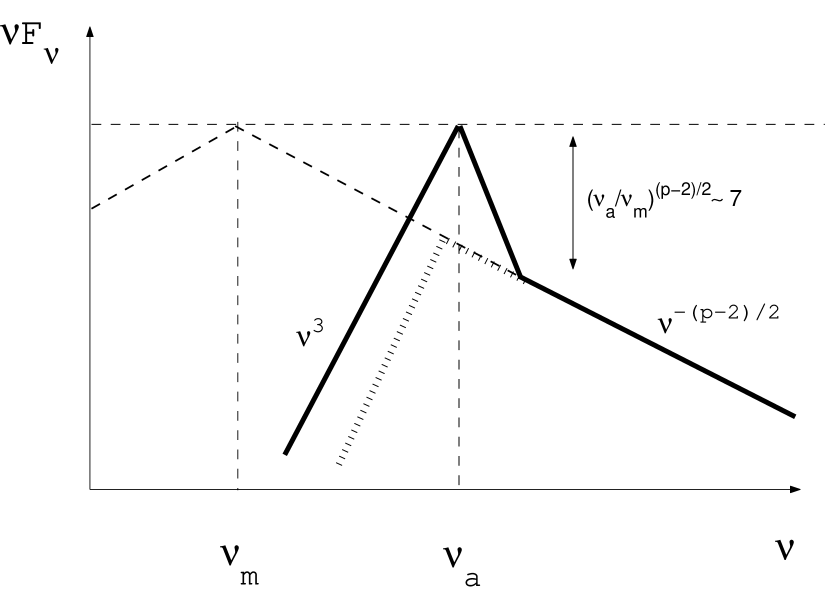
In a stellar wind the external density at the initial interaction with the shell is much larger than in the typical ISM, hence the cooling frequency is lower than the typical peak frequency , and the synchrotron self-absorption (SA) frequency can be much higher than : . As suggested by some recent work (Zhang, Kobayashi & Mészáros 2003; Kumar & Panaitescu 2003; Coburn & Boggs 2003), the fireball ejecta could be highly magnetized. In such cases the condition can lead to a Compton parameter and the inverse Compton process is not important for electron cooling (the opposite case is discussed below). A consequence of the synchrotron dominance is that self-absorption suppresses the emission below the SA frequency , and prevents the electrons from cooling down to the Lorentz factor corresponding to the cooling frequency . The suppressed radiation energy is partly redistributed among the electrons, and results in a distinctive hump in the spectrum of the reverse shock emission.
The reverse shock injects electrons with a power law energy distribution . The energy deposited in electrons with Lorentz factors between and is where is the number of electrons in the shell, is the Lorentz factor corresponding to the SA frequency, and we assumed and (so is essentially the total electron energy). This energy is redistributed among the electrons and photons in the optically thick regime on a timescale comparable to the cooling time (Ghisellini & Svensson 1989). Since the reverse shock is in the fast cooling regime , the electrons have enough time to redistribute the energy. In a dynamical time, the energy is radiated as photons around . Assuming , the flux at is given by
| (4) |
A simple estimate of the maximal self-absorption flux is given by a black body flux with the reverse shock temperature (e.g. Sari & Piran 1999; Chevalier & Li 2000), where is the observed size of the shell. Equating , we obtain the SA frequency
| (5) |
An alternative derivation of the SA frequency is obtained by requiring the electron synchrotron cooling rate and heating rate (through absorption) to be equal at . The cross section for the synchrotron absorption process is approximately (e.g. Ghisellini & Svensson 1991) where and are the classical electron radius and the Larmor radius, is electron charge, is comoving magnetic field strength behind the shock. Using this cross section and the photon flux determined by eq. (4), we can evaluate the heating rate, while the cooling rate is given by the electron synchrotron power. Equating these rates reproduces the SA frequency of eq. (5).
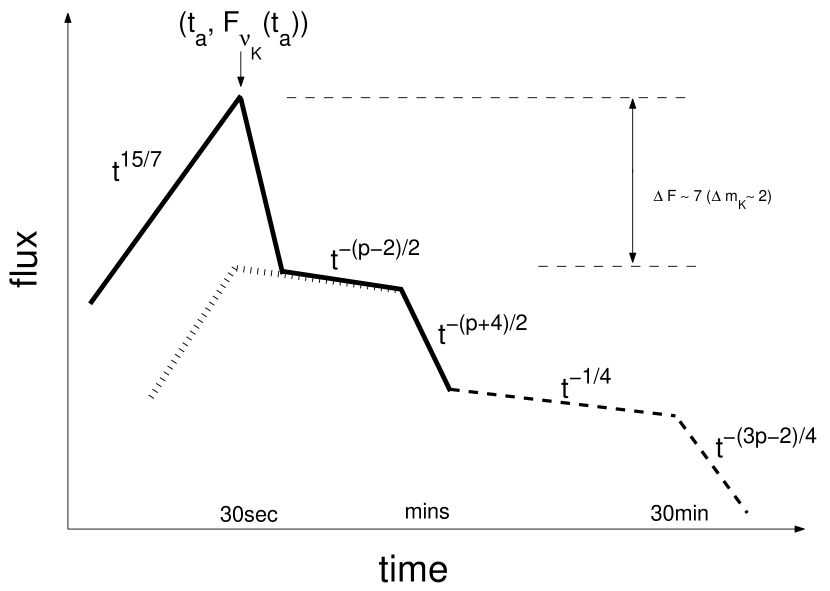
Following Kobayashi & Zhang (2003b), we obtain the scalings at of the spectral quantities . Although itself is not observed, as a result of the self-absorption, the flux at can be still estimated from these scalings, because the electron distribution producing some observed frequency (say in the K-band ) (and frequencies above this) is determined by the distribution of injected electrons at the shock, and by the synchrotron radiation cooling. Therefore, even though the flux at has a hump which was previously unaccounted for, we can apply the conventional synchrotron model to estimate the light curve at a frequency . The optical/IR luminosity initially increases as . When the SA frequency passes through the observation band at , the flux reaches a peak of and then it rapidly decreases. For electrons in the hump which are quasi-thermally distributed, the flux beyond the peak would decrease (or, if the emission of the quasi-thermal electrons above the peak is fitted by a power law above the SA frequency, the decrease is ), the flux dropping by a factor . The time of the absorption peak passage through the K-band, the peak flux and the peak flux contrast relative to the subsequent power-law decay value are given by
| (6) | |||||
| (7) | |||||
| (8) |
where and was assumed. At this turnover, a color change from blue to red is expected (see fig 1). Since the polarization is zero for an optically thick quasi-thermal spectrum, the reverse shock shell can emit polarized photons only above the turnover. If a turnover characterized by is observed, we can constrain the mass loss rate , assuming that the redshift is measured and the GRB explosion energy is determined, e.g. from late time bolometric afterglow observations. The peak flux determines the equipartition parameter via eq. (7), and the peak time gives through eq. (6) a constraint on the mass loss rate,
| (9) |
where the dependence on the parameter is weak.
After the optical/IR reverse shock emission drops to the level expected from the usual synchrotron model, the flux decreases slowly as . Beyond a timescale comparable to the burst duration , the optical/IR emission fades rapidly, because no further electrons are shocked in the shell (allowing the initially weaker but longer lasting forward shock to gradually dominate). The angular time delay effect prevents the abrupt disappearance of the reverse component, whose flux decreases steeply as (Kumar & Panaitescu 2000; Kobayashi & Zhang 2003b). No color change is expected around this break. The flux at this break for is
| (10) |
These two breaks are schematically shown in Fig. 2, the break sharpness being an idealization; in reality these would be rounded. In our treatment, we have ignored pair formation ahead of the blast wave, e.g. Beloborodov (2002), which may modify the forward shock spectrum and light curve.
4 IC effects and prompt reverse X-ray flash
The above discussion assumed magnetized ejecta with and . However, for weaker ejecta magnetization with , the inverse Compton (IC) process can affect the observed spectrum and the light curve, resulting in a reverse shock prompt X-ray flare. (For forward shocks, the importance of IC emission has been discussed, e.g. by Sari & Esin 2001; Panaitescu & Kumar 2001). Although the fraction of photons scattered to higher energies is small, they carry away a majority of the electron energy. The energy available for the synchrotron process is reduced from the injected energy by a factor of where is the Compton parameter (e.g. Zhang & Mészáros 2001). The IC process enhances the electron cooling, so is smaller by a factor of than its previous (synchrotron only) value. The thermal bump is shifted to a lower frequency, becoming less prominent or even disappearing. As a consequence of the IC cooling, the flux at becomes smaller by a factor of than the value given by eq. (4). If is shifted below , most of the energy available for the synchrotron process is radiated between and . The flux at is reduced from eq. (4) by a factor of . By equating the flux at and the black body flux at the reverse shock characteristic temperature , we can obtain the SA frequency. For the same parameters as for eq. (4) but taking and , we get Hz and Hz. To produce a significant bump, the SA frequency should be much higher than the typical frequency . When , as in this case, the contrast is and the bump practically disappears. The optical/IR light curve initially increases as , and after crosses the observation band, it decreases as . The transition is expected to be gradual and smooth.
Since at the shock crossing time the forward and reverse shocked regions have roughly comparable energy, the peaks of the synchrotron emissions reach roughly similar levels. Assuming that the characteristic reverse shock IC frequency is close to the typical (peak) frequency of the forward shock synchrotron emission, we can infer that in the case of the reverse shock IC component is generally masked by the forward shock synchrotron emission, whereas in the case of the reverse shock IC peak sticks out above the forward shock synchrotron peak. Therefore, for weakly magnetized fireballs (with ), a prompt X-ray flare is expected from the reverse shock. The characteristic photon energy and the flux at this frequency are keV and , respectively. The typical duration of this X-ray flare at is of order the shock crossing time s. After the reverse shock crosses the shell, electrons are no longer heated and the (on-axis) synchrotron flux at drops, as does the the IC emission at , and one starts to observe high latitude emission. The X-ray emission from the reverse shock decays steeply as , whereas the forward shock emission decays . Thus the slower decaying forward shock component eventually starts to dominate.
5 Dense ISM in Early Galaxies
We consider a specific model in which the ISM density of early galaxies scales with redshift as cm-3 (e.g. Ciardi & Loeb, 2000). In this case (or in general when the ISM density is much larger than a typical cm-3 at ), a discussion analogous to that of the previous section can also lead to a bump in the reverse shock spectrum and in the optical/IR light curve.
The critical Lorentz factor classifying the evolution of the reverse shock is given by (e.g. Kobayashi 2000) where and sec. A large fraction of GRBs are expected to be classified as thick shell cases, whose spectral quantities are given by (Kobayashi & Zhang 2003a) Hz, Hz and Jy, where is the normalized luminosity distance and . Equating , we obtain Hz. Using the scalings by Kobayashi (2000), one can show that during the shock crossing. The optical/IR light curve initially increases as . When passes through the K-band at sec, the flux reaches a peak of Jy, and then it rapidly decreases by a (bump contrast) factor of (). After the emission drops to the level expected from the usual synchrotron model, the flux keeps a constant level, and then it rapidly fades as after a time comparable to the burst duration.
6 Discussion and Conclusions
We have analyzed the prompt afterglow emission from the reverse shocks of GRBs occurring in dense environments, such as the stellar wind of a massive progenitor, or a dense ISM as might be expected in early galaxies. Usually in the fast cooling case, the flux is normalized at the typical frequency by using the energy ejected into electrons. However, here we point out that if the synchrotron self absorption frequency is higher than the typical frequency (and ), this usual prescription should be inapplicable for estimating the flux at and below . Such conditions can occur in the reverse shock of a highly magnetized fireball in a dense environment. The radiation flux suppressed by the self absorption effect is redistributed among the electrons and photons in the optically thick regime, and most of it is emitted at in a dynamical time. As a result, the self-absorption frequency is different and scales differently with the shock parameters, and the flux at the self-absorption frequency shows a bump which is a factor several) above the usual power law flux estimate for typical parameters. The flux well above is the same as before, but the flux below is larger by the same factor . This results in a new type of temporal behavior for the prompt optical flash of afterglows from fireballs in dense (e.g. wind or early galaxy) environments. These new features will be prominent when the inverse Compton process is not important for electron cooling, i.e. for ejecta with . This may be the case in fireball ejecta which are highly magnetized, as suggested by some recent studies. If, on the other hand, the burst occurs in a dense environment and such features are absent, this may be an indication that , and in this case a prompt reverse shock X-ray flare is expected, which for a brief time dominates the forward shock but decays faster than it.
Massive stars appear implicated in producing long gamma-ray bursts (as seen from the detection of a supernova associated with GRB 030329, e.g., Stanek et al 2003). Wind mass loss is expected from such stars previous to the GRB explosion, but snapshot fits to forward shock late emission (e.g., Panaitescu & Kumar, 2002) are compatible with such wind mass loss in only a handful of cases. In general the parameters of stellar winds are poorly known, and the uncertainties are further increased at high redshifts, where massive stars are expected to be metal poor. For this reason, signatures of a wind mass loss or a dense environment would be extremely valuable, both for GRB astrophysics and for tracing the properties of star formation at high redshifts. The prompt optical flashes expected after tens of seconds from the reverse shock in a dense environment would give characteristic signatures in the spectral and temporal behavior. These may help to test for the presence of winds and constrain the wind mass loss, in moderate redshift environment, or alternatively, at high redshifts they may provide evidence for a denser ISM than at low redshifts. In such winds or dense ISM the spectra and light curve time behavior can also give constraints on the strength of the magnetic field in the ejecta. Large numbers of prompt X-ray detections with future missions such as Swift, complemented by ground-based follow-ups, should be able to test for such wind or dense ISM signatures and trace any changes with redshifts, if they exist, thus constraining the GRB environment as well as the radiation mechanisms.
We thank M.J. Rees, J. Granot, A. Beloborodov and the referee for valuable comments. This work is supported by NASA NAG5-13286, NSF AST 0098416, the Monell Foundation and the Pennsylvania State University Center for Gravitational Wave Physics, funded under cooperative agreement by NSF PHY 01-14375.
References
-
(1)
Beloborodov, A. M. 2002, ApJ, 565, 808.
Chevalier,R.A. & Li,Z.Y. 1999, ApJ, 520, L29.
Chevalier,R.A. & Li,Z.Y. 2000, ApJ, 536, 195.
Ciardi, B. & Loeb, A, 2000, ApJ, 540, 687.
Coburn,W. & Boggs, S.E. 2003, Nature, 423, 415.
Frail, D.A. et al. 2001, ApJ, 562, L55.
Ghisellini,G. & Svensson,R. 1989, in NATO ASI Series Proc, Physical processes in hot cosmic plasmas, p. 395.
Ghisellini,G. & Svensson,R. 1991, MNRAS, 252, 313.
Kobayashi,S. 2000, ApJ, 545, 807.
Kobayashi,S, Piran,T. & Sari,R. 1997, ApJ, 490, 92.
Kobayashi,S & Zhang,B. 2003a, ApJ, 582, L75.
Kobayashi,S & Zhang,B. 2003b, ApJ, 597, 455.
Kumar,P. & Panaitescu,A. 2000,ApJ, 541, L51.
Kumar,P. & Panaitescu,A. 2003, astro-ph/0305446.
Li,Z.Y. & Chevalier,R.A. 2003, ApJ, 589, L69.
Lithwick,Y & Sari, R. 2001, ApJ, 555, 540.
Panaitescu,A. & Kumar, P. 2001, ApJ, 560, L49.
Panaitescu,A. & Kumar, P. 2002, ApJ, 571, 779.
Sari,R. & Esin 2001, ApJ, 548, 787.
Sari,R. & Piran,T. 1995, ApJ, 455, L143.
Sari,R. & Piran,T. 1999, ApJ, 517, L109.
Sari,R., Piran,T. & Narayan,R. 1998, ApJ, 497, L17.
Stanek,K.Z. et al. 2003, ApJ, 591, L17.
Wijers,R.A.M.J. & Galama,T.J. 1999, ApJ, 523, 177.
Wu,X.F. et al. 2003, MNRAS, 342, 1131.
Zhang,B., Kobayashi,S. & Mészáros,P. 2003, ApJ, 595, 950.
Zhang,B. & Mészáros , P. 2001, ApJ, 559, 110.