First Star Signature in Infrared Background Anisotropies
Abstract
Recent cosmic microwave background anisotropy results from the Wilkinson Microwave Anisotropy Probe suggest that the universe was reionized at a redshift around 20 with an optical depth for Thomson-scattering of 0.17 0.04. Such an early reionization could arise through the ionizing radiation emitted by metal-free population III stars at redshifts of 10 and higher. We discuss infrared background (IRB) surface brightness spatial fluctuations from such a generation of early star formation. We show that the spatial clustering of these stars at tens of arcminute scales generates a contribution to the angular power spectrum of the IRB anisotropies at the same angular scales. This excess can be potentially detected when resolved foreground galaxies out to a redshift of a few is removed from the clustering analysis. We do not expect faint galaxies at redshifts of 3, with magnitudes less than 20 in the K-band, to be a source of strong confusion, since the fractional contribution to the IR background from these galaxies is at a level less than a few percent, while the expected contribution from first stars can be more than 50% or more. Additionally, assuming a population III stellar spectrum, we suggest that the clustering excess related to the first generation of stars can be separated from brightness fluctuations resulting from other foreground sources and galaxies using multifrequency observations in the wavelength range of 1 to 5 m. In addition to removing the low-redshift galaxy population, the multifrequency data are essential to account for certain foreground contaminants such zodiacal light, which, if varying spatially over degree scales, can be a significant source of confusion for the proposed study. Using various instruments, we study the extent to which spatial fluctuations of the IRB can be studied in the near future.
Subject headings:
cosmology: theory —large scale structure of universe — diffuse radiation — infrared: galaxies1. Introduction
The Wilkinson Microwave Anisotropy Probe (WMAP) has now provided strong evidence for an optical depth for electron scattering of 0.17 0.04 based on the large scale polarization pattern related to rescattering of Cosmic Microwave Background (CMB) photons (Kogut et al. 2003). If the reionization process is described as instantaneous and homogeneous, the measured optical depth implies a reionization redshift of in a spatially flat universe. Such a reionization redshift is higher than previously suggested by observational data involving the presence of a Gunn-Peterson trough in quasars (Fan et al. 2002). The derived redshift for reionization is at the high end of expectations related to reionization scenarios based on the ionizing radiation from the first generation of star formation associated with population III (hereafter Pop III) stars (e.g., Cen 2003; Fukugita & Kawasaki 2003; Venkatesan, Tumlinson & Shull 2003; Wyithe & Loeb 2003). These stars are expected to be very massive with a top-heavy mass function (Bromm, Coppi & Larson 1999, 2002; Abel, Bryan & Norman 2000, 2002), and their detection is important to understand the astrophysics associated with the reionization process that followed the end of dark ages.
While the direct detection of an individual Pop III star or a star cluster is beyond the capability of upcoming telescopes or instruments, the first star signature can be potentially detected via indirect methods such as associated line emission, e.g., HeII recombination lines of the surrounding ionized halo (Oh, Haiman & Rees 2001; Tumlinson, Giroux & Shull 2001) or through Ly- emission lines (e.g., Tumlinson, Shull & Venkatesan 2003). In Oh, Cooray & Kamionkowski (2003), it was suggested that the heating of the surrounding interstellar medium by Pop III supernovae, and the subsequent transfer of energy to the CMB through Compton cooling, lead to a substantial contribution to small angular scale CMB anisotropies, similar to the Sunyaev-Zel’dovich (SZ; Sunyaev & Zel’dovich 1980) effect. While an individual Pop III supernova remains unresolved and undetectable, the large bias factors of halos containing these supernovae, with respect to the linear density field, lead to an excess clustering signature in CMB anisotropies at tens of arcminute scales when compared to the shot-noise contribution related to their finite density. The CMB anisotropies related to Pop III supernovae can be separated from the dominant SZ fluctuations related to galaxy clusters since massive clusters that dominate the angular power spectrum at arcminute scale can be identified and removed in future higher angular resolution CMB data (Cooray et al. 2003).
Here, we suggest that a signature of stars themselves can be found in the infrared background (IRB). In particular, if Pop III stars are found primarily at redshifts between 10 and 30, they are expected to contribute to the IRB at wavelengths between 1 and 5 m. Recent estimates now suggest that a large fraction of the IRB total intensity may be due to these stars (Santos, Bromm & Kamionkowski 2002; Salvaterra & Ferrara 2003); A substantial IRB arises from the Pop III population not only due to the direct emission associated with these stars, but also due to indirect processes that lead to free-free and Lyman-alpha emission from the ionized nebulae, or HII regions, surrounding these stars. The fractional contribution to the absolute, and isotropic, background by the Pop III population, however, cannot be easily determined observationally due to additional contributions from foreground galaxies, stars, and confusion from zodiacal light.
Instead of the background intensity, or the monopole, we suggest that the presence of first stars can be established through spatial fluctuations in the surface brightness of the IRB. For this purpose, we make use of the angular power spectrum of IRB anisotropies and show that the power spectrum is expected to contain an excess clustering signature at tens of arcminute scales related to the Pop III population. While Pop III stars may dominate tens of arcminute-scale fluctuations at short IR wavelengths (between 1 and 3 m), any unresolved galaxies at redshifts of 3 and higher, are expected to dominate IRB anisotropy at wavelengths greater than 4 m over all angular scales of interest. Thus, we expect the Pop III clustering signature can be separated from the angular power spectrum due to foreground galaxies and other sources in multifrequency near-IR (NIR) images due to its unique spatial and spectral signature. Furthermore, when the angular power spectrum due to Pop III stars is estimated, one can use that information, for example, to measure the formation rate of the first generation of stars in the universe at redshifts between 10 and 30.
Note that spatial fluctuations in the IRB have already been detected in several ground-, suborbital- and space-based experiments: Xu et al. (2002) at 4 m using a rocket-borne experiment; at J, H and K-band with 2MASS data by Kashlinsky et al. (2002; also Odenwald et al. 2003); Infra-Red Telescope in Space (IRTS) data by Matsumoto 2000; and at large scales with Diffuse Infrared Background Experiment (DIRBE) on Cosmic Background Explorer (COBE) by Kashlinsky, Mather & Odenwald (1996; also, Kaslinsky et al. 1996). Absolute background measurements, generally indicate an excess above that expected from galaxies alone (Kashlinsky & Odenwald 2000; Madau & Pozzetti 2000; Cambrésy et al. 2001; Wright & Johnson 2001). Additionally, IRTS data also indicate a clustering excess at 100 arcmin scales between 1.4 to 2.1 m, which remains unexplained by the known properties of low redshift galaxies (Matsumoto 2000,2001). Expectations for an overall excess in anisotropy include both faint galaxies at high redshifts (Jimenez & Kashlinsky 1999) as well as a Pop III component related to the first generation of stars at redshifts greater than 10 (e.g., Magliocchetti, Salvaterra & Ferrara 2003). While simple estimates suggest that the IRB total intensity can be easily explained with Pop III stars alone (Santos, Bromm & Kamionkowski 2003; Salvaterra & Ferrara 2003), it is useful to also consider if these stars can be used to explain anisotropy fluctuations already detected or, if not, the expected level of spatial fluctuations from these stars.
The current observational results related to IRB fluctuations are, unfortunately, limited to either small angular scales (such as 1 to 30 arcseconds measurements by 2MASS) or large angular scales ( 0.5 degrees with COBE DIRBE), with limited measurements at arcminute to tens of arcminute scales. While 2MASS measurements by Kashlinsky et al. (2003) are useful to understand the presence of a Pop III contribution, at such small angular scales, both foreground sources and Pop III stars produce power-law like contributions to the angular power spectrum and cannot easily be separated (Magliocchetti, Salvaterra & Ferrara 2003). Additionally, the Pop III contribution can also be misidentified easily as a source of noise, since, at these small angular scales, one expects a shot-noise type power spectrum due to the finite number density of these stars.
In order to understand the clustering nature of the Pop III population, here we study the angular power spectrum of IRB fluctuations, as a function of wavelength, and introduce the use of power spectra at each of these wavelengths and the cross-spectra between different wavelengths as a basis to study the star formation history related to Pop III objects. Our calculations extend those of Magliocchetti, Salvaterra & Ferrara (2003), by considering the angular power spectrum of Pop III stars over a wide range of angular scales instead of arcsecond scales studied there with respect to 2MASS measurements. We argue that a well-planned observational program, concentrating on the clustering at arcminute to tens of arcminute scales or more in the wavelength range of 1 to 5 m, is clearly needed to understand the presence of Pop III stars in IRB data. Since Pop III stars are expected at redshifts below 30, we find that the upcoming and planned wide-field IR and near-IR missions from space, such as SIRTF111http://sirtf.caltech.edu/ and the proposed WISE mission, are unlikely to play a major role since the Pop III signature is reduced for m. The upcoming ASTRO-F222http://www.ir.isas.ac.jp/ASTRO-F mission has imaging capabilities at arcsecond resolution in the K, L and M-bands between 1.7 to 5 microns with its Near Infra-Red Camera (N-IRC) and at a higher sensitivity at short wavelengths (Watarai et al. 2000; Pearson et al. 2001). While observations with ASTRO-F are only restricted to the 10 field of view, these observations are still useful to understand the presence of Pop III sources and their contribution to IRB spatial fluctuations at angular scales of few arcminutes.
In order to understand the spatial fluctuations due to Pop III sources at tens of arcminute scales and above, and also to probe clustering at arcminute scales at wavelengths below 2 microns, we also consider a multiwavelength wide-field survey using a rocket-borne experiment. This experiment is planned to image the sky in multiple bands in the wavelength range between 1 and 5 m, with the primary goal of exploring the presence of Pop III stars in IRB spatial fluctuations. While we present a general discussion, we will focus on the ability of these experiments to extract Pop III information through spatial clustering and to remove confusing point sources related to both galactic stars and foreground galaxies.
The paper is organized as follows. In the next section, we calculate the power spectrum of IRB anisotropies both for Pop III stars and foreground sources. To describe the emission from Pop III stars, we make use of the stellar spectra calculated by Santos, Bromm & Kamionkowski (2003). These calculations also include nebular emission associated with both free-free and Lyman- radiation associated from the ionized HII region surrounding individual Pop III stars. Note that though we consider Pop III sources as the source or ionization, our calculations does not necessarily depend on this assumption. The WMAP results indicate evidence for a highly efficient source of starformation at high redshift and could be in the form of Pop II to Pop III stars. While we make use of a Pop III spectrum to illustrate the clustering in spatial fluctuations in the IRB, we also expect similar spatial fluctuations (though with a different amplitude) if the reionization is related to a different stellar spectrum, say associated with mildly metal-enriched stars, instead of pure metal-free stars. In such a scenario, one can simply replace the correct stellar spectrum instead of the Pop III one used here and repeat our calculations. When illustrating our calculations, we take cosmological parameters from the currently favored CDM cosmology consistent with recent WMAP results (Spergel et al. 2003), including a normalization for the matter power spectrum, at scales of 8 Mpc, of .
2. Angular Power Spectrum of IRB fluctuations

Following standard approaches in the literature, we calculate the angular power spectrum of IRB surface brightness fluctuations both due to foreground sources at redshifts between 0 and 7 and Pop III stars at redshifts between 10 and 30; except for the lower end of the Pop III distribution (which we simply take here as the transition from Pop III to Pop II stars, and discussed further in Section 2.1), our calculations are independent of the end points of the redshift ranges considered.
In general, the clustering contribution to the angular power spectrum resulting from foreground galaxies is mostly a power-law, which is now well explained with techniques such as the halo model (e.g., Cooray & Sheth 2002). Pop III stars, or any other source that trace linear clustering at redshifts of order 15 or so, on the other hand, have an angular power spectrum that peaks at tens of arcminute scales. Such a spectrum is expected since high redshift sources are expected to be strongly biased with respect to the linear dark matter density field and linear fluctuation power spectrum contains a peak, or a turnover, at the scale corresonding to the matter-radiation equality. A detection of such a peak in the power spectrum of any tracer source of linear density field would be significant since it will help establish our basic uncerstanding of clustering evolution. Moving to smaller scales corresponding to few tens of arcseconds and below, one expects the background Pop III stars to show a shot-noise type spectrum associated with the finite number density of these sources on the sky. In the case of Pop III stars, the transition scale from linear to shot-noise type clustering is highly model dependent, though with observational data, one can use a measured transition as an additional constraint on the astrophysics of the Pop III population. Given that shot-noise contributions result from both detector noise and other confusions, such as galactic foregrounds, we do not expect a precise measurement of the shot-noise power associated with Pop III stars to be feasible. For similar reasons, it is unlikely that arcsecond-scale IRB clustering information is useful for a separation of the Pop III contribution from foreground galaxies.
Our calculational approach to model the angular power spectrum of the IRB is similar to the one that was used in Knox et al. (2001) to understand the clustering in the far-infrared background at wavelengths of few hundred microns or more due to dusty star burst galaxies at redshifts of 3. The contribution to the IRB intensity, at a given wavelength and towards a direction , can be written as a product of the mean IRB emissivity and its fluctuation
| (1) |
where is the mean emissivity per comoving unit volume at wavelength as a function of redshift and is the conformal distance or lookback time, from the observer, given by
| (2) |
where the expansion rate for adiabatic cold dark matter cosmological models with a cosmological constant is
| (3) |
Here, can be written as the inverse Hubble distance today Mpc. We follow the conventions that in units of the critical density , the contribution of each component is denoted , for the CDM, for the baryons, for the cosmological constant. We also define the auxiliary quantities and , which represent the matter density and the contribution of spatial curvature to the expansion rate respectively.
The absolute IRB has now been studied both observationally and theoretically (e.g., Hauser & Dwek 2001 for a recent review). Here, we focus on the spatial fluctuations of the background, , and consider the angular power spectrum of the IRB, which is simply the Legendre transform of the two point correlation function, :
| (4) |
Denoting the Fourier transform of as , one can define the angular power spectrum of the IRB at wavelengths and , in the flat-sky approximation, as
| (5) |
In order to calculate the spatial fluctuations related to the emissivity, we assume trace fluctuations in the source density field, , such that, in Fourier space,
| (6) |
The source density field fluctuations are defined by the three dimensional power spectrum, which we define as
| (7) |
We will calculate this power spectrum of the source distribution, related to both Pop III stars and foreground galaxies, based on the halo approach (see, Cooray & Sheth 2002 for a recent review). In general, the total power spectrum can be written as a combination of 1- and 2-halo terms with
where is the density profile (e.g., NFW profile of Navarro, Frenk & White 1996) in Fourier space normalized appropriately with mass, is the mass function (e.g., PS mass function of Press & Schechter 1974), and is the halo bias (e.g., Mo & White 1996; Mo, Jing & White 1997). The source distribution within halos is encoded by , the mean source occupation number or the average number of individual sources of interest in each dark matter halo of mass , and , the second moment of the source distribution. In the case of a Poisson-type distribution of sources, . In Eq. LABEL:eqn:pk, is the linear power spectrum of the density field and we use the transfer function of Eisenstein & Hu (1998) to describe the small scale behavior of this power spectrum. Note that the mean density of sources is given by
| (9) |
Note that this approach to describe clustering of sources that lead to the IRB is similar to the one used in Song et al. (2003) to describe clustering properties of far-infrared background sources.
Using the Limber approximation (Limber 1954), the angular power spectrum for a distribution of sources that trace a three-dimensional power spectrum , when projected on the sky, is given by
| (10) |
where the comoving angular diameter distance is
| (11) |
Note that as , . At , the Limber approximation is valid to within 5% of the exact calculation that involve radial integrations over the spherical Bessel functions (see, Knox et al. 2001 for the formulae that involve the exact calculation), and rapidly converges to the approximated calculation here as one moves to higher . At multipoles below , the Limber approximation results in an overestimate of power at the level of 10%, and we do not consider this to be important for the present discussion given the large uncertainties, which lead to several orders of magnitude change in , associated with the description of Pop III sources and discussed in Section 2.1.
In addition to the clustering signal, at small angular scales, the finite density of sources leads to a shot-noise type power spectrum in the IRB spatial fluctuations. This shot noise can be estimated through number counts, , of the contributing sources, as a function of flux , and can be written as
| (12) |
where is the flux cut off value related to the removal of resolved sources.
We will now describe how and ingredients related to can be obtained from simple analytical methods making use of various approaches in the literature.
2.1. Pop III stars
To calculate , we follow the calculation in Santos, Bromm & Kamionkowski (2003) and assume that the mass of stars formed per halo is when and zero otherwise where is the star-formation efficiency, which we take here as a free parameter. Furthermore, we assume that Pop III stars trace the star formation history at high redshifts and, for calculational purposes, make use of a model that include molecular hydrogen cooling at a temperature of 400 K. The star formation rate is calculated as
| (13) |
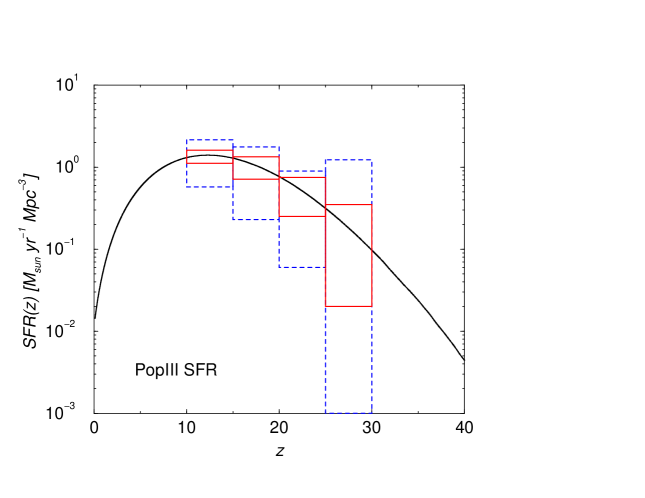
where is given in Eq. 4 of Santos, Bromm & Kamionkowski (2003). The star-formation rate is plotted in Fig. 7, and we will return to this later in the context of its estimation from Pop III clustering data in the the IRB spatial fluctuations.
Given the star formation rate, we can write
| (14) |
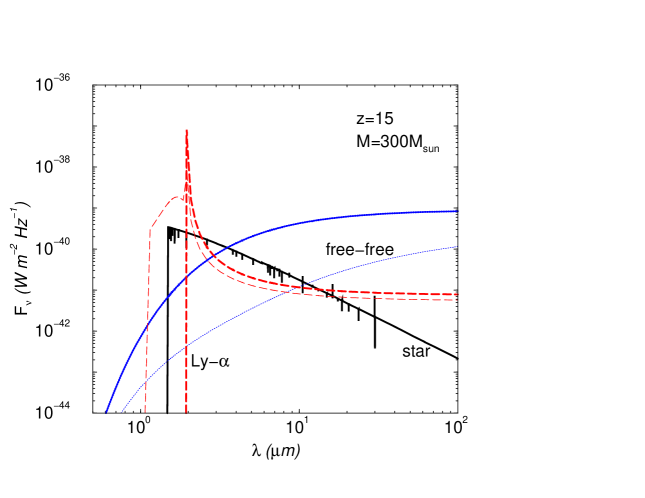
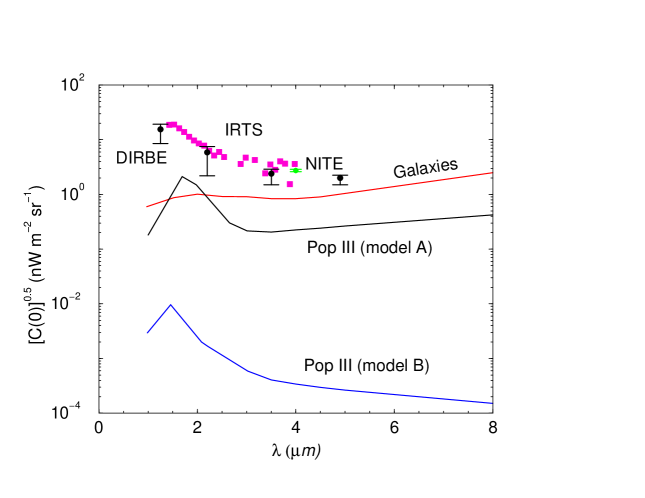
where years is the mean life time of a Pop III star and is the stellar flux as a function of wavelength, including nebular emission, of a Pop III star (Fig. 1). Again, we make use of calculations by Santos, Bromm & Kamionkowski (2003) on the Pop III spectrum and consider two extreme cases with and 1, where is the escape fraction of ionizing radiation to general intergalactic medium from the nebula. The spectra are reproduced in Fig. 1 for a star with mass M☉. While the stellar spectrum can easily be described by a simple black-body, the nebular emission, related to Lyman- radiation and free-free emission, involves a detailed calculation and is model dependent on . In the case of , one finds more emission at shorter wavelengths and we will see later that this leads to an increase in the clustering amplitude at shortest wavelengths when compared to the case with .
To calculate the three-dimensional power spectrum of sources, we make use of the same assumptions as above including the fact that the Pop III occupation number is simply determined by the halo mass such that when and zero otherwise. Since the number of stars formed is linearly proportional to the halo mass, the Pop III clustering is expected to simply trace that of dark matter, but with a bias factor determined by the halo masses in which stars are found. We also assume a second moment which is given by the square of the mean, as in the case of a Poisson distribution. At large scales, when , the simple dependence on the halo mass leads to the well known mass averaged bias as
| (15) |
where is the halo bias with respect to the density field.
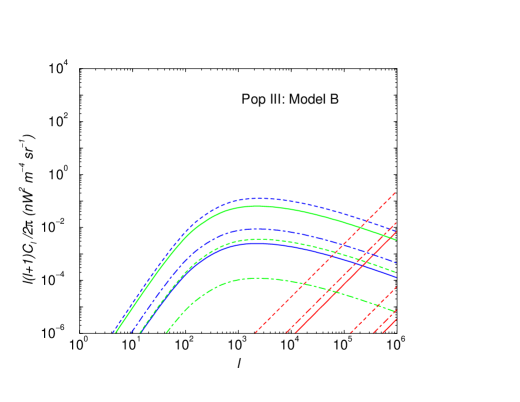
Since our model has a large number of uncertainties, both in terms of the redshift distribution of Pop III sources, their spectra, and the biasing factor of halos containing these stars, we consider a range of models to establish both optimistic (model A) and pessimistic (model B) estimates of the angular power spectrum. This is similar to the approach considered in Oh, Cooray & Kamionkowski (2003) to estimate the Pop III supernovae contribution to CMB anisotropy fluctuations. Our optimistic estimate involves: (a) highly biased sources with a cut-off mass for Pop III containing dark matter halos that corresponds to a temperature of 105 K, (b) a low end for the Pop III redshift distribution at a redshift of 10, (c) and a star-formation efficiency of 100% () such that all baryons in these halos convert to Pop III stars. Our pessimistic estimate involves: (a) sources which have low bias factors (with a minimum temperature set at 5000 K), (b) the low end of the redshift distribution of Pop III sources set at 15, and (c) a lower star-formation efficiency with . In general, the supernovae related to Pop III stars of model A, following Oh, Cooray & Kamionkowski (2003), can generate the excess CMB anisotropy fluctuations detected by small angular-scale CMB experiments. In each of these two models, due to the uncertainty related to the Pop III spectrum, we also vary between 0 and 1 to consider variations allowed for the amplitude of the angular power spectrum.
For Pop III sources, note that the source power spectrum, in the angular scales of interest, is fully described by the linear clustering power spectrum scaled by a bias factor. The one-halo term, related to the non-linear part of the power spectrum, is not significant due to the fact that strong biasing of halos containing Pop III sources leads to a dominant two-halo term. This is also consistent with the rapid reduction in non-linear clustering one expects at redshifts of order 10 and higher when compared to today. In order to study the extent to which non-linearities may be significant, one can introduce the fully non-linear dark matter power spectrum based on numerical fits to dark matter simulations (e.g., Peacock & Dodds 1996). Since sources are not expected to trace dark matter, especially in the non-linear regime of dark matter clustering, an alternative approach is to calculate the non-linear correction to source clustering based on the one-halo term related to the halo approach. This requires knowledge related to the second moment of the Pop III occupation number. Here, as an approximation, we make use of the Poisson model and assume that the second moment is simply given by the square of the first moment.
In addition to the non-linear clustering, at these small angular scales, what determines the power spectrum is the shot-noise associated with the finite density of Pop III sources. To calculate the shot-noise power spectrum reliably we need a detailed model describing number counts of Pop III sources, including the exact mass function of Pop III stars within each of the dark matter halos. For the clustering calculation, this information is not required since, in the end, the clustering amplitude depends only on is the total baryonic mass within each halo converted to stars, and not how this mass gets divided in to stars. Additionally, the shot-noise contribution is more uncertain than the clustered component since the shot-noise depends on the rarest Pop III sources which also happen to be the brightest. Similar to our approach for the clustering signal, we also make both optimistic and pessimistic estimates of the shot-noise contribution, but for simplicity, we only show the shot-noise related to the spectrum (see, Fig. 3); in cases where the clustering signal is high due to higher biasing of rarer halos, we also find a higher shot-noise contribution since such rare halos have a low projected surface density. Note that our highest shot-noise estimates, corresponding to the most optimistic estimate on the Pop III clustering contribution, can be excluded by fluctuation analyses of already existing deep K-band imaging data. Thus, the recent 2MASS clustering measurement at small angular scales, discussed with respect to figure 4, cannot be explained with Pop III shot-noise alone.
2.2. Foreground galaxies
To describe the spectrum of an individual galaxy, we make use of the spectrum of M82 (e.g., Silva et al. 1998 where a model fit is presented to explain the observed spectral energy distribution over a wide range of wavelengths from far-infrared to UV light). While the use of such a spectrum to describe all galaxies is likely to be an overestimate, we consider it here since this provides a conservative upper limit on the extent to which foreground galaxies can confuse clustering studies of the first star population using IRB data. To describe the redshift distribution of foreground galaxies, we make use of the normalized star-formation rate between redshifts of 0 and 7, but introduce an exponential cut off at redshifts above 4 such that the redshift distribution turns over and converges essentially to zero at a value of 7. Note that the observational data related to galaxy counts, at redshifts greater than 3, are highly uncertain, though preliminary studies indicate that the fractional contribution to the infrared background from galaxies at redshifts greater than 3 (and K-band magnitudes fainter than 23), may not be significant (Totani et al. 2001a). Thus, we expect our modeling to provide only an estimate of the galaxy contribution to the infrared background. While a lack of massive halos at redshifts greater than 3 reduces the presence of a large number of IR-bright galaxies considerably, the presence of unusually red galaxies in certain K-band imaging data (e.g., Totani et al. 2001b; Daddi et al. 2003) suggests that the situation may be more complex than suggested by numerical calculations. In addition to the suggested distribution, we also considered alternative redshift distributions for foreground galaxies, but found consistent results as long as the distribution is not sharply peaked towards the low redshift end, such as below z of 1; such models are clearly inconsistent with K-band galaxy counts among other data and we do not consider such models further.
The clustering of foreground galaxies is also calculated following the halo-based approach with a halo occupation number based on fits to semi-analytic numerical simulations data by Sheth & Diaferio (2001):
| (18) |
where we set and take and as free parameters. In our fiducial description, these two parameters take numerical values of 0.8 and 0.7, respectively. In addition to the mean, we also account for departures from the mean in the 1-halo term with a detailed model for the second moment, instead of the simple Poisson description used in above. Following Scoccimarro et al. (2001), we make use of the binomial distribution, matched to numerical data, to obtain a convenient approximation. The second moment is then
| (19) |
where for and thereafter. Note that in equation LABEL:eqn:pk, the simplest approach is to set when calculating . In halos which contain only a single galaxy, however, we assume that this galaxy sits at the center and take when is greater than unity and otherwise. These description for galaxy clustering lead to a power-law like three dimensional spectrum over a wide range of physical scales and also explains why the clustering of galaxies shows no excess, as in dark matter clustering, between the transition from linear to non-linear clustering (see, Cooray & Sheth 2002 for details).
While the use of a low-redshift determined occupation number, motivated by semi-analytical modeling of “blue” galaxies, to describe clustering properties of IR galaxies may seem problematic, we suggest that this description is adequate for purposes of the present discussion. The main problem related to our description comes from the fact that, based on observations, one naively expects the minimum mass at which an IR galaxy at redshifts of 3 to form in halos with a mass at least two orders of magnitude above the minimum mass we have indicated in Eq. 16. For example, the existing clustering data of IR galaxies at high redshifts (e.g., Daddi et al. 2003) indicate strong clustering of K-band selected galaxies at a level similar to or greater than the clustering strength of the Lyman break galaxy population at redshifts 3 and suggests that the minimum mass must be set at a level of 1013 M☉. In the case of Lyman-break galaxies, the halo occupation number is investigated in detail by Bullock, Wechsler & Somerville (2002). Contrary to naive expectations, however, these authors find an occupation number with a minimum mass at the level we have indicated in Eq. 16, though there is a large range of allowed values (see, e.g., Fig. 3 of Bullock, Wechsler & Somerville 2002). The difference can be understood based on the fact that the minimum mass, as indicated by the halo occupation number, is not necessarily the one related to the mass above which halos are found to contain one observed object, but rather the minimum mass in which one galaxy may form. While analytically, halos with mass below the minimum expected and above the minimum allowed by the halo occupation number form a fraction of a galaxy in each halo, in reality, this is meant to indicate the fact that only a fraction of such halos form galaxies occasionally. On the other hand, all halos with mass above the expected minimum mass, which in this case is two orders of magnitude higher than the inferred minimum, are expected to host one or more galaxies. While the overall dilution of the clustering strength by a sample of small mass halos, where galaxies are occasionally found, is not significant, these halos are important to describe the clustering properties of the high redshift population (see, Bullock, Wechsler & Somerville 2002 for a further discussion).
We note that our predictions related to IR galaxy clustering at redshifts around 2 are consistent with Daddi et al. (2003) measurements and find this to be adquate enough for the present paper. This is mainly due to the fact that we are mainly concerned with clustering properties of brightness galaxies at redshifts between 1 and 2, or in the case of K-band, at magnitudes below 20 or so. As we will soon discuss, this is within the range of magnitudes for which upcoming experiments will be able to remove resolved sources from a clustering analysis. We are less concerned about the clustering properties of faint high redshfit galaxies, at , for one significant reason. The suggested measurement involves a clustering analysis of brightness fluctuations and not source counts, as in traditional studies of galaxy clustering at low redshifts. Thus, the clustering power spectrum from each redshift range, or bin, is weighted by the contribution to the absolute IR background produced by galaxies in that range or bin. Assuming fluctuations in the brightness trace source counts, we can roughly write this as where is the angular power spectrum of source clustering. The fractional contribution to IR background from high redshifts is substantially less than that produced by nearby bright galaxies out to a z of 1 (e.g., Cambrésy et al. 2001). In the K-band, the fractional contribution to the infrared background from galaxies with magnitudes fainter than 20, which are expected to be at redshifts greater than 2, is at most at the level of 10%, or if not less. On the other hand, the fractional contribution from Pop III sources can be at the level of 50%, or more, especially under extreme models discussed in the literature (e.g., Salvaterra & Ferrara 2003). In relative terms, using the fractional contribution to the background, one can safely conclude that Pop III clustering will dominate brightness fluctuations, when compared to that of faint galaxies at redshifts of around 3, by at least a factor of several tens or more since . The extent to which this ratio can be known exactly depends on the relative strength of source clustering at redshifts of around 3 when compared to that at a redshift around 15. Though some subsamples of faint galaxies, such as the red galaxy (J-K 1.7) population of Daddi et al. (2003) at redshift of 3, are strongly clustered, we do not necessarily expect this clustering strength to be significantly higher than Pop III sources such that . However, we note that this conclusion could substantially change if the population is to be a significant contributor to the IR background and its fractional contribution is substantially higher than 10% or so level implied in the Cambrésy et al. (2001) paper.
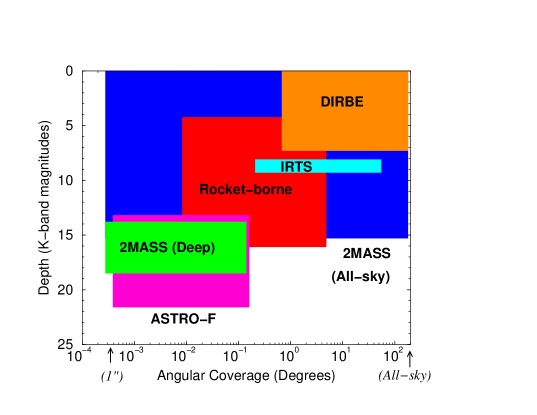
The shot-noise power spectrum related to galaxies, as well as galactic stars, is more certain due to the availability of the number counts in certain wavelength ranges between 1 and 5 microns. In Fig. 2 (right plot), we plot the average number counts in the K-band compiled from a variety of sources in the literature following Saracco et al. (2001) and Cambrésy et al. (2001; and references therein). We will use these number counts to establish the confusion noise in various experiments, summarized in Fig. 2 left plot, at near IR wavelengths to understand the extent to which these foreground sources dominate clustering studies through their shot-noise power spectrum. In both plots of Fig. 2, we also illustrate the magnitude limit to which resolved sources can be removed at the 5 instrument noise level in various past and upcoming wide-field imaging data that are adequate enough for a clustering analysis of any first-star contribution to the IRB.
2.3. Angular Power Spectra
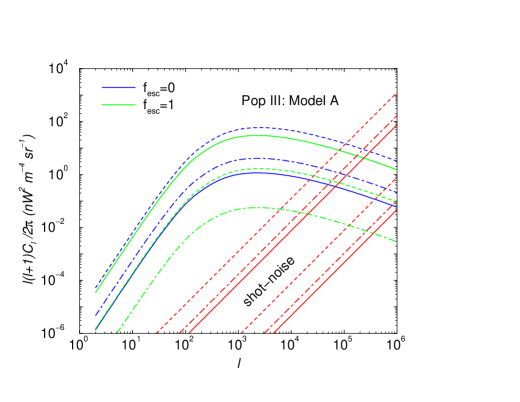
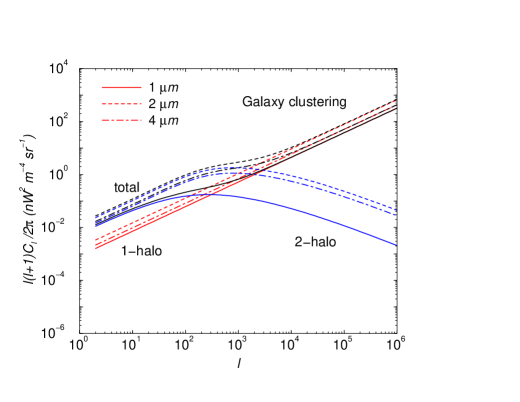
In Fig. 3 (top plot), we show the angular power spectra of galaxies and Pop III sources as a function of wavelength at 1, 2 and 4 m. These wavelengths are loosely chosen to represent the clustering behavior of sources in the IR regime. In the case of galaxies, the angular power spectrum is nearly a power-law over a wide range of angular scales. The excess clustering at degree scales is related to the linear power spectrum which projects at low redshifts (). When interpreting this galaxy power spectrum, one should consider this as a representative case where foreground galaxies, out to a redshift of 1, is removed from the data such that nearby low redshift galaxies are absent; In our calculations, we allow for such a removal by simply cutting off the redshift distribution of galaxies at redshifts below 1. Note that our approach to describe clustering of galaxies at IR wavelengths is different from previous approaches. Instead of extending the measured power spectrum at low redshifts, such as from the APM survey, to higher redshifts, or using numerically calibrated fitting functions for the non-linear power spectrum, such as from Peacock & Dodds (1996), which are valid only for dark matter, we have made use of the halo approach to calculate the clustering of galaxies directly.
Our approach to describe clustering is also independent of techniques that make use of galaxy number counts at IR wavelengths. While there is now detailed information related to galaxy counts, the exact redshift distribution of IR contributing galaxies still remains somewhat uncertain. As a simple approach, here we have made use of a distribution based on the normalized star-formation rate. As long as this distribution is not dominated by galaxies at the high end of this redshift distribution, galaxy clustering follows a power-law. Though we have not considered here, our halo-based approach can be extended, under certain assumptions, to model number counts of IR galaxies similar to approaches considered in studies such as by Jimenez & Kashlinsky (1999).
The Pop III stars, since they are present at redshifts greater than 10 and are highly biased with respect to the density field, trace the linear regime of clustering at tens of arcminute scales when projected on the sky today. As shown in Fig. 3 top plots, the Pop III stars, thus, show the expected signature of an excess clustering, above the shot-noise power spectrum, at angular scales where the linear power spectrum has a peak associated with the matter-radiation equality. The difference between the linear clustering of galaxies at low redshifts and at angular scales of few degrees or more, and Pop III sources at high redshifts, and at tens of arcminute scales, can be understood based on the redshift evolution of the linear density field power spectrum alone. As discussed in Cooray et al. (2001), this evolution can in fact be used to constrain certain cosmological parameters though we do not pursue such possibilities here.
In Fig. 3, we also show Pop III source clustering angular power spectra for flux spectra involving and 1. We consider these two values as a potential bound on the uncertainties related to the Pop III spectrum. While the clustering excess at a short wavelength like 1 m is small in the case of , with , we find a significant contribution at the level comparable to 2 m. This can be understood based on the Pop III spectra we show in Fig. 1 and results from the fact that when , the short wavelength cut off is decreased to a wavelength value lower than for . Additionally, due to the decrease in free-free emission with , one finds a lower clustering amplitude at high end of the IR wavelengths when compared to the case with . While we have considered these two extreme cases one expects to be order few tens of percent at most, such that more realistic scenario will be more closely related to than .
In addition to the spectrum, other uncertainties in physics of the Pop III population lead to a highly indeterminate overall normalization for the angular power spectrum. These uncertainties, which are more significant than alone, are related to the Pop III redshift distribution and biasing with respect to the linear density field. We bound these uncertainties and consider two estimates at the high and low end; it is likely that the true clustering is somewhere between the two, though, due to large uncertainties, we are unable to determine this to a better accuracy than the range implied by the two models. While the amplitude of the Pop III angular power spectrum may be uncertain, however, the angular scale at which the Pop III clustering signature is expected is more reliable as it is simply a reflection of the linear power spectrum projected at redshifts of order 20; varying the projection from redshifts 10 to 50 or so does not lead to a large change in this angular scale since the angular diameter distance does not change significantly in this range of redshifts.
In addition to a clustered signal, the finite density lead to a Poisson noise. These shot-noise power spectra for Pop III sources, as a function of the wavelength, is also shown in Fig. 3 (top plots). As we discussed earlier, the shot-noise is more uncertain than the clustering power spectrum since the shot-noise depends strongly on the rare and bright events while the clustering amplitude, as well as the cumulative background, does not. While the shot-noise can easily be confused with the shot-noise power due to faint unresolved galaxies, among other foregrounds, the clustering excess, at tens of arcminute scales, however, provides a potentially interesting signature of Pop III which can be observed.
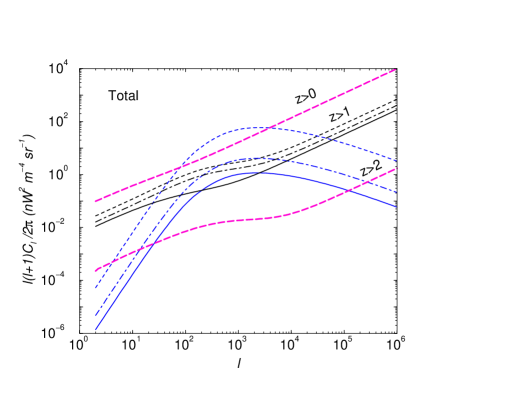
As shown in Fig. 3 (bottom right plot), the excess Pop III clustering signature lies above the angular power spectrum of galaxies when wavelengths are in the range of 1 to 2 m and when nearby galaxies are removed from the data. Allowing for the presence of nearby galaxies leads to a slightly higher clustering signal for galaxies, which we have shown with a long-dashed line in the right-bottom plot of Fig. 3 for a wavelength of 2 m. The removal of bright nearby galaxies leads to a decrease in the non-linear clustering, but not necessarily the large angular scale clustering related to the 2-halo part of the power spectrum since the large angular scale clustering is determined by the linear power spectrum scaled by the bias factor. For galaxy models considered here, the average bias factor is not strongly sensitive to the removal of nearby sources. In general, at wavelengths above a few microns, the galaxy clustering fully dominates IRB anisotropies, though, one can improve the detection of Pop III stars even at these wavelengths if most resolved galaxies are removed. For comparison, in Fig. 3, the lower thick long-dashed line show the expected clustering in the infrared-background at 2 m from galaxies at redshifts greater than 2 suggesting that a removal down to this redshift range (or magnitudes at the level of 25 in K-band) is essential to extract the clustering signal associated with first-star population. In general, to perform such a removal and to detect Pop III clustering signal at tens of arcminute scales, an experiment with subarcminute-scale angular resolution, but covering several tens of square degrees, is needed.
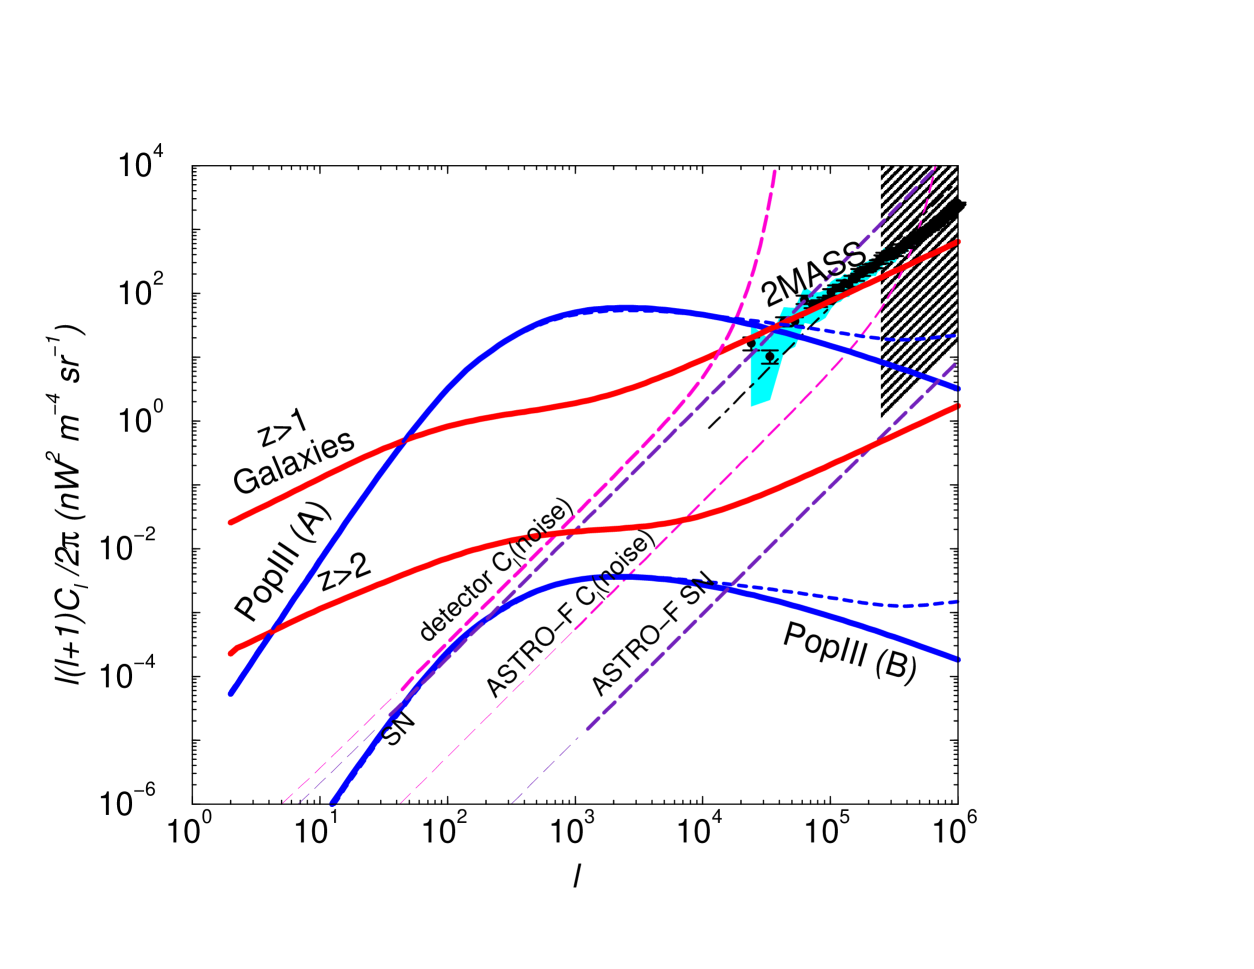
In Fig. 4, we highlight the main aspects of Pop III clustering. For reference, we also show the 2MASS clustering measurement in the K-band at small angular scales (Kashlinsky et al. 2003) as a reference. Note that the Pop III signature is present at tens of arcminute scales with an excess above the level expected from galaxies (assuming that foreground galaxies, out to a redshifts 1 to 2, can be resolved and removed from the analysis). In addition to 2MASS, DIRBE (Kashlinsky, Mather & Odenwald 1996) and IRTS (Matsumoto 2000) measured Pop III clustering at large angular scales and detected excess fluctuations (discussed with respect to Fig. 6). In addition to the linear clustering of Pop III sources, we also show the correction to the power spectrum associated with non-linearities. While non-linearities is expected to increase the power by an order of magnitude at very small scales ( to 106), a comparison to Fig. 3 reveal that at such small angular scales, the clustering spectrum related to Pop III sources is more likely to be dominated by their shot-noise. At these same angular scales, the shot-noise related to unresolved foreground galaxies also become important such that the individual contributions related to galaxies and first stars are not easily separable.
Based on our description of the Pop III population and its clustering aspects, we find the clustering amplitude resulting from emission by first stars is not fully responsible for the clustering signal detected in the 2MASS data at arcsecond angular scales. The 2MASS angular power spectrum is more likely due to a combination of the non-linear clustering of unresolved galaxies and the shot-noise associated with such sources. The number counts of galaxies in the K-band now extend down to a magnitude of 24, and if any shot-noise existed at the 2MASS level, its fluctuation amplitude from pixel to pixel, due to the Poisson behavior, would correspond to a magnitude 22 to 23 in one-arcsecond pixels. The deep counts will easily be sensitive to such variations and based on such an argument, we suggest that the Pop III source shot-noise or clustering contribution must be below the large shaded region on the top right corner of Fig. 4. This region essentially corresponds to 5 fluctuations down to a K-band magnitude of 24 in a one-arcsecond pixel. On the other hand, using measured galaxy counts alone, a significant shot-noise is expected from unresolved sources that are below the instrumental detection limit but above the confusion limit (e.g., Lagache, Dole & Puget 2003 for a description); we show this contribution, together with the shot-noise from sources below the confusion limit, as a dot-dashed line in Fig. 4. It is likely that a combination of this shot-noise and the non-linear clustering of the unresolved sources contribute to the 2MASS measurements, though, a substantial contribution from non-linear clustering of Pop III sources may be expected in certain descriptions of the Pop III population (Magliocchetti, Salvaterra & Ferrara 2003).
Since various possibilities may exist to explain 2MASS measurements (either in terms of galaxies, Pop III sources or in comibation), we suggest that further investigation of small scale clustering behavior of the IRB may not be adequate to separate these contributions. While one can extend a survey such as 2MASS to large angular scales by tiling subsequent fields, this can cause problems when combing adjacent fields to measure large scale clustering beyond that of a single field of view (see discussions in Odenwald et al. 2003). The alternative approach is to image a wider area (of tens of square degrees) directly at slightly lower resolution and perform a clustering analysis, either after removing resolved stars and galaxies directly in such an image or after accounting for such sources based on higher resolution data of smaller fields, to see if there is any evidence for an excess as indicated by Fig. 4 related to Pop III sources. The best combination to search for the Pop III signal appears to be a wide-field camera with fidelity on degree scales combined with a deep survey, such as ASTRO-F, to minimize foreground confusions.
The detection of excess Pop III source clustering will be limited to the extent that foreground stars and galaxies can be removed. In surveys where the source removal is not significant, one expects a higher shot-noise contribution from galactic stars and foreground galaxies, and this shot-noise level could potentially be above the level of expected clustering of galaxies. To model the expected shot-noise, we follow calculations by Lagache, Dole & Puget (2003), and we show the case for a wide-field rocket-borne experiment (see Table 2 for details) in Fig. 4. The instrumental noise power spectrum related to each experiment is shown with a dashed-line and is given by
| (20) |
where is the noise-per-pixel (see, Table 1), is the number of pixels and is the pixel scale or the scale of additional smoothing, if the latter is employed. As written, the noise contribution to the measured power spectra at each wavelength is described through standard CMB analysis approaches (Knox 1995) given the filtered Gaussian beam and the noise of the whole focal plane array. With the noise power spectrum, one can write the error, or standard deviation, for a measurement of the angular power spectrum at each multiple as
| (21) |
where the term related to accounts for the cosmic variance associated with the finite sky-coverage. When the power spectrum measurements are binned in the multipole space, the error associated with the binned power spectrum measurement is reduced further by a factor of where is the width of the bin. While we have not shown these errors in Fig. 4, due to uncertain of Pop III stars, the extent to which upcoming instruments probe the power spectrum, related to is shown with a combination of thick and thin lines when plotting .
For instrumental parameter values in Table 1 related to the rocket-based imaging data, one can remove point sources, at the 3 confidence level above the expected instrumental noise and confusion noise from sources below the resolution limit, down to a flux level of 2 10-7 nW m-2. This corresponds to a K-band magnitude of 16.8. Using K-band counts for stars and galaxies, we expect a shot-noise at the level of nW2 m-4 sr-1 due to unresolved and unsubtracted sources. We show this contribution with a dashed line labeled “SN” in Fig. 4. In the case of a wide-field rocket-borne experiment, one expects a potential detection of the Pop III population, at multipoles of order 103, if these stars follow our models at the optimistic end.
At the low end of our models, the Pop III clustering amplitude is lower and the detection will strongly depend on the extent to which galaxies, with K-band magnitudes at the level of 20 and fainter, can be resolved and removed from the data. While reaching such a low magnitude level for resolved sources is beyond the capability of the rocket-based experiment, due to restrictions in the integration time among others, such a study is clearly possible with ASTRO-F. At the 5 confidence level above instrumental noise, ASTRO-F allows identification and removal of foreground sources down to a magnitude limit of 21.3 in the K-band or 2.2 10-9 nW m-2 in 1.4 arcsecond-pixels. Using the same counts as before, we now find a shot-noise contribution at the level of nW2 m-4 sr-1; while the extent to which Pop III star clustering can be detected with ASTRO-F depends on the clustering nature of unresolved galaxies below its detection limit, we find that ASTRO-F is useful for the study of Pop III stars since it allows a large range in the clustering amplitude to be probed at arcminute scales due to the limited field-of-view, 10 arcmins by 10 arcmins. Such an angular power spectrum measurement is useful to understand the extent to which clustering of Pop III sources contributes to spatial fluctuations of the IRB given that we predict the presence of an excess at angular scales close to 10 arcmins and above. In addition to the limited field-of-view, another drawback with ASTRO-F is the limited wavelength coverage restricted to K-band and longer. To properly establish the clustering of Pop III sources, one will require a study of the frequency spectrum related to the clustered component and lack of observations below K-band may complicate such an analysis; Furthermore, if coverage at shorter wavelengths existed, one can use such data for an extraction of the Pop III contribution, based on its expected spectrum, such that the confusion between Pop III sources and foreground galaxies are further reduced.
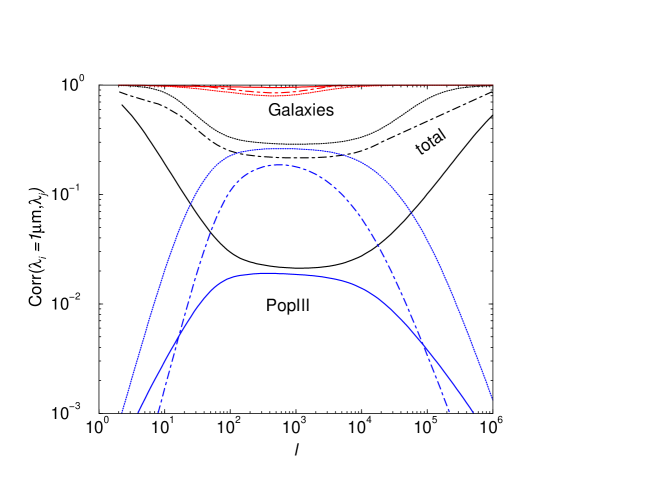
While observations in a single band, e.g., K-band, is useful to understand Pop III clustering, this can be better achieved with multiwavelength data as different channels can be combined to study clustering in each band and between bands. In Fig. 5, as an illustration, we show the correlation coefficient related cross wavelength power spectra. This correlation coefficient is defined as
| (22) |
under the assumption that the Pop III sources follow our most optimistic assumptions (model A) and that the foreground galaxies are removed out to a redshift of 1. As shown, the total correlation coefficient ranges near unity at large angular scales, decreases at tens of arcminute scales, and increases back to almost unity at small angular scales. If the Pop III contribution were to be non-existent, the correlation coefficient would be more uniform while the decrease in the correlation at arcminute scales is associated with the Pop III population. While an individual angular power spectra measured at each wavelength was expected to show excess clustering due to Pop III stars, the correlation coefficient from cross-power spectra is expected to show a decrease at the same angular scales.
In addition to separating foreground galaxies and background first-star contribution to spatial clustering in the infrared background, multiwavelength observations are desirable to understand additional contaminants, among which zodiacal light is important. While spatial clustering properties of zodiacal light, or dust particles responsible for this emission especially at degree angular-scales, is unknown, one expects a distinct spectral dependence to its emission given the size-distribution of dust particles. With observations at several or more frequencies in the IR band, one can make use of this expected spectral shape of the zodiacal emission to partly remove its contribution and to preform a clustering study related to the zodiacal emission separately. This is similar to what has been done in estimating the total IR background in imaging data such as with DIRBE (e.g., Kashlinsky et al. 1996). With imaging data such as from a rocket, another approach is to make use of the temporal variations related to the zodiacal emission. Since the zodiacal light is associated with micron-size particles near the Earth’s orbit, observations spread over the Earth’s orbit that span few months or more are expected to view a different dust content towards the same background sky-area at different observational epochs. This could give additional information to remove the zodiacal light, though, we emphasize that the best option to remove this contaminat is to perform multiwavelength imaging data over the IR band.
As a general consistency check on our models, instead of calculating the angular power spectrum, we also calculated the mean or the absolute background to be compared with observed results. Note that our Pop III redshift distribution follows that of Santos, Bromm & Kamionkowski (2003) and since we use the same stellar spectrum as they calculated, the Pop III star model produces the absolute background consistent with Fig. 7 of their paper, to the extent that star-formation efficiency is taken here as a free parameter, and by varying the minimum redshift at which Pop III sources are found to 7 from 10; in our fiducial description of the Pop III population, we use a some what higher minimum redshift for Pop III sources and the IR background related to this model results in an overall decrease in the Pop III contribution at wavelengths below m. Our use of a higher minimum redshift for Pop III sources is motivated by arguments related to the expected rapid transition from Pop III to Pop II sources, though, we note that based on calculations for Pop II star spectra by Tumlinson & Shull (2000), Pop II stars will continue to make a substantial contribution to the IR background and background fluctuations at lower wavelengths. In the case of foreground galaxies, our model produces less than 40% of the background at 2 m; this is consistent, though potentially higher than, estimates based on galaxy number counts (Cambrésy et al. 2001). Note that a significant fraction of this contribution comes from sources at redshifts below 2 and, as expected from studies involving source counts, we expect galaxies out to redshift 2 to be the dominant confusion for a study such as this and the extent to which such galaxies can be removed from the data will determine the ability to extract Pop III clustering excess in the surface brightness fluctuations.
In order to consider the extent to which our clustering predictions are consistent with prior results, we compare our angular power spectra based on predictions with COBE DIRBE measurements, as a function of wavelength, by Kashlinsky, Mather & Odenwald (1996). These authors presented a measurement of , the correlation function at zero lag, or rms fluctuations at the beam scale, at several wavelengths and using a top-hat filtered maps. This quantity can be calculated from our power spectra using the fact that
| (23) |
where is the top-hat window function and is the angular scale of filtering. We summarize our results in Fig. 6, where we plot for the three cases involving galaxies and Pop III sources (with and 1), and a comparison to COBE DIRBE measurements at 1.25, 2.2, 3.5 and 4.9 m. Note that, in general, our model predictions, even at the optimistic end for Pop III sources, suggest at least an order of magnitude lower values for than measured. The prediction based on galaxies alone is similar and is consistent with previous estimates (e.g., Kashlinsky et al. 1996). While we have some freedom to fit rest of the data by varying our model parameters, we have not attempted to perform such an analysis here. The Pop III sources, if at the low end of our prediction, suggest roughly three orders of magnitude smaller contribution to clustering seen in DIRBE data.
For comparison, in Fig. 6, we also show results related to the fluctuation analysis in IRTS data as a function of the wavelength in the IR regime. These fluctuation measurements are made at the IRTS beam scale of 8 arcmins by 20 arcmins, which probes slightly smaller angular scales than the DIRBE measurements shown in Fig. 6. There is considerable agreement, however, between DIRBE measurements and IRTS. It is unclear if these excess fluctuations are due to the shot-noise associated with unresolved galactic stars, due to the large beams of these experiments, or an additional extra-galactic component. Note that these observations probed large angular scales, while a substantial contribution from the Pop III population is expected at tens of arcminute scales and, thus, these data do not necessarily aid in understanding the extent to which first stars are an important source of spatial fluctuations in IR wavelengths. In future expriments attempting to study Pop III clustering, sufficient angular resolution to measure and remove bright stars and galaxies is essential.
Instrumental Characteristics: ASTRO-F
Band
F
(m)
(arcsec)
Jy (5-)
(nW m-2 sr-1)
K
1.8-2.7
1.46
1.3
14.5
L
2.7-3.7
1.46
1.2
15.6
M
3.7-5.1
1.46
1.9
17.6
NOTES.—The sensitivity, F, and noise-per-pixel, , is based on 500 seconds of integration per pointing.
The Near Infra-Red Camera (NIRC) of the ASTRO-F mission contains arrays of 512 412 pixels with an effective
area of 102 arcmin2 per pointing. See, Watari et al. (2000) for more details.
Instrumental Characteristics: Rocket-Borne Experiment
Band
F
(m)
Jy (5-)
(nW m-2 sr-1)
J
1.25
0.24
530
7.5
H
1.65
0.17
325
6.5
K
2.2
0.16
205
4.4
L
3.5
0.26
134
1.8
NOTES.—The sensitivity, F, and noise-per-pixel, , assumes an useful integration time of 200 seconds.
The pixel size is 15′′.’
With pixel array formats of 1024 1024, observations cover a field of view of 4.27 degrees.
3. Reconstructing the Star Formation History
Since the Pop III redshift distribution is expected to closely follow the star formation history at redshifts between 10 and 30 or so, the anisotropy power spectrum of the IRB can be used to extract information on the star formation history, under the assumption of certain aspects related to the source clustering and the spectrum. For this purpose, we make use of multi-frequency measurements including the cross power spectra between frequencies. To understand the extent to which star formation history can be studied with IRB fluctuations, we make use of the Fisher information matrix
| (24) |
whose inverse provides the optimistic covariance matrix for errors on the associated parameters (e.g., Tegmark et al. 1997). In Eq. 24, is the likelihood of observing data set , in our case the angular power spectrum, given parameters involved in describing this data. Respecting the Cramér-Rao inequality (Kendall & Stuart 1969), no unbiased method can measure the ith parameter with standard deviation less than if all other parameters are known exactly, and less than if other parameters are estimated from the data as well.
For the present case involving ’s of the IRB, we can write
| (25) |
where is the fraction of sky area covered by the imaging observations. Here, denotes derivatives of the power spectra matrix, , with respect to the parameter at each multipole and is the fractional sky coverage of the observations. This matrix can be written as
| (26) |
where index labels all contributions to the power spectrum and is the instrumental noise contribution to the observations. Here, we assume that the noise contribution between maps is uncorrelated. In terms of individual components of the power spectrum (ie. signal), we include contributions from the Pop III stars (which is considered to be the primary component of astrophysical interest) and the foreground galaxies. The clustering properties of zodiacal light is unknown and may be a major source of uncertainty in studies of early star formation with IRB fluctuations, but due to the unknown properties related to its spatial clustering, we do not consider its impact in this estimate. More over, the proposed multiwavelength data may allow us to reduce the confusion related to the zodiacal emission.
In terms of parameters of interest, we study how well can be studied with clustering information. We split this quantity in four redshift bins in the range of 10 to 30 and extract the star-formation rate in those bins. Note that, in the strictest sense, what one extracts is which includes Pop III spectrum information and halo bias in addition to the star-formation rate. Here, for simplicity, we assume that both the spectrum and halo bias is known though one can constrain a combined quantity instead, if these latter two parameters are assumed to be unknown. Note the, in general, the spectrum, or at least the shape of the spectrum with an arbitrary normalization, can be assumed to be known apriori.
We calculate the Fisher matrix to a maximum of 5000 such that the clustering of Pop III stars is in the linear regime (2-halo term) and is not shot-noise dominated (as shown in Fig. 3, we do not expect the Pop III shot-noise domination to be important until 104). In addition to the astrophysical parameters related to the star-formation rate, we also include cosmological parameters that define the linear matter power spectrum, mainly the power spectrum normalization, tilt, and . We set priors for these parameters as known from current WMAP results and its extension related to information from other large scale structure surveys. This information, in general, leads to a power spectrum at accuracy at the level of few percent and is not a source of major concern for these studies.
We summarize our results in Fig. 7, where we plot the star formation rate of the Pop III population and reconstructed errors on this rate based on clustering information for the parameters as tabulated in Table 1. We assume a total number of 5122 pixels per band and consider two pointings with each pointing of 4.3 degrees field of view. At redshifts or order 10, where most of the Pop III contribution arises, the star formation rate is constructed with accuracies of order 0.2 Msun yr-1 Mpc-3 while at higher redshifts, 30, the clustering information is no longer sensitive to the star formation rate due to the decrease in fractional distribution of Pop III stars at such high redshifts.
Note that we have assumed Pop III sources follow the optimistic model with a clustering angular power spectrum given by the upper curve shown in Fig. 4. If clustering were to be lower, then the reconstructed star formation errors increase. In such a scenario, observations with ASTRO-F can be used to investigate the existence of Pop III clustering at arcminute scales to a lower flux level with a better removal of the foreground galaxies that may confuse the detection of Pop III sources.
4. Summary
The recent results related to cosmic microwave background (CMB) anisotropies suggest that the universe was reionized at a redshift around 17 with an optical depth for electron-scattering of 0.17 0.04. Such an early reionization could arise through the ionizing radiation emitted by metal-free population III stars at redshifts of 15 and higher. We discuss the contribution to the infrared background (IRB) surface brightness anisotropies from such a generation of early star formation. We have shown that the spatial clustering of these stars at tens of arcminute scales can potentially generate a significant contribution to the angular power spectrum of the IRB.
Note that measurements of IRB spatial clustering already indicate both an overall excess (e.g., Kashlinsky et al. 1996) and a specific excess at 100 arcmin scales (Matsumoto 2000, 2001) when compared to other angular scales. The models based on a contribution from Pop III stars indicate that one should expect a clustering excess at few tens of arcminutes related to the overall projection of the linear power spectrum at redshifts between 10 and 30. While the amplitude of the clustering excess is model dependent, the angular scale at which this clustering is expected is more precise given that it is simply a reflection of the projected linear power spectrum at redshifts of 10 to 30. The direct detection of the amplitude of clustering excess, as a function of wavelength, can be used as a measure of the Pop III starformation rate, under the assumption of a spectrum and clustering bias, or the combined quantity involving the star-formation rate and bias weighted by the source flux. As an initial attempt in this direction, we have considered the astrophysical uses of a wide-field camera optimized for the detection of the first star signature and have suggested that studies related to Pop III stars can be further improved with near-infrared observations with the upcoming ASTRO-F mission. The best opportunity to study Pop III stars via IRB spatial fluctuations will come from a combined analysis of ASTRO-F and wide-field rocket-borne data in the same area on the sky. The higher resolution data from ASTRO-F can be used to clean low resolution, but significantly wider field of view, data from the rocket experiment, such that clustering studies can be extend even below our pessimistic level of the Pop III clustering considered.
Acknowledgments: This work is supported by the Sherman Fairchild foundation and DOE DE-FG 03-92-ER40701 (AC), and by a NSF Astronomy and Astrophysics Postdoctoral Fellowship (BK). AC thanks the Aspen Center for Physics for hospitality while this work was initiated. We thank Mike Santos for providing us with Pop III spectra and for useful discussions, Sasha Kashlinksy for an electronic table of the 2MASS power spectrum and details regarding this measurement, Aparna Venkatesan for useful comments and suggestions, and an anonymous referee for helpful suggestions.
References
- (1) Abel, T., Bryan, G. L., & Norman, M. L. 2000, ApJ, 540, 39
- (2) Abel, T., Bryan, G. L., & Norman, M. L. 2002, Science, 295, 93
- (3) Bromm, V., Coppi, P. S., & Larson, R. B., 1999, ApJ, 526, L5
- (4) Bromm, V., Coppi, P. S., & Larson, R. B., 2002, ApJ, 564, 23
- (5) Bullock, J. S., Wechsler, R. H. & Somerville, R. S. 2002, MNRAS, 329, 246
- (6) Cambrésy, L., Reach, W. T., Beichman, C. A. and Jarrett, T. H. 2001, ApJ, 555, 563
- Cen (2003) Cen, R., 2003, ApJ, 591, 12
- (8) Cooray, A., & Sheth R. 2002, Physics Reports, 372, 1
- (9) Cooray, A., Hu, W., Huterer, D. & Joffre, M. 2001, ApJ, 557, L7
- (10) Cooray, A., et al. 2003, in preparation
- (11) Daddi, E., Rottegering, H. J. A., Labbé, I. et al. 2003, ApJ, 588, 50
- (12) Eisenstein, D.J. & Hu, W. 1999, ApJ, 511, 5
- (13) Fan, X., Narayanan, V. K., Strauss, M. A. et al. 2002, AJ, 123, 1247
- (14) Fukugita, M. & Kawasaki, M. 2003, preprint (astro-ph/0303129)
- (15) Gardner, J. P., Sharpless, R. M., Frenk, C. & Carrasco, B. 1997, ApJ, 480, L99
- Hauser & Dwek (2001) Hauser, M. & Dwek, E. 2001, ARAA, 39, 249
- Jimenez & Kashlinsky (1999) Jimenez, R. & Kashlinksy, A. 1999, ApJ, 511, 16
- Kashlinsky et al. (2002) Kashlinsky, A., Odenwald, S., Mather, J., Skrutskie, M., & Cutri, R. 2002, ApJ, 579, L53
- Kashlinsky & Odenwald (2000) Kashlinsky, A. & Odenwald, S. 2000, Science, 289, 246
- Kashlinsky et al (1996) Kashlinsky, A., Mather, J. C. & Odenwald, S. 1996, ApJ, 473, L9
- Kashlinsky et al (1999) Kashlinsky, A., Mather, J. C. & Odenwald, S. 1999, astro-ph/9908304
- (22) Kashlinsky, A., Mather, J. C., Odenwald, S. & Hauser, M. 1996, ApJ, 470, 681
- Kendall & Stuart (1969) Kendall, M. G. & Stuart, A. 1969. The Advanced Theory of Statistics, Vol. II (Griffin: London).
- (24) Knox, L., Cooray, A., Eisenstein, D. & Haiman, Z. 2001, ApJ, 550, 7
- (25) Kogut, A. et al. 2003, ApJ submitted (astro-ph/0302213)
- (26) Lagache, G., Dole, H. & Puget, J.-L. 2003, MNRAS, 338, 555
- (27) Limber, D. 1954, ApJ, 119, 655
- (28) Madau, P., & Pozzetti, L. 2000, MNRAS, 312, L9
- (29) Magliocchetti, M., Salvaterra, R., & Ferrara, A. 2003, MNRAS, 342, L25
- (30) Matsumoto, M. 2000 in “ISO Surveys of a dusty Universe”, eds. Lemke, D. et al. p.96
- (31) Matsumoto, M. 2001 in “The extragalactic infrared background and its cosmological implications”, IAU Symposium 204, eds. Martin Harwit and Michael G. Hauser, p. 101
- (32) Mo, H. J., White, S. D. M. 1996, MNRAS, 282, 347
- (33) Mo, H. J., Jing, Y. P., White, S. D. M. 1997, MNRAS, 284, 189
- (34) Navarro, J., Frenk, C., White, S. D. M., 1996, ApJ, 462, 563 [NFW]
- (35) Odenwald, S., Kashlinsky, A., Mather, J. C., Skrutskie, M. F. & Cutri, R. M. 2003, ApJ, 583, 535
- (36) Oh, S.-P., Haiman, Z. & Rees, M. J. 2001, ApJ, 553, 73
- (37) Oh, S.-P., Cooray, A., & Kamionkowski, M. 2003, MNRAS, 342, L20
- (38) Peacock, J.A., Dodds, S.J. 1996, MNRAS, 280, L19
- (39) Pearson, C. P., Matsuhara, H., Onaka, T., Watarai, H. & Matsumoto, T. 2001, MNRAS, 324, 999
- (40) Press, W. H., Schechter, P. 1974, ApJ, 187, 425 [PS]
- (41) Salvaterra, R. & Ferrara, A. 2003, MNRAS, 339, 973
- (42) Santos, M. R., Bromm, V., & Kamionkowski, M. 2002, MNRAS, 336, 1082
- (43) Saracco, P., Giallongo, E., Cristiani, S. et al. 2001, A&A, 375, 1
- (44) Silva, L., Granato, G. L., Bressan, A., Danese, L. 1998, ApJ, 509, 103
- (45) Song, Y.-S., Cooray, A., Knox, L., Zaldarriaga, M. 2003, ApJ, 590, 664
- (46) Spergel, D. N., Verde, L., Peiris, H. V. et al. 2003, ApJ in press (astro-ph/0302209)
- (47) Sunyaev, R.A. & Zel’dovich, Ya. B. 1980, MNRAS, 190, 413
- Tegmark et al (1997) Tegmark, M., Taylor, A. & Heavens, A. 1997, ApJ, 480, 22.
- (49) Totani, T., Yoshii, Y, Iwamuro, F., Maihara, T. & Motohara, K. 2001a, ApJ, 550, L137.
- (50) Totani, T., Yoshii, Y, Iwamuro, F., Maihara, T. & Motohara, K. 2001a, ApJ, 558, L87.
- Tumlinson & Shull (2000) Tumlinson, J. & Shull, J. M. 2000, ApJ, 528, L65
- Tumlinson et al (2001) Tumlinson, J., Giroux, M. L. & Shull, M. J. 2001, ApJ, 550, L1
- Tumlinson et al (2003) Tumlinson, J., Shull, M. J., & Venkatesan, A. 2003, ApJ, 584, 608
- (54) Venkatesan, A., Tumlinson, J. & Shull, M. J. 2003, ApJ, 584, 621
- (55) Watarai, H. et al. 2000, in “UV, Optical and IR Space Telescopes and Instruments”, ed. J. B. Breckinridge, Proc. SPIE 4013, 59
- (56) Wright, E. L. & Johnson, B. D. 2001, preprint (astro-ph/0107205)
- (57) Wyithe, S. & Loeb, A. 2003, ApJ in press (astro-ph/0302297)
- (58) Xu, J., Bock, J. J., Ganga, K. M., et al. 2002, ApJ, 580, 653