Chapter 1 The Lateral Distribution Function of Shower Signals in the Surface Detector of the Pierre Auger Observatory
Abstract
The surface detector (SD) array of the southern Pierre Auger Observatory will consist of a triangular grid of 1600 water Cherenkov tanks with 1.5 km spacing. For zenith angles the primary energy can be estimated from the signal S(1000) at a distance of about 1000 m from the shower axis, solely on basis of SD data. A suitable lateral distribution function (LDF) S(r) is fitted to the signals recorded by the water tanks and used to quantify S(1000). Therefore, knowledge of the LDF is a fundamental requirement for determining the energy of the primary particle. The Engineering Array (EA), a prototype facility consisting of 32 tanks, has taken data continuously since late 2001. On the basis of selected experimental data and Monte Carlo simulations various preliminary LDFs are examined.
1. Introduction
High energy cosmic rays (CRs) are detected via the extensive air showers (EAS) they produce in the Earth atmosphere. Direction (,), energy (E) and mass of the primary CR are reconstructed from the secondary particles in the shower. The arrival times of shower particles at various detector locations give information on the arrival direction. The overall number of secondaries at observation level scales roughly with primary energy, and the form of the shower depends to some extent on the primary mass. In the Auger experiment the longitudinal shower development is measured by the Fluorescence Detectors (FD) while the lateral distribution at ground level is recorded by the SD, providing two independent measurements of the shower geometry and primary energy. The event reconstruction is hampered by the coarse sampling of the shower particles and by the statistical fluctuations of the shower development. High-developing showers are expected to have a flat lateral distribution, low-developing showers produce steeper lateral distributions. Fortunately, at about 1 km core distance the signal is virtually independent of primary mass and shower fluctuations, and is a good measure for the primary energy. Thus, the energy reconstruction requires, as a first and crucial step, to estimate S(1000) from few measured signals at various distances from an a priori unknown core position. A second step is then to determine E from S(1000), which relies to a large extent on shower simulations and is therefore model dependent [1]. We do not discuss the energy calibration of the SD here. Since most of the Auger events have rather few SD stations hit, the reconstruction of the shower is not trivial. The functional form of an LDF, S(r), and its parameters, varies with , energy and mass, and its determination requires a good estimate of the core position, which in turn requires a reliable reconstruction of the shower direction, which relies on a precise time measurement and stable trigger performance. The estimation of S(1000) (and thus E) can be greatly improved if the shape of the LDF is known. Here we present various approaches to determine the LDF from experimental data and MC simulations.
2. Probing various LDFs
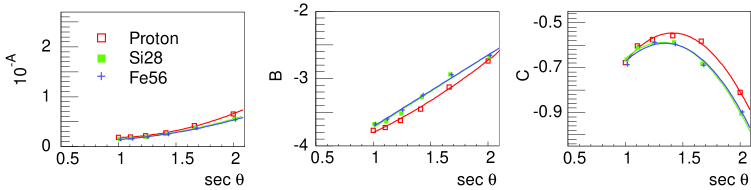
In contrast to S(1000) the shape of the lateral distribution does not change much with energy. Therefore, it makes sense to decouple the normalisation constant from the shape parameters of an LDF and to combine showers of different energies. Simulations of EAS with AIRES/QGSJET01 in the range E = 1-100 EeV and for - have been performed for the Auger experiment and their output was processed through a response simulation of detectors at core distances 200-2500 m [2]. The LDF, in units of vertical equivalent muons (VEM), was parametrised with an empirical function of the form with and the parameters A, B and C were determined as function of (see fig. LABEL:008118-1:fig-pb).
Independent from simulations, the LDF was also deduced from experimental data. The EA was operating in very stable conditions during the period May to November 2002. Therefore data from this period have been used for the following analysis. High-quality events have been selected, which had a successful directional reconstruction with , signals above 3 VEM in at least 6 stations and a core position inside the EA. High-multiplicity events are very rare: only of the events have 6 or more stations above threshold. Each event was examined and events or stations with obvious problems were removed from the sample. A few well defined events are better to determine the LDF than many events of lower quality. The following LDFs have been investigated: (i) a simple power law with a dependent index , (ii) an NKG-type function: with and m***Since and are strongly correlated, we have fixed m and left to vary., and (iii) the MC inspired LDF . These forms were fitted to individual events using a maximum likelihood fit of core location and LDF at the same time. Silent (i.e. alive but no signal above threshold) and saturated stations are properly included in the fit. The error of a signal S (in VEM) is taken from an analysis [4] of data from a closely positioned detector pair. For
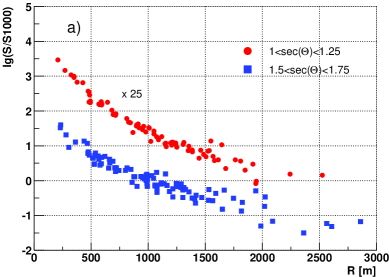
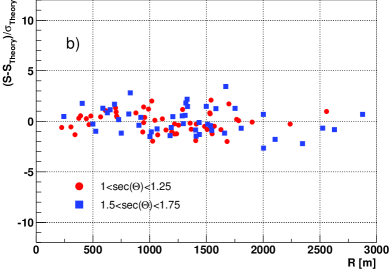
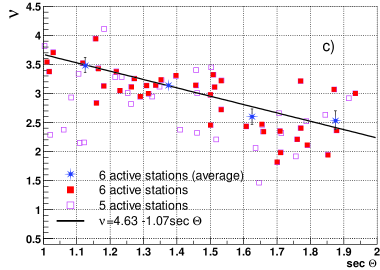
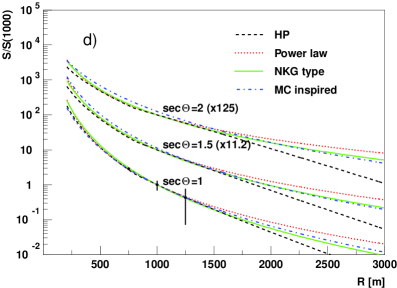
the power law and the NKG-type LDFs two analyses were performed. First, in a two-parameter fit, the slope parameters and , resp., have been varied together with the scale factor S(1000). Then a parameterisation of and as function of was determined, which was then used in a second analysis with only fitting S(1000). Fig. LABEL:008118-1:fig-ldfa) shows the measured LDF (divided by S(1000)) for two zenith angles when the power law assumption is used for the core finding. To quantify the quality of the fit, residuals as a function of are formed (see fig. LABEL:008118-1:fig-ldfb)). For a good LDF the residuals should scatter for all symmetrically around 0 with a variance of 1. Means and standard deviations of the distribution of the residuals are used to compare different LDFs. For the power law fit the fitted values on are shown as function of in fig. LABEL:008118-1:fig-ldfc). It is evident that higher-multiplicity events have a smaller scatter. A line is fitted to the averages (stars) of the full symbols that yields . With the dependence of fixed, the only fit parameter left for the LDF fit is S(1000), leading to more stable fit results for low multiplicity events. In the same way for the NKG function the variation of was found: . Fig. LABEL:008118-1:fig-ldfd) shows that the three chosen LDFs, with suitably adapted parameters, agree well within the experimental errors. For completeness also the Haverah Park LDF [3] is shown, that predicts smaller densities at large core distances.
3. Results
The moments of the residual distributions from experimental data including silent stations obtained with different LDFs are listed in table LABEL:008118-1:tab-res There is no major bias apparent and all the distributions have about the same widths, which indicates that all three LDFs describe well the data presently available.
| Nevt with | power law | NKG | MC | |||||||||
|---|---|---|---|---|---|---|---|---|---|---|---|---|
| range | # stations | free | fixed | free | fixed | |||||||
| m | m | m | m | m | ||||||||
| 21 | 11 | -0.05 | 0.50 | -0.11 | 0.65 | -0.03 | 0.49 | -0.05 | 0.57 | -0.14 | 0.66 | |
| 18 | 9 | -0.07 | 0.61 | -0.07 | 0.62 | -0.02 | 0.53 | -0.05 | 0.57 | 0.06 | 0.93 | |
| 18 | 12 | -0.05 | 0.65 | -0.04 | 0.73 | -0.03 | 0.63 | -0.02 | 0.71 | 0.02 | 0.80 | |
| 12 | 8 | -0.08 | 0.83 | -0.15 | 1.15 | -0.11 | 1.13 | -0.10 | 1.17 | -0.15 | 1.29 | |
Previous experiments have shown that a pure power law cannot describe the shower signals at large core distances [3]. The results presented here are still preliminary as the statistics of events from the Auger EA, especially for energies eV, are small and since preliminary algorithms for directional and core reconstruction are used. In future each improvement on the statistics, angular and core resolution, and specifically hybrid events with their superior geometric reconstruction, will also improve the knowledge on the LDF and permit finer details to be analysed.
1. Billoir P., Auger Collaboration internal note, GAP 2002-075
2. Billoir P., Da Silva P., Auger Collaboration internal note, GAP 2002-073
3. Coy R.N. et al., Astrop. Phys. 6 (1997) 263
4. Yamamoto T. for the Auger Collaboration, these proceedings