THE INTERNAL ULTRAVIOLET–TO–OPTICAL COLOR DISPERSION: QUANTIFYING THE MORPHOLOGICAL –CORRECTION
Abstract
We present a quantitative measure of the internal color dispersion within galaxies, which quantifies differences in galaxy morphology as a function of observed wavelength. We apply this statistic to a sample of local galaxies with archival images at 1500 Å and 2500 Å from the Ultraviolet Imaging Telescope, and ground–based –band observations in order to investigate how the internal dispersion between these colors relates to global galaxy properties (e.g., luminosity, color, morphological type). In general, the dispersion in the internal galaxy colors correlates with transformations in the galaxy morphology as a function of wavelength, i.e., our internal color dispersion statistic quantifies the morphological –correction. Mid–type spiral galaxies exhibit the highest dispersion in their ultraviolet–to–optical internal colors, which stems from differences in the stellar content that constitute the bulge, disk, and spiral–arm components. Irregulars and late–type spirals show moderate internal color dispersion, although with lower values relative to the mid–type spirals. This implies that young stars generally dominate the ultraviolet–to–optical galaxy colors, modulo variations in the dust, gas, and stellar distributions. Ellipticals, lenticulars, and early–type spirals generally have low or negligible internal color dispersion, which indicates that the stars contributing to the ultraviolet–to–optical emission have a very homogeneous distribution. We discuss the application of the internal color dispersion to high–redshift galaxies in deep, Hubble Space Telescope images. By simulating the appearance of the local galaxy sample at cosmological distances, many of the galaxies have luminosities that are sufficiently bright at rest–frame optical wavelengths to be detected within the limits of the currently deepest near–infrared surveys even with no evolution. Under assumptions that the luminosity and color evolution of the local galaxies conform with the measured values of high–redshift objects, we show that galaxies’ intrinsic internal color dispersion remains measurable out to .
1 Introduction
The distribution of galaxy morphology in the local Universe contains the imprints of the processes of galaxy formation and evolution. Indeed, the fact that galaxy morphology correlates with physical parameters (such as optical size, luminosity, surface brightness, total stellar/gas–mass, etc.) implies that the stages of the morphological sequence are intertwined with the assembly of the galaxies’ stellar populations (e.g. Roberts & Haynes, 1994). Locally, galaxies are classifiable in terms of the well–known “Hubble Sequence”, which seems to apply even to moderately high redshifts (; Schade et al. 1995; Lilly et al. 1998; Dickinson 1999; Simard et al. 1999; van den Bergh, Cohen, & Crabbe 2001). At still higher redshifts (), galaxies appear to undergo a transformation. Galaxies at these epochs are observed to have highly irregular, or centrally compact morphologies (e.g., Giavalisco, Steidel, & Macchetto, 1996), and the Hubble Sequence seems to no longer apply (van den Bergh, 2002). However, galaxy morphological classification has been calibrated by their appearances at rest–frame optical wavelengths, which, for the case of the high–redshift galaxies, is only possible using near–infrared images. To investigate the evolution of galaxy morphology at high redshifts using optical–to–near-infrared surveys, one must comprehend how the appearance of galaxies at rest–frame ultraviolet (UV)–to–optical wavelengths relates to the processes of galaxy evolution.
The degree to which the observed rest–frame UV morphology of a galaxy corresponds to that in the rest–frame optical is a function of galaxy spectral type. Recent work has broadly concluded that a galaxy appears as a later–type system when observed in the UV relative to the optical (i.e., the morphological –correction; see Bohlin et al. 1991; Giavalisco et al. 1995; Marcum et al. 2001; Kuchinski et al. 2000, 2001; Windhorst et al. 2002, and references therein). This effect is attributed to the fact that the rest–frame far–UV (FUV, Å) light stems primarily from the young O– and B–type stars, whereas stars of later type (A–type and later) contribute increasingly at mid–UV (MUV, Å) and redder wavelengths. Because bright, early–type stars have short relative lifespans, FUV observations are generally sensitive to recent star formation events, while longer–lived, later–type stars trace past star–formation episodes, now only evidenced by an older stellar population. Young, bright OB–star complexes tend to dominate the spectral energy distributions (SEDs) at UV–to–optical wavelengths in late–type spiral and irregular galaxies that are actively forming stars. As such, the morphological appearances of these galaxies exhibit only a weak (or nonexistent) dependence on UV/optical wavelength. Conversely, the morphological –correction can be much more pronounced in early–to–mid-type spirals. Older stars dominate the optical portion of the SED in these galaxies, and the UV emission originates in rather sparse regions of ongoing star–formation, normally confined to the spiral arms. When observed at UV wavelengths, light from the older stars disappears and the galaxy takes on the appearance of a later–type system. Lastly, it is noteworthy that elliptical and lenticular galaxies usually exhibit weak morphological –corrections. The distribution of stellar populations in these systems is generally very homogeneous. These galaxies typically have low specific star–formation rates (i.e., star–formation rate per unit stellar mass), and any UV emission in present–day early–type galaxies usually stems from late evolutionary stages of late–type stars that are well mixed with the underlying stellar populations111In a certain phase of the post–Main–Sequence evolution, later–type Horizontal–Branch (HB) stars can eject the bulk of their photospheres, forming planetary nebulae, and thus expose the hot, bright cores, which do radiate in the FUV. These stars are indicative of older stellar populations (ages greater than several Gyr) and are responsible for producing this “UV–upturn” (also called the UV excess) in early–type galaxies (e.g. Dorman, 0’Connel, & Rood, 1995; Brown et al., 2000). Note that such galaxies have low FUV–to–optical flux ratios, (Dorman et al. 1995; converted to the AB magnitude system, see § 2), which is much weaker than the values for star–forming galaxies. , although certain examples of early–type galaxies with significant star formation do exist and appear as later–type systems when viewed at rest–frame UV wavelengths (see, e.g., Marcum et al., 2001).
Many investigations of the galaxy morphological evolution have focused on the relationship between structural parameters and quantitative indexes as a function of galaxy luminosity, colors, and Hubble type (e.g., Schade et al., 1995; Abraham et al., 1996, 1999; van den Bergh, et al., 1996; Lowenthal et al., 1997; Brinchmann et al., 1998; Marleau & Simard, 1998; Lilly et al., 1998; Simard et al., 1999; Conselice et al., 2000; Menanteau, Abraham, & Ellis, 2001). However, studying this evolution as a function of redshift is hampered due to effects arising from the morphological –correction. For example, Giavalisco et al. (1995) artificially redshifted local galaxies, spanning a range of Hubble type using FUV images from the Ultraviolet Imaging Telescope (UIT), and demonstrated that these broadly reproduce the observed morphology of the faint galaxies in optical images from the Hubble Space Telescope (HST; see also Bohlin et al., 1991). Thus, Giavalisco et al. suggested that dynamical evolution may only have played a minor role in the galaxies’ evolutionary histories and argued caution when interpreting the faint–blue–galaxy population in the context of galaxy–evolution scenarios. These conclusions have been elaborated upon by Kuchinski et al. (2001), who preformed very detailed simulations of artificially redshifting UIT/FUV images of a larger sample of local galaxies into the HST/WFPC2 data for the Hubble Deep Field North (HDF–N; Williams et al., 1996). Kuchinski et al. concluded that effects arising from bandshifting dominate the morphological –correction, and surface–brightness dimming induces small (but non-negligible), seemingly random changes into quantitative morphological parameters. Thus, comparing the rest–frame UV morphologies of the high–redshift galaxy population to those in optical images of local galaxies does not likely provide a homologous comparison sample.
Additional insights — beyond those possible from single–band morphology studies — can be obtained by investigating the distribution and morphology of internal colors and color gradients within individual galaxies. In a novel study, de Jong (1996) showed that the color gradients observed in local spiral galaxies are likely the result of a combination of stellar age and metallicity effects, with the outer disk regions being bluer and having lower metallicity. Abraham et al. (1999) and Menanteau et al. (2001) investigated the internal colors of galaxies in the HDF–N and HDF–S using the HST WFPC2 four–color data to study variations in the star–formation histories of field galaxies. For example, Menanteau et al. observed a significant fraction of galaxies in the field population with strong internal color variations, which they interpreted as evidence for recent star formation and argued that (field) elliptical and bulge–dominated galaxies have continued to assemble their stellar populations since . In contrast, elliptical galaxies in rich clusters exhibit relatively lower internal color variation, which argues that color variations in early–type galaxies have a strong environmental dependence, where evolution is accelerated in the densest environments (i.e., enhanced star formation at earlier epochs). The broad conclusion from these studies is that the synthesis of galaxy internal colors provides insights into the spatial distribution of the underlying stellar populations, and thus into the processes of star formation in the galaxies (see also, Bell & de Jong, 2001; Gadotti & dos Anjos, 2001; Eskridge, et al., 2003).
In this paper, we develop a statistic to measure the morphological difference between galaxy images in two bandpasses. As reviewed above, the wavelength dependence of morphology has often been previously described in qualitative terms. Here, we aim to provide a simple, quantitative measure of morphological difference between images at different wavelengths that can be applied, for example, to HST images of distant galaxies. Our statistic quantifies the amplitude of the morphological differences or the variations in internal galaxy colors, without describing the spatial organization of those variations. Some other measurements, such as color gradients (see references above), emphasize the organization of color differences. Ours is, in a sense, cruder than a structural quantity like a color gradient, but it can be measured in a simple, automated, and model independent fashion, and provides a straightforward measure of the degree to which stellar–population or extinction variations within a galaxy affect the relative morphologies seen at two wavelengths. Furthermore, because our statistic is integrated over a whole galaxy, it is robustly measurable for even faint, distant galaxies with relatively low, signal-to-noise ratios.
Here, we focus on the internal color dispersion for a sample of local galaxies using UIT/UV and ground–based optical data, and compare this to their morphological features and integrated properties. In a forthcoming paper (Papovich et al., 2003; Paper II), we apply this diagnostic to samples of high–redshift galaxies at and using the HST UV–to–near-infrared data for the HDF–N. An advantage of using the UIT and –band data for the local galaxy sample is that they probe nearly equal rest–frame wavelengths as the HST data available for the high–redshift HDF–N galaxies. Therefore, we can use the results here as a baseline for interpretation of the processes affecting the observations of the higher redshift galaxies.
It is useful at this point to postulate various properties that could produce or suppress a galaxy’s internal color dispersion. Because we focus on UV/optical wavelengths, we expect that the internal color dispersion should be sensitive to the degree of heterogeneity in the relative composition and spatial distribution of a galaxy’s young and more aged stars. Small values of the internal color dispersion could indicate several scenarios. For example, all stars in a galaxy could be old (with little UV emission), with small scatter in their ages and colors. Alternatively, either a coeval stellar population could dominate the light for all UV/optical wavelengths, or the galaxy could contain a mixed–aged stellar population with a homogeneous distribution, e.g., the stars could be well–mixed following a merger event, or after several dynamical timescales within a galactic disk. These scenarios likely apply to ellipticals, lenticulars, and early–type spirals, and thus one may expect these types of objects to exhibit low internal color dispersion. Small dispersion in a galaxy’s internal colors could also signify that a substantial young stellar population with fairly uniform colors dominates the UV/optical galaxy colors, with the light from other (older) stellar populations lost in the “glare” of the nascent stars. This case is arguably relevant for late–type irregular and starbursting galaxies. Conversely, a large internal color dispersion in these colors probably requires both a range of stellar population ages (or a highly inhomogeneous distribution of dust extinction) and spatial inhomogeneity. This description plausibly predicts that mid–type spirals — with non–coeval stellar populations in the bulge/disk/spiral–arm components — should display the greatest internal UV/optical–color dispersion. Therefore, our definition of a galaxy’s internal color dispersion has the potential to quantify the prominence of these morphological features, and should vary as a function of morphological type.
The outline for the remainder of this article is as follows. In §2, we discuss the data used and the selection of the sample of local galaxies. In §3, we introduce the internal color dispersion statistic and demonstrate its robustness against changes in object signal–to–noise ratio (S/N). We then discuss the application of this measure to the local galaxy sample. In §4, we compare the measured internal color dispersion values to other galaxy properties to investigate those processes to which this metric is sensitive. In §5, we discuss the application of this diagnostic to high–redshift galaxy populations by artificially redshifting galaxies from the local sample and inserting them into deep HST images. Finally, in §6, we present a summary of this work. Unless otherwise specified, all magnitudes in this paper are presented on the AB system (Oke, Gunn, & Hoessel, 1996), where . Throughout this work we use a flat, cosmological–constant–dominated world model, , , and a Hubble constant of km s-1 Mpc-1.
2 The Data and Galaxy Sample
We have selected nearby galaxies for which there exist archival imaging available at FUV, MUV, and optical (i.e., –band) wavelengths. The FUV and MUV data used here were collected by the UIT aboard the ASTRO–1 space–shuttle mission in 1990.222All UIT data were obtained from the Multimission Archive at Space Telescope (MAST), http://archive.stsci.edu The UIT mission included two cameras sensitive to a combined wavelength range roughly Å (see Stecher et al. 1997 for a presentation of the characteristics of the UIT instrument and data reduction/calibration). We have restricted our analysis to those UV images obtained from the two broad UIT bandpasses: FUV, UIT/B1, Å, Å; MUV, UIT/A1, Å, Å. The UIT instrument was flown on a second shuttle mission in 1995, ASTRO–2, but the MUV camera failed to activate on orbit. Thus, only FUV data is available from the later mission. To augment the available FUV and MUV data from the ASTRO–1 mission, we have made use of publicly available ground–based optical images obtained in support of the UIT mission by Cheng et al. (1996) from telescopes at the Kitt Peak National Observatory, Cerro Tololo Inter–American Observatory, and Mount Laguna Observatory. The final UIT dataset includes 14 local galaxies that represent the range of morphological types of the local galaxy population (see table 2).
All the UIT images have been linearized and flat fielded as described in Stecher et al. (1997). In most cases, the data have also been corrected for geometric distortions caused in the image phototubes. For a few of the objects in our sample, a distortion–corrected image was not available from the UIT archive. For these images, we have applied a distortion correction using the IDL routine DISTWARP, which is included in the UIT–analysis software, MOUSSE, available on the world–wide web.333ftp://archive.stsci.edu/pub/astro/uit/software/ After data processing and distortion correction, the final images have a pixel scale of pixel (see Stecher et al., 1997). The UIT images are marginally oversampled: the image point–spread functions (PSFs) have a full–width at half maximum (FWHM) of and for stars within ′ of the image center (Stecher et al., 1997). Many of the UIT images suffer from scratches and other cosmetic defects from the photographic development. These were removed by hand using the IRAF444The Image Reduction and Analysis Facility (IRAF) software is provided by the National Optical Astronomy Observatories (NOAO), which is operated by the Association of Universities of Research in Astronomy for Research in Astronomy, Inc., under contract to the National Science Foundation. routine IMEDIT. The archival UIT images have been calibrated in units of flux per unit wavelength, i.e., erg s-1 cm-2 Å-1, which correspond to “ST” magnitudes (i.e., magnitudes based relative to a “flat” reference spectrum in flux per unit Ångstrom), . We have converted these to AB magnitudes (i.e., magnitudes based relative to a “flat” reference spectrum in flux per unit frequency) by comparing the magnitudes derived for a flat spectrum () source through the UIT bandpasses, using the IRAF/STSDAS555The Space Telescope Science Data Analysis System (STSDAS) is distributed by the Space Telescope Science Institute. SYNPHOT package. The resulting conversions are mag for UIT/A1 photometry, and mag for UIT/B1 photometry. Our tests have shown that adopting other plausible reference spectra (either with power–law exponent for or using the spectrum of a Vega–like star) causes negligible changes on these conversion factors (i.e., %).
The ground–based –band images were processed by Cheng et al. (1996). Images were then flux–calibrated using standard stars taken on or near the nights of the observations. Magnitudes were converted to the AB magnitude system by comparing a flat spectrum source to that of Vega through a –band passband again using the SYNPHOT package. In both the ground–based and UIT images, many of the objects contain obvious foreground stars, which were masked out and replaced by background sky pixels using the IRAF task IMEDIT.
The UIT images were registered to the ground–based images using point sources common between the UV and optical images. In several instances, the images are devoid of common point sources, in which case we aligned images using the astrometric solutions included in the image headers. All registrations were subsequently inspected by eye to ensure that similar features of the galaxies in the sample are matched between the final images. Slight misalignments (ranging from a fraction of a pixel to a few pixels) were detected and corrected while comparing the galaxy internal colors.
To investigate the quantitative morphology of galaxies with data taken through various bandpasses, it is essential that the images be matched to a common PSF. This will reduce or eliminate image–to–image variations between bandpasses resulting purely from PSF differences. For the UIT and ground–based data, we fit Moffat–profile PSFs to stars identified in the images. Moffat profiles include a term to increase the strength of the kernel in the “wings” of the PSF relative to a pure Gaussian. This is appropriate for ground–based observations as these profiles match the seeing caused by atmospheric turbulence and other observational effects (Bendinelli et al., 1990). The Moffat profile also provides an acceptable fit to the UIT PSF, which contains broader wings over a Gaussian profile (see Stecher et al. 1997). Many of the UIT B1 (FUV) images lacked point sources (as only relatively rare O and B stars are bright for Å). For these images, we used a moffat–profile fit to the average UIT/B1 PSF described in Stecher et al. (1997). For each object, we convolved the ground–based images with the UIT PSFs and vice versa in order to match the PSFs between the various images. Inspecting stars in each of the PSF–matched images, the flux profile contained by individual point sources agrees very well, with % difference out to radii ″.
In table 2, we present flux and structural properties for the 14 galaxies in the UIT sample. Columns (1) and (2) indicate the primary name (e.g., NGC ID number) and any alternate name, respectively. The galaxy morphological type, and velocity in the Galactic standard of rest (, taken from the Third Reference Catalogue of Bright Galaxies (RC3; de Vaucouleurs et al., 1991), are given in columns (3) and (4). Columns (5) and (6) indicate the assumed distance to each galaxy and associated reference. In columns (), we give the apparent –band magnitude, absolute –magnitude [using the distance measure from column (5)], and , colors, measured from elliptical apertures constructed from the galaxies’ –band radial profiles (Kron, 1980) using the SExtractor software (v2.2.2; the MAG_AUTO photometry, see Bertin & Arnouts, 1996). All the magnitudes given in table 2 for each bandpass have been corrected for Galactic extinction using the color–excess maps of Schlegel, Finkbeiner, & Davis (1998) and the Galactic extinction curve of Cardelli, Clayton, & Mathis (1989); we list the corresponding extinction in the –band in column (11). The galaxy photometry and colors derived here are generally consistent with others reported in the literature, modulo differences in the Galactic extinction used (for example, cf., Marcum et al., 2001).
| 11de Vaucouleurs et al. (1991), Third Reference Catalogue of Bright Galaxies (RC3). | Dist. | Dist. | |||||||||
|---|---|---|---|---|---|---|---|---|---|---|---|
| Name | Alt. Name | Morph. Type11de Vaucouleurs et al. (1991), Third Reference Catalogue of Bright Galaxies (RC3). | [km s-1] | [Mpc] | Ref. | [mag] | [mag] | [mag] | |||
| (1) | (2) | (3) | (4) | (5) | (6) | (7) | (8) | (9) | (10) | (11) | |
| 1 | NGC 628 | M74 | SA(s)c | 753 | 7.3 | 1 | 9.23 | -20.1 | 2.3 | 3.0 | 0.301 |
| 2 | NGC 1068 | M77 | SA(rs)b | 1144 | 16.3 | 2 | 9.61 | -21.5 | 2.4 | 3.0 | 0.145 |
| 3 | NGC 1275 | Perseus A | E0, pec | 5362 | 76.6 | 2 | 12.09 | -22.3 | 2.1 | 2.2 | 0.703 |
| 4 | NGC 1316 | Fornax A | SAB(s)0, pec | 1674 | 15.9 | 3 | 9.82 | -21.2 | 3.9 | 6.6 | 0.089 |
| 5 | NGC 1317 | Fornax B | SAB(r)a | 1822 | 15.9 | 3 | 12.01 | -19.0 | 3.2 | 3.5 | 0.089 |
| 6 | NGC 1399 | E1, pec | 1323 | 15.9 | 3 | 10.51 | -20.5 | 3.8 | 5.0 | 0.056 | |
| 7 | NGC 2146 | SB(s)ab, pec | 1035 | 14.8 | 2 | 11.17 | -19.7 | 2.8 | 5.0 | 0.415 | |
| 8 | NGC 2992 | Sa, pec | 2125 | 31.1 | 2 | 12.67 | -19.8 | 2.9 | 2.6 | 0.261 | |
| 9 | NGC 2993 | Sa, pec | 2224 | 31.1 | 2 | 12.81 | -19.7 | 0.8 | 1.5 | 0.261 | |
| 10 | NGC 3031 | M81 | SA(s)ab | 69 | 3.5 | 4 | 7.67 | -20.0 | 3.0 | 4.4 | 0.346 |
| 11 | NGC 3034 | M82 | I0 | 323 | 3.5 | 4 | 8.90 | -18.9 | 2.7 | 5.1 | 0.685 |
| 12 | UGC 06697 | Im | 6697 | 95.7 | 2 | 14.00 | -20.9 | 0.9 | 1.3 | 0.094 | |
| 13 | NGC 4321 | M100 | SAB(s)bc | 1540 | 14.1 | 5 | 10.30 | -20.4 | 2.4 | 2.8 | 0.113 |
| 14 | NGC 4486 | M87 | E0, pec | 1229 | 21.1 | 6 | 9.53 | -22.1 | 5.0 | 7.9 | 0.096 |
References. — 1. Sharina, Karachentsev, & Tikhonov 1996. 2. Distance computed from the velocity relative to the Galactic standard rest frame (column 4) and assuming a Hubble constant of 70 km s-1 Mpc-1. 3. Fornax cluster members: Freedman et al. 2001 (see also Kohle et al. 1996; Shaya et al. 1996; McMillan, Ciardullo, & Jacoby 1993). 4. Freedman et al. 1994, 2001. 5. Ferrarese et al. 1996, Freedman et al. 2001. 6. Gavazzi et al. 1998.
3 Galaxy Internal Colors
3.1 Internal Color Dispersion
To investigate the two–dimensional color structure of the galaxies, we have developed a flux–independent statistic capable of incorporating information on the internal color dispersion of a galaxy about its mean color. Here, we define the internal color dispersion as the ratio of the squared difference of image flux–intensity values about the mean galaxy color to the square of the total image flux, i.e.,
| (1) |
where and are the image flux–intensity values for each object obtained in each of two passbands. The scaling factor is the flux ratio, or integrated color, between images and , while the linear offset adjusts (if necessary) for differences in the relative background levels of the two images. In practice, we calculate these terms by minimizing the statistic, , adjusting and as free parameters (where represents the uncertainties on the image flux–intensity values).
To compute , we sum over all pixels within in single radius. Galaxy radii defined using limiting surface–brightness criteria (e.g., the Holmberg radius or the limiting isophote where the galaxy surface–brightness equals the sky brightness) are poorly defined when trying to compare a wider range of galaxy types especially at various redshifts. Here, we define the aperture size as , where is the Petrosian radius of as defined for the Sloan Digital Sky Survey (see Blanton et al., 2001, and references therein), and is defined as the ratio of the galaxy surface brightness, , averaged over an annulus of radius , to the mean surface brightness within this radius, . The Petrosian radius only depends on the surface–brightness distribution of the galaxy and is thus independent of redshift or systematics in the image calibration. The chosen aperture encompasses most of the light from the galaxy without adding excessive background light, and has been used to compute other quantitative morphological parameters (see, e.g., Conselice et al., 2000; Conselice, 2003).
The definition in equation 1 provides an incomplete description as it neglects the contribution to the dispersion arising solely from the background pixel intensity distribution (i.e., the image sky “noise”). For example, given two images with mean pixel value zero, but rms uncertainties, and , respectively, and an arbitrary scaling factor , equation 1 has a net, non–zero value, . In theory the statistical sky contribution can be removed if one knows the exact rms pixel–to–pixel variations. However, in practice it can be difficult to compute the local sky rms variation in the region of the galaxy in real data. To estimate the contribution to from the background, we have adopted a procedure to compute the pixel intensity values for a blank region of sky for each image, which is defined as an image region equal to the aperture size used for the object with no pixel values above the detection threshold (i.e., an image section where all pixels have a zero value in the SExtractor SEGMENTATION image). One could use randomly–selected background pixels, which would ensure that faint, undetected objects do not contribute to the internal color dispersion. However, using a region of contiguous pixels provides a better estimate of noise from any correlation between neighboring pixels (for example, from rebinning and/or image convolution, both of which have been done to the UIT sample here). In practice, we computed values the background rms of each image by taking the mean of the values from many () different regions. The appropriate values are then subtracted from the numerator and denominator of equation 1 to remove the contribution to the color dispersion from the background,
| (2) |
where and are the pixel intensity values from the blank region in each image. One can also calculate the statistical error associated with this quantity, with the approximation that the background pixels have a Gaussian distribution,
| (3) |


We have tested the behavior of for two simulated objects with a priori known (fixed) total flux and internal color dispersion. Noise was added in increasing amounts to emulate the effects of the sky background, and we derived for each simulated object using the definition in equation 2. Figure 1 shows the behavior of as a function of , where represents the flux–intensity values, and is the image variance due to the noise of the background. The sum is taken over all pixels () within the object boundary. As illustrated in the figure, our internal–color–dispersion definition is a robust (i.e., flux independent) statistic for objects with , where uncertainties are essentially nil (see the right panel of figure 1). We also found that the derived values are equal to the standard deviation of the measured values, which implies that the calculated uncertainty (i.e., equation 3) is accurate for the case that the pixel–to–pixel noise has a Gaussian distribution (see also the discussion in § 3.2). The internal color dispersion remains a statistically viable, flux–independent measure of the “true” value down to , where the right panel of fig 1 shows that the fractional difference [defined as ] of is % relative to the true value.
Our definition of is theoretically invariant under interchanges of and , i.e., . This is a result of the fact that Equation 2 is roughly equal to the rms of about a mean value (defined by ) normalized by the squared sum of intensity of . Substituting for and vice versa rescales both the numerator and denominator of Equation 2 by the same amount, leaving unchanged. However, we have found that in practice is more robust when the image with higher S/N is used as . Using the lower–S/N image for increases the uncertainties on and from the fitting algorithm, which translates to larger scatter on the inferred dispersion in the internal colors. Therefore, we will always use the higher–S/N image as in equation 2. For our analysis here, this amounts to using the –band as to compute and the UIT/MUV as to compute .
3.2 Application to the UIT Galaxy Sample
For each galaxy in the UIT sample, we derived the internal color dispersion using equation 2 for the UIT/FUV, UIT/MUV, and -band images. We have computed the internal color dispersion between the FUV/MUV and MUV/ bandpass combinations, and these results are presented in table 2. We have not included the internal color dispersion values between the UIT/FUV– and –bands as any variation in these colors includes both the internal color variations between the FUV/MUV and MUV/–bands. Also listed in the table are the object S/N for each bandpass (ground–based and UIT) within the isophotal apertures defined from the –band images using the SExtractor software. To ensure that our internal color dispersion values measure light solely from the galaxies, we have masked out interloper objects (e.g., obvious foreground stars) using the results in the SExtractor SEGMENTATION image. We then recomputed the internal color dispersion for these galaxies using an area for the background estimate with the interloper isophotal areas subtracted. Four of the galaxies in the sample are detected in the UIT/FUV with low signal–to–noise, (). Thus, we will exclude these objects from the analysis of the values (these objects are flagged with dagger symbols in table 2).
| Name | S/N()††Signal–to–noise ratio measured within an isophotal aperture defined from the –band image. | S/N(MUV)††Signal–to–noise ratio measured within an isophotal aperture defined from the –band image. | S/N(FUV)††Signal–to–noise ratio measured within an isophotal aperture defined from the –band image. | |||
|---|---|---|---|---|---|---|
| (1) | (2) | (3) | (4) | (5) | (6) | |
| 1 | NGC 628 | |||||
| 2 | NGC 1068 | |||||
| 3 | NGC 1275 | |||||
| 4 | NGC 1316 | ‡‡Object is detected in UIT/1500 Å with . | ||||
| 5 | NGC 1317 | |||||
| 6 | NGC 1399 | |||||
| 7 | NGC 2146 | ‡‡Object is detected in UIT/1500 Å with . | ||||
| 8 | NGC 2992 | ‡‡Object is detected in UIT/1500 Å with . | ||||
| 9 | NGC 2993 | |||||
| 10 | NGC 3031 | |||||
| 11 | NGC 3034 | ‡‡Object is detected in UIT/1500 Å with . | ||||
| 12 | UGC 06697 | |||||
| 13 | NGC 4321 | |||||
| 14 | NGC 4486 |
The analytic uncertainty on (equation 3) was derived assuming a Gaussian distribution of background pixel–to–pixel noise. However, for the data used here this may be an oversimplification. The UIT data have low image backgrounds for which a Gaussian distribution may be inappropriate. Furthermore, because we have resampled and convolved the data to match the pixel scales and PSF between the UIT and –band images, the noise between neighboring pixels is correlated; the pixel–to–pixel random noise is suppressed by a factor equal to , where are the elements of the correlation matrix. Given these systematic uncertainties in the images backgrounds, we have resorted to Monte Carlo simulations to quantify the uncertainties in the internal color dispersion between the UIT and –band data. For each galaxy in the UIT sample, we repeatedly inserted simulated objects with a priori known internal color dispersion into blank image regions and measured the resulting scatter in the derived values. We then take the standard deviation of the measured values of the Monte Carlo simulations as the uncertainty for . These uncertainties are given in table 2.
While we have made an effort to provide good estimates for the statistical uncertainties on , they likely underestimate the real uncertainties, which may be dominated by systematic effects. Indeed, several objects in table 2 have very low formal, statistical errors (i.e., objects with , which are rounded to 0.00 in the table), which in reality are probably underestimates. Unaccounted systematic effects could include, for example, inaccurate PSF–matching, image registration problems, cosmetic effects in the case of the UIT images, etc. Thus, we caution that the high formal–S/N values of the flux measurements for the ground–based –band and UIT data probably correspond to an underestimation of the uncertainties on as quoted in table 2.
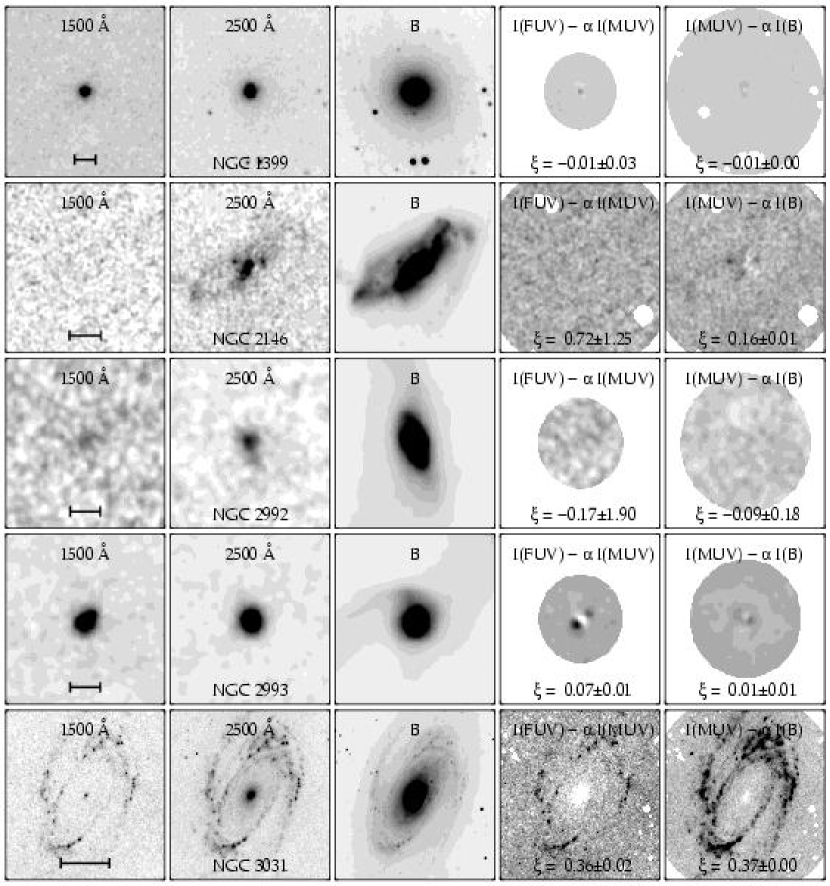
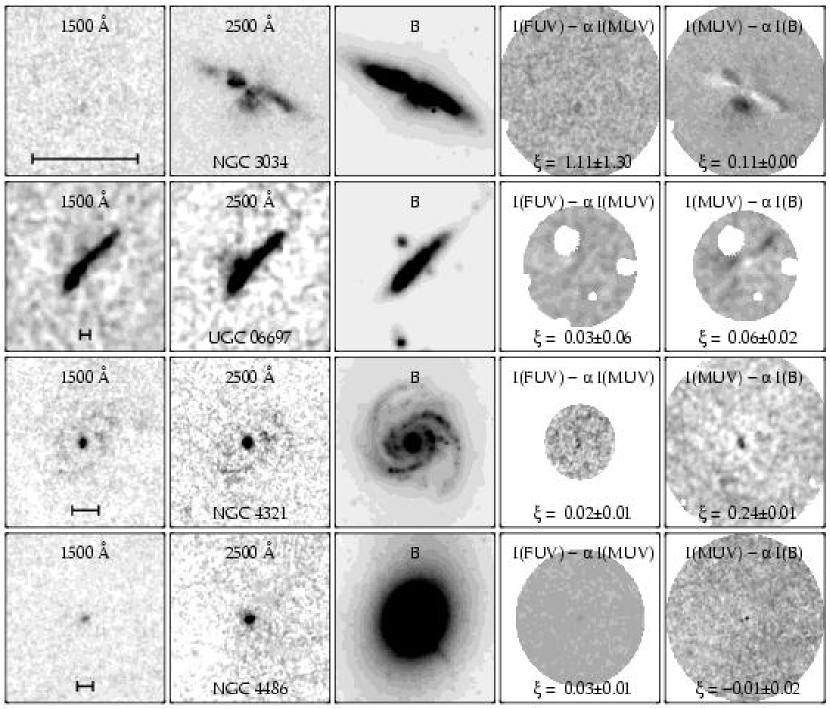
In figure 2, we present a montage of images for each galaxy in the UIT sample. Each row of images in the figure shows (from left–to–right) the UIT/FUV, UIT/MUV, –band images, and the residual images between these bandpasses after subtraction of the mean flux ratio: and . The residual images illustrate galaxy features that exhibit regions of strong variations in galaxy UV–to–optical colors relative to the mean color value. Dark/Bright regions correspond to regions that are bluer/redder than the mean color of the galaxy, although note that these regions represent the flux difference (and not the flux ratio, or color).
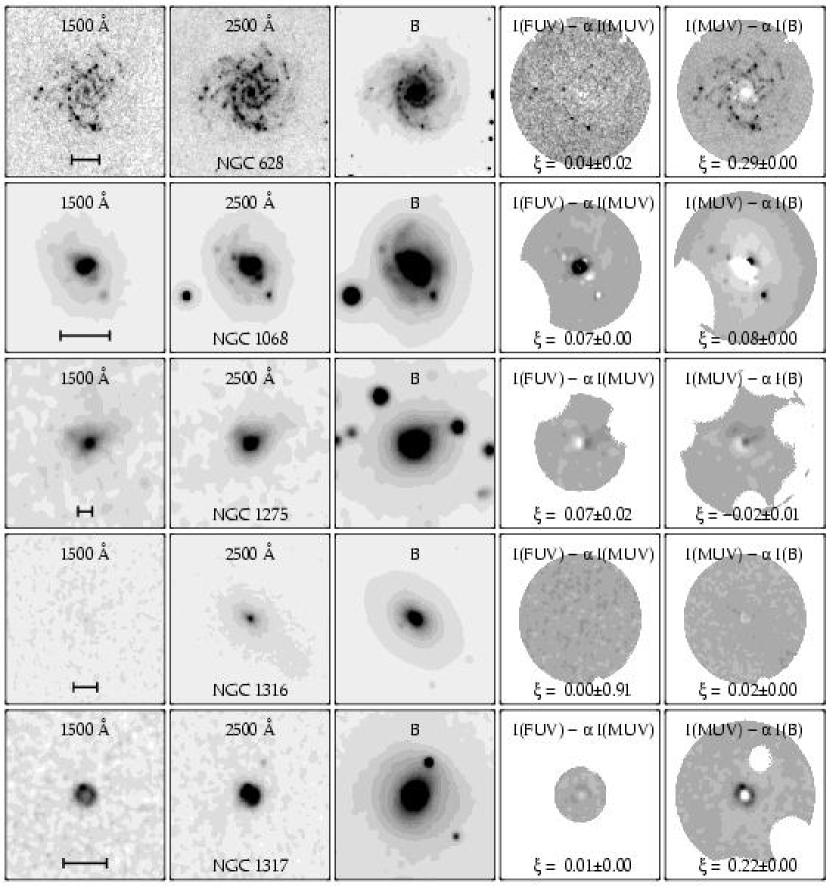
Broad descriptions of the UV–to–optical morphologies of the galaxies in our UIT sample have been presented by previous authors (see, e.g. Marcum et al., 2001, and references therein), and we refer the reader to those papers for further discussion on the general morphological properties of these galaxies. In the next section, we discuss the distribution of internal UV–to–optical colors for the galaxies in the UIT sample.
3.3 Notes on Individual Objects
NGC 628 (M74): NGC 628 is a near face–on galaxy with “grand design” spiral arms. In the UV, these spiral arms are traced by bright, star–forming knots. Diffuse stellar components constitute the disk and bulge components, which dominate the –band morphology. This galaxy has high , presumably from differences in the UV/optical colors of the star–forming regions and the more evolved stellar populations in the diffuse bulge/inner disk. There is little dispersion between the FUV and MUV internal colors, which implies that the stellar populations that emit at these wavelengths are largely co-spatial.
NGC 1068 (M77): NGC 1068 is the nearest example of a type 2 Seyfert. Differences in the UV/optical colors of the active nucleus, bright star–forming knots, and diffuse, extended disk dominate the internal color dispersion (as shown in the residual color image in figure 2). To ascertain the contribution of the AGN to the total internal color dispersion, we recomputed after masking out the galaxy center, and observed little change in the resulting internal color dispersion. Therefore, the high internal color dispersion value is probably a result of patchy dust opacity within the nuclear starburst (see also Neff et al. 1994).
NGC 1275 (Perseus A): NGC 1275 is an early-type, cD galaxy in the Perseus cluster. Conselice, Gallagher, & Wyse (2001) have interpreted spectroscopic and morphological evidence to argue that NGC 1275 has recently accreted one or more gas–rich cluster members, which is now actively forming stars in the nucleus, and which has produced the peculiar morphology. The internal color dispersion between the MUV and optical bands is low. The residual image shows evidence for the AGN–induced jet, as well as peculiar features associated with star–forming regions. The internal color dispersion between the FUV and MUV is fairly significant, which apparently arises from a combination of the AGN and star–forming regions.
NGC 1316 (Fornax A): The optical morphology of NGC 1316 displays prominent dust lanes (see also, Schweizer 1980). No measurable FUV–to–MUV internal color dispersion is apparent, but is not excluded due to the low signal–to–noise ratio of the UIT/FUV image. The essentially nonexistent value argues that the stars contributing to the MUV and optical light are generally co-spatial.
NGC 1317 (Fornax B): The optical morphology of NGC 1317 is dominated by the bulge/disk system. The UV images indicate a prominent nuclear ring of star formation (with radius kpc), which is also observed in H (Marcum et al., 2001). This ring dominates the total UV emission and drives the internal color dispersion and morphological –correction between the UV and optical images.
NGC 1399: The UV–to–optical morphologies of NGC 1399 are broadly similar, and no measurable dispersion is seen in the internal colors. The UV emission probably stems from the exposed stellar cores of evolved (old) low–mass stars (i.e., the “UV-upturn”, see Brown et al. 2000), which is consistent from the very red colors, . Regardless, the low values imply that the stars dominating the flux from UV–to–optical wavelengths are well mixed.
NGC 2146: NGC 2146 is an inclined disk system, and exhibits prominent dust features in its optical morphology. The MUV morphology displays several knots in addition to a weak diffuse component roughly co-spatial with the optical spiral-arm features. The galaxy is only weakly detected at FUV wavelengths. This, combined with the high infrared emission from this galaxy, suggests that this galaxy has undergone an obscured burst of star formation (Hutchings et al. 1990). The MUV–to–-band internal color dispersion for NGC 2146 is moderately high, resulting from apparently patchy dust absorption, and supporting the obscured starburst hypothesis. The FUV–to–MUV internal color dispersion is immeasurable due to the low signal–to–noise ratio of the UIT/FUV image.
NGC 2992/2993: NGC 2992 and NGC 2993 represent an interacting system, and exhibit extended tidal features in the optical images. The MUV morphology of NGC 2992 shows faint, diffuse emission coincident with the optical central bulge/disk and with low internal color dispersion. This galaxy is very faint in the FUV images. NGC 2993 is well detected in both UIT/FUV and UIT/MUV images. It is also noteworthy that NGC 2993 has one of the bluest UV–to–optical colors of the UIT sample. This galaxy is apparently vigorously forming stars and these stars dominate the UV portion of the galaxy’s SED. The lack of internal color dispersion between the MUV and optical images implies that the young stars also dominate the flux emission at these wavelengths. There is low (but significant) internal color dispersion between the FUV and MUV images in NGC 2993, which is centered on the nucleus and may be suggestive of a dust lane or patchiness in the dust absorption.
NGC 3031 (M81): NGC 3031 shows a dramatic transformation between its optical and UV morphology. Furthermore, this galaxy has some of the largest values of the sample. As illustrated by the color–residual images for this galaxy in figure 2, the large internal color dispersion values apparently result from differences in the stellar populations that constitute the bulge, disk, and star–forming spiral arms. It is also notable that this galaxy is the only sample member with high internal color dispersion between the FUV and MUV colors, i.e., . This galaxy (along with NGC 3034) is the nearest galaxy in the sample (at a distance of 3.4 Mpc; Freedman et al. 2001), and therefore, one could postulate that the higher resolution available for this galaxy somehow increases the internal color dispersion. However, our simulations of NGC 3031 with poorer resolution indicate that the resolution is not a dominant effect (see § 5). Therefore, in order to account for the high internal color dispersion, the (older) stellar populations of the bulge must contribute strongly to the flux in MUV wavelengths (with very little accompanying FUV emission), whereas the FUV flux predominantly stems from young star–forming complexes in the spiral arms. NGC 3031 beautifully illustrates how differences in the composition of the stellar populations that make up each galaxy component (i.e., the bulge, disk, spiral arms) can generate large internal color dispersion.
NGC 3034 (M82): The optical morphology of NGC 3034 is complex — its inclination is nearly edge–on, and dust lanes clearly pervade the UV and optical morphology, giving it a patchy color distribution. NGC 3034 is only marginally detected in the UIT/FUV image. Intrinsic FUV emission, which is presumably present due to the strong H emission (Bell & Kennicutt, 2001), is completely obscured by the large dust opacity. The patchy color distribution gives rise to significant internal color dispersion between the MUV and –band images. The residual color image in figure 2 illustrates the regions of strong color dispersion, which appear to coincide with the dust lanes in the optical and MUV images. This illustrates an example of internal color dispersion resulting from a varying amounts of dust absorption.
UGC 06697: UGC 06697 is well–detected in both UIT bands with very blue UV–to–optical colors. The UV morphology is broadly similar to the –band image, even though it is nearly edge–on (cf., NGC 3034). There is little internal color dispersion between the FUV and MUV bandpasses, which implies that the stellar populations that emit at these wavelengths are largely co-spatial. There is strong dispersion between the MUV and –band internal colors. From the appearance of the residual image in figure 2, and the inclined nature of the system, this dispersion is likely due to patchy dust obscuration.
NGC 4321 (M100): The –band image of NGC 4321 displays grand spiral arms embedded in a large disk, with a small inner bulge. The UV images have low signal–to–noise ratios. A nuclear point source dominates the UIT/FUV and MUV images, which is probably due to nucleated star formation, but may result from a weak AGN (see Roberts, Schurch, & Warwick 2001). Faint UV emission traces the spiral arms. The internal color dispersion between the UIT/FUV and UIT/MUV bands is inconclusive due to the low signal–to–noise ratios of the images. NGC 4321 exhibits internal color dispersion between the UIT/MUV and –band images. This dispersion appears to result from color differences between the nuclear region and the stellar populations of the bulge and disk.
NGC 4486 (M87): NGC 4486 has the reddest UV–to–optical colors in the UIT sample, and exhibits a very symmetric, smooth morphology in all the images. The MUV morphology is compact (although some evidence for the nuclear jet is evident) and centered on the nucleus, and is attributed to the exposed cores of evolved stars. There is also some indication for recent star–formation, possibly resulting from a cooling flow in the cluster (McNamara & O’Connell, 1989). In a study using deeper UIT/FUV images from the ASTRO–2 mission, Ohl et al. (1998) conclude that only a few percent of the FUV emission from NGC 4486 originates from an AGN or jet and that most of the observed light is stellar in origin. No measurable internal color dispersion between the UV/optical colors is evident in NGC 4486.
4 Discussion

Because we expect the UV–optical internal color dispersion to be sensitive to variations in the composition and configuration of the underlying stellar population (and the strength of any AGN activity), it is useful to compare the internal color dispersion with galaxy morphology, which we show in figure 5. The MUV–optical internal color dispersion rises (left panel of figure 5) from near zero for the earliest galaxy types, peaks for the mid–to–late-type spirals and declines for irregular galaxies. This behavior is similar to the qualitative trends observed between galaxies’ morphological type (classified from optical–wavelength images) and the strength of their morphological –corrections between UV and optical wavelengths, but here we have measured this effect quantitatively. The elliptical and lenticular galaxies in the sample have low internal color dispersion between the MUV–optical, i.e., , with a mean value, , and small scatter, . Two of the Sa galaxies also show low values (NGC 2992, NGC 2993), although the other Sa galaxy in the sample (NGC 1317) has a high value, , which arises from the star–forming, circumnuclear ring that dominates the UV morphologies (see § 3.3). In contrast, the mid–type spirals (types Sab–Sc) in the sample all have significant MUV–optical internal color dispersion, with a mean value of and large scatter, . Lastly, the irregular galaxies in the sample have moderate MUV–optical internal color dispersion, with a mean value of . While this is significant and is similar to the lowest values seen in the mid–type spirals, it is less than the mean value seen in the mid–type spirals.
Interestingly, the FUV–MUV internal color dispersion is much weaker that that seen between the MUV–optical colors (contrast the left and right panels of figure 5), and is roughly independent of morphological type. This suggests that the morphological –correction between the FUV–MUV bands is generally small relative to that between the MUV–optical bands. This result is fairly unexpected, as the wavelengths of the chosen bandpasses span similar baselines in logarithmic units, i.e., . Therefore, the stars that dominate the FUV–to–MUV flux in the galaxies in this sample are rather co-spatial compared to the configuration of the stars that dominate at optical wavelengths. The sole exception to the above statements is NGC 3031 (M81), which shows very high FUV–MUV internal color dispersion. This high value apparently stems from the fact that the bulge of NGC 3031 contributes a substantial portion of the flux at MUV wavelengths, whereas the FUV emission is confined to star–forming regions in the spiral arms (see § 3.3). Furthermore, this effect does not seem to be a consequence of resolution, as we will discuss in more detail in § 5.1. Therefore, while high FUV–MUV internal color dispersion values are physically plausible, they seem to occur only for specific (rare?) circumstances, and low –values between FUV and MUV wavelengths (e.g., small morphological –corrections) are the norm.
Because the mean absolute magnitude roughly correlates with morphological type for local galaxies (e.g., Roberts & Haynes, 1994), one can study the dependencies between the internal color dispersion and galaxy absolute magnitude, as illustrated in figure 6. In general, objects with the highest luminosities have low scatter in their derived values, whereas at lower luminosities objects display greater scatter in . In contrast, there is no correlation between absolute magnitude and . This is broadly consistent with the lack of dependency of the internal color dispersion at these wavelengths and morphological type discussed above. Splitting the UIT sample into three luminosity sub–groups, we find that for , the dispersion in is and . In contrast, for , we derive and . The increase in the dispersion of at this absolute magnitude is due to the three mid–type spirals with large (NGC 3031, NGC 628, NGC 4321). For , the increase is dominated solely by NGC 3031 (note, however that the value for NGC 4321 is uncertain due to the low S/N of the UIT/FUV data). For , the dispersion is . Thus, one conclusion from this analysis is that the most luminous galaxies (in blue light) in the local universe have low internal color dispersion between the UV and optical (and hence, the weakest morphological –corrections). Less–luminous galaxies () exhibit examples of galaxies with high internal color dispersion, and the scatter in these values on the whole is very large relative to the more luminous galaxies.

The dispersion of galaxy internal colors also exhibits trends with the galaxy total color, as shown in figure 7. There is little relation between the FUV–MUV internal color dispersion and UV–to–-band color. Galaxies with the reddest UV–to– colors, e.g., , have very low MUV–-band internal color dispersion. Thus, the stellar populations in these galaxies that emit at these wavelengths have a very homogeneous distribution. Due to the red colors and smooth (relaxed) morphologies of these galaxies, any UV emission probably stems from the exposed cores of evolved, late–type stars, which accounts for the co-spatial nature of the UV and optical emission. Similarly, the galaxies with bluest colors, , have low–to–intermediate internal color dispersion. The light from galaxies with these colors is dominated by young stellar populations (with ages less than a few hundred Myr; in the absence of AGN activity). Therefore, it seems that when young stars dominate the total UV–to–-band emission, there is low intrinsic internal color dispersion, and any observed internal color dispersion is likely the result of variable dust absorption (although the effects of any such dust absorption are limited such that they do not redden the galaxy total colors out of this color range). This seems to be the case for the latest morphological types. Note that this does not exclude the possibility that older stars exist beneath the glare of the young stellar populations, simply that any hypothetical old population does not contribute substantially to the internal color dispersion or total colors.
Galaxies in the sample with intermediate UV–to–optical colors (i.e., ) exhibit the largest range of internal color dispersion values, which is illustrated by the “swath” of values that span in the left panel of figure 7. One can consider the argument that these UV–to–optical colors may be in some sense a requirement for the existence of high internal color dispersion. Several possibilities then emerge. The galaxies must have young stellar populations that dominate the UV emission and are segregated in some manner from a substantial evolved stellar population (e.g., a disk/bulge dichotomy). Otherwise, if young stars dominate the UV–to–optical emission relative to the older stellar population, then weak internal color dispersion is expected. Similarly, weak internal color dispersion is expected if the older stellar population dominates the UV–to–optical emission (as is generally the case in elliptical/lenticular galaxies; see previous paragraph). Therefore, it appears that the mix of young and old stellar populations — with integrated, intermediate colors — is a condition for high UV–optical internal color dispersion.

To exemplify this scenario, we used a simple model to investigate the relationship between differences in galaxy stellar populations and the inferred internal color dispersion. We constructed a hypothetical galaxy in which some fraction of resolution elements contain a young stellar population and the remaining fraction contain an older stellar population. To model the UV–optical colors of the young and old stellar populations, we used the latest version of the Bruzual & Charlot (1993) stellar synthesis population models. We modeled the colors of the young population as having a Salpeter IMF and solar metallicity, and having formed with constant star formation viewed at an age of yr. For the older stellar population, we considered two models, both formed in an instantaneous burst with the same IMF and metallicity as above, but viewed at ages and yr, respectively. These models produce UV–optical colors of, , 2.1, 5.6) and , 2.6, 3.5), for , , yr, respectively. We assigned these colors to a model galaxy with uniform –band surface brightness, then vary the fraction of the galaxy dominated by the young stellar population (where the remaining fraction of the galaxy is dominated by the older stellar populations), and computed the internal color dispersion values, and .

.
It is useful to parameterize how the UV–optical internal color dispersion values for these galaxy models vary as a function of the fraction of the total stellar mass made up by the young stellar populations. The mass–to–light ratios of the stellar populations (plus stellar remnants) in the old and young stellar populations defined above differ substantially: , 0.90, 10.3), for , , yr, respectively. In figure 8, we show the relation between the internal color dispersion as a function of the ‘young’ stellar–population mass fraction, where the total stellar mass equals the sum of the ‘young’ and ‘old’ stellar–population mass. Only a small fraction (% by mass) of nascent stars (relative to the total galaxy stellar mass) is required to produce strong MUV/-band internal color dispersion. At higher stellar–mass fractions (%), the young stellar populations dominate the MUV–optical flux emission, with essentially no internal color dispersion. Low internal color dispersion is again observed for very low young stellar–population mass fractions (%), where the older stellar populations dominate the MUV–optical emission. Furthermore, strong is only observed in the case that young stellar populations constitute minuscule fractions (%) of the total galaxy mass. For higher mass fractions, the young stars completely dominate the FUV–MUV emission, with no color dispersion. At the low ‘young’ stellar–mass–fraction end, small values are only seen in the case that the young stellar populations constitute a tiny fraction of the total stellar mass (i.e., % for an old stellar population age of yr, and % for an old stellar population age of yr). These tiny fractions suggest that the internal color dispersion should provide a useful constraint on “frostings” of star formation in otherwise passively evolving elliptical galaxies (e.g., Trager et al., 2000). We conclude that in the case of segregated young and old stellar populations, the UV–optical internal color dispersion constrains the relative stellar–mass proportions of these populations.
These simulations are crude, and do not include the effects of varying dust opacity, IMF, metallicity, or the possibility of more than two stellar populations. Obviously, any factor that contributes to the relative difference in the colors throughout a galaxy will contribute to the overall internal color dispersion. The results here, however, illustrate how the internal color dispersion depends on the fraction of a galaxies’ stellar mass in young stellar populations.
An alternative scenario exists to account for the range of internal color dispersion observed at intermediate colors in which the galaxies’ internal colors result from a variable distribution of dust absorption. Dust is usually associated with star–forming regions (e.g. Calzetti, 2001), and its general effect is to redden UV–optical colors in dust–enshrouded regions, although the exact amount depends crucially on the chosen extinction law. Increasing the non-uniformity in the amount of dust absorption causes galaxies to appear more “patchy” in these colors (e.g., Calzetti, Kinney, & Storchi–Bergmann, 1994; Calzetti et al., 2000; Romaniello et al., 2002), which increases the internal color dispersion. At the same time, because young stellar populations often form within dense dust clouds, one expects them to have intermediate (redder) UV–optical colors, like those associated with the wide scatter in seen in figure 7. Severe dust extinction ( of many magnitudes) fades the emission from galaxies beyond the detection limit — especially in the UIT/FUV images as is arguably the case for NGC 3034 and NGC 2146. Note, however, that both of these galaxies show strong , which supports the hypothesis that strong (and variable) dust extinction is intermixed with star–forming populations.

If dust extinction is responsible for the internal color dispersion, then there may be a relation between the internal color dispersion and the reradiated emission from the dust, which should be detected in the far–infrared (FIR). To explore this possibility, we have compared the derived internal color dispersion with the UV/optical–to–FIR flux ratios for the galaxies in the UIT sample in figure 9. For the FIR flux emission, we used the flux densities measured at 60 µm from IRAS (Rice et al. 1988; Moshir et al. 1990; J. Knapp, 1994, priv. communication, see the NASA/IPAC Extragalactic Database (NED)666http://ned.ipac.caltech.edu). There is no apparent relation between the ratios and values (see right panel of figure 9). Interestingly, we observe a trend between the ratios and (left panel of figure 9) in that higher values correspond to an increase in the scatter and upper envelope of values spanned by the data. The reason for this relation is not completely clear, but is probably a result of how dust and stars are distributed in galaxies. For example, both NGC 3031 and NGC 4321 have high ratios, and correspondingly high values that probably result from differences in the stellar populations that constitute the bulge/disk. Alternatively, galaxies that appear to have more dust absorption between the UV and optical images, i.e., NGC 3034, NGC 2146, and UGC 06697, have lower ratios. Thus, variable dust extinction apparently does induce UV–optical internal color dispersion, but with smaller values relative to those produced by variations in segregated stellar populations.
This may imply that our internal color dispersion statistic is more sensitive to differences in the underlying stellar populations rather than the dust absorption. For example, consider the effects of adding a patchy dust screen on a galaxy forming a (single) young stellar population. Dust not only reddens the UV–optical colors, but also fades the observed flux of the galaxy. Because our internal color dispersion statistic is normalized to the total galaxy flux (see equation 2), regions with the highest dust absorption will contribute less to relative to regions with less dust. Given the complex nature of dust (i.e., its geometry, composition, configuration, temperature, etc.), in order to fully parameterize the effects of dust on the UV–optical internal color dispersion will require data for large galaxy samples that cover UV–to–FIR wavelengths, which should be possible with the planned surveys with the Space Infrared Telescope Facility (SIRTF)777see the SIRTF Science Center website: http://sirtf.caltech.edu/SSC..
5 Application to Distant Galaxies
The distribution of the internal color dispersion values for the UIT galaxy sample provides a benchmark for comparisons with high–redshift galaxies. In Paper II, we compare these to observations of galaxies in the HDF–N using HST/WFPC2 and NICMOS data out to . In this section, we consider the observational limitations of measuring the internal color dispersion as a function of distance and resolution.
5.1 Effects of Instrumental Resolution
One question is how our definition of the internal color dispersion varies with the image physical resolution. The images in our UIT sample have a range of resolution depending on the distance to the galaxy and the specific telescope/detector characteristics. It is clear that poor resolution will decrease the measured internal color dispersion as intrinsic color variations within a galaxy are “smoothed over”. For example, in the limiting case where only one resolution element exists per galaxy, the integral color dispersion would be zero. Conversely, even a coeval and statistically well–mixed stellar population that is resolved into individual stars will have significant color dispersion. Here, we define the image resolution, , as the number of resolution elements (i.e., “beams”) per kpc in the frame of the galaxy. For the UIT sample, these values range from beams kpc-1. In particular, resolution becomes important when considering observations of distant (high–redshift) galaxies as one requires sufficient resolution to measure quantitative morphological parameters. For example, the HST observations that we analyze in Paper II have a nearly constant resolution, beams kpc-1 for (due to the inflection in the angular diameter distance about for the default flat, CDM cosmology; see figure 10).

As an initial experiment, we considered the effects of limiting the resolution for several fiducial galaxies that have moderate–to–high internal color dispersion between the UIT/FUV, UIT/MUV, and passbands (NGC 3031, NGC 628, UGC 06697). We convolved the galaxies to mimic the effects of larger “beams” to simulate observations of each galaxy with decreasing resolution of the physical distance in the frame of each galaxy.
In figure 11, we show the derived internal color dispersion values (relative to the values for their original image resolution) as a function of resolution for NGC 3031, NGC 628, and UGC 06697. Note that only the resolution has changed in these simulations, i.e., the galaxy fluxes have been preserved (with no losses due to cosmological surface brightness, for example). In these simulations, the internal color dispersion varies by % down to beam kpc-1. Therefore, is a robust measure of internal color dispersion (and thus the morphological –correction) down to this limiting resolution. As a further test, we compared the internal color dispersion values and image resolution for the UIT galaxy sample. Although the images span a large resolution range, we find no relationship between the two. Therefore, reducing the resolution of the UIT galaxies to beam kpc-1 does not strongly impact the results presented here.

The resolution limit for measuring reliable internal color dispersion values may depend on the intrinsic galaxy size. Although giant spiral galaxies commonly show significant internal structure (e.g., NGC 3031, NGC 628), this is not the case for all large galaxies (e.g., ellipitcals, NGC 4486; and lenticulars, NGC 1316). Similarly, our UIT sample is lacking small, dwarf galaxies that could require high resolution to measure any internal color dispersion. There is evidence that the sizes of star–forming complexes in spiral, irregular, and dwarf galaxies scale approximately as the square root the galaxy –band luminosity (Elmegreen et al., 1994, 1996). The sizes of star–forming complexes in brighter galaxies () are kpc, and are comparable to the physical length of the limiting resolution for the internal color dispersion. Because the internal color dispersion between the UIT bands and –band is sensitive to heterogeneities in the star–forming regions of a galaxy, it may be the case that robust measures of are possible given that the image resolution is less than the sizes of the star–formation complexes within an individual galaxy. There is insufficient UIT data available to test this paradigm over a complete range of galaxy types, sizes, and star–formation properties, but such studies may be possible using MUV–optical imaging of nearby galaxies from the HST (e.g., Windhorst et al., 2002).
What resolution is required then to reliably measure the internal color dispersion of high–redshift galaxies? As we mentioned previously, the cosmological angular–diameter distance (the ratio of the object’s distance to its apparent size on the sky) exhibits a well–known inflection around (depending on the exact cosmological parameters), as illustrated in figure 10. For the default cosmology used here (, , ), the maximum in the angular–diameter distance occurs near , with kpc arcsec-1. For the requirement that the image resolution exceed beam kpc-1 (see above), this corresponds to beam, which is generally only available from space–based observatories, but also from ground–based telescopes with adaptive–optics and interferometric techniques. The HST/ACS, WFPC2, and NICMOS (camera 3) have beam sizes of , , and ,888Because the HST cameras are undersampled, the pixel scale dominates the beam size. The values quoted here correspond to the FWHM measured from artificial PSFs constructed using the TinyTim software provided by J. Krist (private communication, see also http://www.stsci.edu/software/tinytim/) at the pixel scale of the HST detectors. Note that there are several techniques available to reconstruct the image resolution in dithered, undersampled images (e.g., Fruchter & Hook, 2002; Lauer, 1999), which offer improved image resolution over the values presented here. respectively, which are sufficient for quantitative studies of the galaxies internal colors, and greater than needed in the case of large multi–component galaxies like NGC 3031 (see also the discussion in Conselice et al. 2000a). Note, however, that even the HST resolution is nearly at the limit for quantitative morphology for high–redshift galaxies, which argues that telescopes with even higher resolving power would greatly improve our ability to measure morphological properties of galaxies in the distant universe.
5.2 The Internal Color Dispersion of High–Redshift Galaxies
Cosmological effects cause the surface brightness of galaxies to fade strongly with redshift, the bolometric surface brightness decreases as . Many authors have argued that this complicates interpretations of high–redshift galaxies as one is biased toward high–surface brightness regions and may be missing a substantial fraction of the total luminosity from galaxies (see, for example, Bahcall, Guhathakurta, & Schneider, 1990; Bernstein, Freedman, & Madore, 2002, and references therein). Indeed, comparing the (artificially) redshifted appearances of local galaxies to HST images illustrates the consequences of cosmological surface brightness, especially when only rest–frame UV wavelengths are considered (see Giavalisco et al., 1995; Kuchinski et al., 2001).
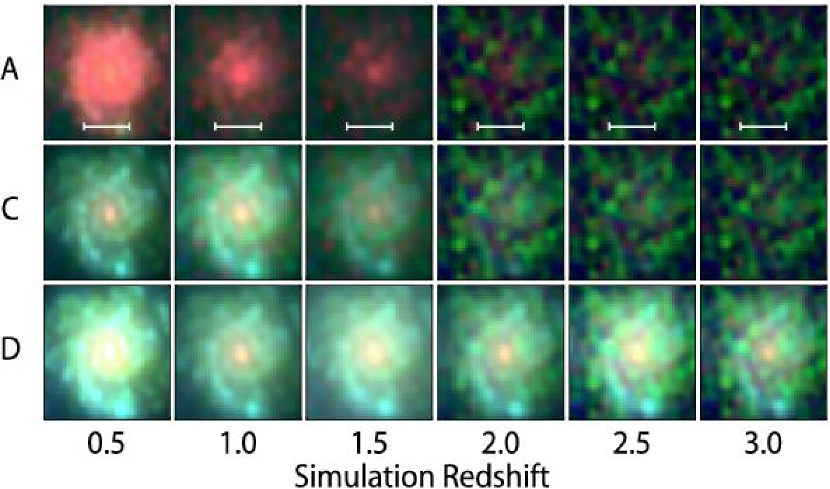
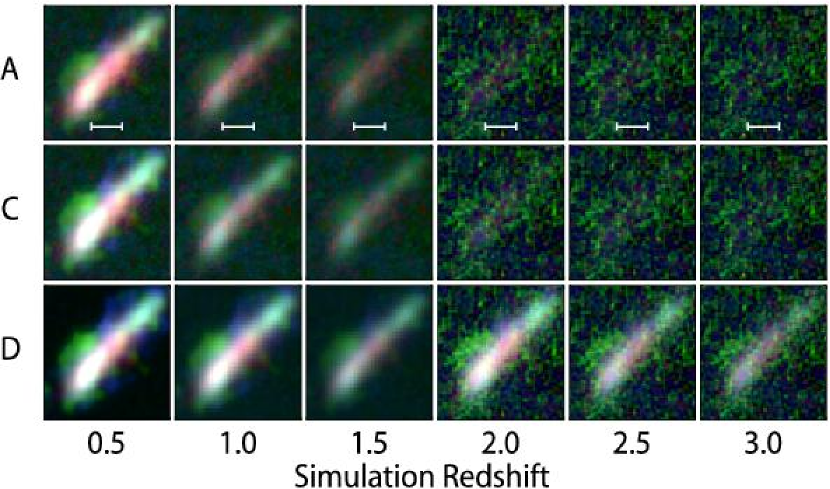
We have investigated the appearance of the UIT galaxies if viewed at high–redshift in the deep HST/ WFPC2 and NICMOS images for the HDF–N (Williams et al., 1996; Dickinson et al., 2003b). We selected four galaxies from the UIT sample with significant internal color dispersion in order to gauge how these are affected if viewed at high redshift: NGC 3031, NGC 628, NGC 1068, UGC 06697. We have simulated their appearances at , 1.0, 1.5, 2.0, 2.5, and 3.0, at the pixel scale of the HST HDF–N images ( pix-1). We first convolved these images with a kernel such that the final simulated images match the NICMOS Camera 3 PSF for the F160W filter at each redshift (in our analysis of the NICMOS HDF–N galaxies all images have been convolved to match the NIC3 F160W PSF, see Paper II). We then resampled each image and rescaled the image pixel intensities to account for the change in distance using the detailed prescription described in the Appendix. For the simulated images at , 1.0, 1.5, we added noise from the WFPC2/F300W, WFPC2/F606W, and NIC3/F110W data to the UIT/FUV, UIT/MUV, and –band images, respectively. For , 2.5, 3.5, we instead add noise from the WFPC2/F606W, NIC3/F110W, and NIC3/F160W images, as these bandpasses better correspond to the rest–frame UIT/FUV, UIT/MUV, and –band for these redshifts.
Panel (a) of figure 12 shows the measured internal color dispersion between the (rest–frame) UIT/FUV–MUV, and UIT/MUV––bands as a function of redshift under the assumption of no evolution (i.e., the luminosities and colors of the galaxies are unchanged from their values). One salient conclusion from this plot is that the internal color dispersion for these galaxies between either set of bandpasses is immeasurable for . This roughly corresponds with the point where the (rest–frame) UV fluxes diminish to , which our previous simulations (§3.1) indicate the internal color dispersion is generally unreliable. The galaxies are detected in the rest–frame –band data to (see below), but their rest–frame UV flux emission at high redshifts (with no evolution) is too faint for quantitative morphological studies.


In panel (b) of figure 12, we show the derived internal color dispersion values for the same galaxies as above, but here we have increased the galaxies’ luminosities while keeping their UV–optical colors fixed at their present values. This plot shows that for NGC 628 ( mag), NGC 1068 ( mag), and UGC 06697 ( mag), the dispersion in the internal color is consistently robust to . These galaxies have blue UV colors and thus the rest–frame UV images have sufficient signal–to–noise with which to measure the internal colors, at least to . NGC 3031 ( mag), with and is relative red, and even with the increase in luminosity, both and remain poorly measured for .
High redshift galaxies are not only more luminous than present–day counterparts, but they also have bluer rest–frame colors, which is especially true for (e.g., Dickinson 1999; Dickinson et al. 2003a). To test the effects of color evolution on , we have scaled the observed UV–to–optical colors of the four fiducial galaxies from the UIT sample to match observations at high redshifts. The Lyman–break galaxies (LBGs) in the HDF–N, studied by Papovich, Dickinson, & Ferguson (2001) have observed median colors and , which approximately convert to and in the rest–frame of the galaxies. Converting the UV–optical colors of the UIT–sample galaxies to the these colors provides a useful evolution scenario because high–redshift galaxies are empirically observed to have these colors. Panel (c) of figure 12 shows the measured internal color dispersion as a function of redshift for the case of pure color evolution, with no luminosity evolution (i.e., the –band luminosities are unchanged from the values). For this case, the internal color dispersion in these galaxies is robust to — even for for NGC 3031, which now has high enough S/N in the rest–frame UV images from which to accurately derive .
Combining both the luminosity and color evolution provides consistent measures of the internal color dispersion for all the galaxies simulated here out to . In panel (d) of figure 12, we show the measured values for the simulated UIT–sample galaxies, and including luminosity evolution (by the amounts used in panel (b)) and color evolution used to match the HDF–N/LBG colors (as in panel (c)). Note that we have implicitly assumed no morphological evolution in these galaxies. We conclude that under these evolutionary scenarios with simple changes in the color and luminosity, the intrinsic internal color dispersion of each of these galaxies is robustly measured even for . This seems to suggest that if the UIT–sample galaxies were observed at with the luminosities and UV–optical colors that are characteristic of high–redshift galaxy populations, then their UV–optical internal color dispersion values would be measurable in deep HST–like observations.
Inspecting the simulated images for each galaxy produces some insights into the observed morphological and internal color changes as a function of redshift. The internal color dispersion in NGC 1068 is suppressed as the galaxy is transformed under the HDF–N conditions. The reduction in signal apparently results from the convolution with the NICMOS PSF and adding the backgrounds of the HDF–N data. Thus, the internal colors of distant galaxies may have some bias against systems in which the internal color dispersion is dominated by a combination of very a nucleated starburst and AGN activity.
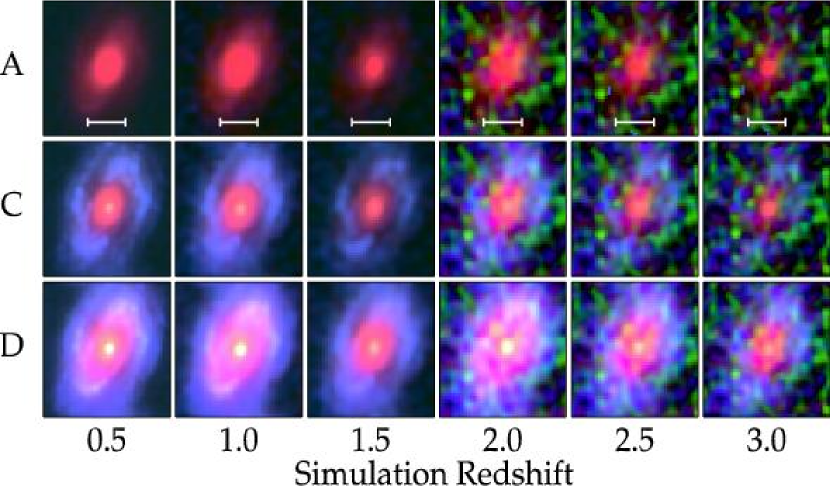
Figures 13–15 illustrate the appearance of NGC 3031, NGC 628, and UGC 06697, respectively, under the evolution models of no evolution (A), pure color evolution with no change in luminosity (C), and color evolution and brightening of luminosity (D), as marked in each figure (see discussion above). The internal color dispersion of NGC 628 is reduced after convolution of the NICMOS PSF and addition of the HDF–N backgrounds. However, the resulting values are significant [; ], and these are consistent with values derived for other potentially large spiral galaxies at in the HDF–N data (see Paper II). In the case of UGC 06697, which is already relatively blue in its UV–to–optical colors, surface brightness dimming makes the galaxy essentially undetectable for . However, by brightening the galaxy in luminosity (by two magnitudes) its morphology is easily discernible to . The patchy star–formation, which presumably is responsible for the observed internal color dispersion, also produces a measurable signal out to this redshift. Strong internal color dispersion is measured in NGC 3031 under luminosity evolution combined with color evolution, which appears to derive entirely from largely segregated stellar populations that produce the red bulge and blue spiral arm colors. If such systems exist at with the luminosities and colors of observed galaxies at these redshifts, then they would be detectable with sufficient S/N for quantitative morphological analysis.
One interesting conclusion from these simulations is that even under the assumption of no evolution in the (rest–frame) –band luminosities the UIT galaxies would be detectable in deep NICMOS images (like those for the HDF–N). The limiting magnitude () for the HDF–N data is (Dickinson et al., 2003b). Taking the distance modulus for a galaxy to , this limiting magnitude corresponds roughly to an absolute, –band magnitude, , in the rest–frame (although this neglects surface–brightness dimming effects on aperture measurements). The majority of the galaxies in the UIT sample have luminosities in excess of this limit, and would be detected if present even out to these high redshifts. In contrast, our simulations agree with previous statements that the UV luminosities are generally too faint to be visible for redshifts much greater than unity (see also, e.g., Giavalisco et al., 1995; Kuchinski et al., 2000; Windhorst et al., 2002).
6 Summary
We have discussed an indicator of the internal color dispersion within galaxies, which has quantified the morphological –correction, namely, the dependence of galaxy morphology with observed wavelength. We have measured the UV–optical internal color dispersion of a sample of local galaxies using archival UIT data at 1500 Å and 2500 Å, and ground–based –band images. Our findings show that the internal color dispersion between the UV and optical passbands is sensitive to the distribution of the stars that emit at these wavelengths, and specifically that it gauges the spatial heterogeneity of these stellar populations.
The mid–type spiral galaxies in the UIT sample generally exhibit the highest dispersion in their ultraviolet–to–optical internal colors, e.g., NGC 3031, NGC 4321, NGC 628. The high dispersion apparently results from differences in the stellar content that constitute the bulge, disk, and spiral–arm components. In the case of NGC 3031 (one of the nearest examples of a “grand–design” spiral), the bulge–spiral-arm dichotomy clearly dominates the derived internal color dispersion between both the UIT/MUV and –bands, and between the UIT/FUV and UIT/MUV images. This illustrates the effects that segregated stellar populations of varying ages (older bulge populations versus the star–forming spiral arms) have on the dispersion of the internal UV–to–optical colors.
Irregulars and later–type spirals also show significant internal color dispersion, e.g., NGC 2146, NGC 3034, UGC 06697, although with values that are generally lower than that of the mid–type spirals. The smaller values presumably arise from the presence of young stellar populations that dominate the flux emission at UV–to–optical wavelengths, which are modulated by (varying) dust absorption.
Ellipticals, lenticulars, and early–type spirals generally have low or negligible internal color dispersion, as evidenced by NGC 1316, NGC 1399, and NGC 4486. The general result, given that early–type galaxies have small internal color dispersion coupled with the relative absence of ongoing star formation, is that older well–mixed stellar populations dominate the flux at UV–to–optical wavelengths.
There is little dependence between the UV–optical total galaxy colors and for the UIT sample. However, the values exhibit some general trends with the integrated colors. Galaxies with the bluest and reddest colors, i.e., and , generally have lower values, with smaller scatter. For galaxies with the bluest colors, a single (young) stellar population likely dominates the light at UV–optical colors, which amounts to little internal color dispersion. The (small) internal color dispersion values in such systems is likely caused by dust absorption variations. Likewise, the stellar populations that dominate these colors in galaxies with must be relatively co-spatial. Galaxies with intermediate MUV–optical colors, , show a very large scatter in their values.
The scatter in for intermediate MUV–optical colors hints at the physical conditions that produce high , and likely implies that these colors are in a sense necessary. We have used simple simulations to understand how a mix of young and old stellar populations affects the MUV–optical internal color dispersion. We find that high results only in the case that a small amount of the total galaxy stellar mass is in young stellar populations, i.e., % by mass. In this range of stellar–mass fractions, the young stellar populations dominate the MUV flux emission, while the older stellar populations contribute substantially at optical wavelengths. At smaller fractions, the older stars begin to dominate the MUV emission, and at higher stellar–mass fractions, the young stellar populations dominate the flux from UV–to–optical wavelengths.
We find an interesting relationship between the values and the optical–to–FIR flux ratios, , in the UIT sample. Galaxies with higher show an increased upper envelope and scatter in relative to galaxies with lower optical–to–FIR flux ratios. The reason for this is not completely clear. However, because galaxies with lower optical–to–FIR flux ratios show evidence for heavy dust absorption and span a smaller range of values, this seems to imply that our internal color dispersion statistic is more sensitive to variations in the galaxies’ stellar populations rather than to dust absorption. To investigate this further will require future galaxy surveys that cover UV–to–FIR wavelengths for large galaxy samples, which should be possible with planned surveys with SIRTF.
We have simulated the appearance of local galaxies from the UIT sample at cosmological distances () to investigate the application of internal color dispersion statistic to high–redshift galaxies in deep, HST images. Many of the UIT–sample galaxies have luminosities that are sufficiently bright in the rest–frame optical to be detected within the limits of the currently deepest near–infrared surveys even with no evolution. Thus, large, present–day galaxies (if indeed they were present) would be detected in these surveys. However, we find (in agreement with previous studies) that the UIT galaxies generally have UV luminosities too faint for detection at high redshift () even out to the limits of the deepest HST images, and far below the S/N requirements for reliable quantitative morphological analysis. However, under basic assumptions that the luminosities and UV–to–optical colors of the local galaxies are comparable to the values of high–redshift objects, we have shown that the galaxies’ derived internal color dispersion remains measurable out to .
In a forthcoming paper (Paper II), we apply our internal color dispersion statistic to samples of high–redshift galaxies at and using HST data available for the HDF–N. As we have demonstrated here, this statistic is highly useful for identifying galaxies with both segregated stellar populations that dominate to different wavelengths of the galaxies’ SEDs, and variable, “patchy” dust opacity. The UIT sample studied here will thus provide a useful benchmark for these high redshift comparisons for interpretation of the assembly and evolution of the stellar content in these galaxies over time.
Appendix A Simulating the Appearance of Galaxies at Cosmological Distances
To simulate galaxy properties shifted to more distant reference frames in an expanding Universe, we have generally followed the prescription outlined by Giavalisco et al. (1995). This method implicitly assumes zero evolution between the galaxies’ appearances. The original images are first converted to physical flux density units (flux per unit frequency, ). The images are then convolved with a kernel such that final rebinned image matches the required PSF. Shifting the galaxy images to cosmological distances imposes two effects. First, the apparent size of the galaxy changes via the angular diameter distance (i.e., the angular size of a fixed rod at redshift, ). Thus, when one observes a galaxy with angular size, , and distance, , shifted to a new cosmological distance, its apparent angular size subtends an angle, , where is the angular diameter distance (and depends on the underlying cosmology). The relation between the observed size of a galaxy at a distance, , imaged with a detector with a physical pixel scale, , and the size when subsequently imaged at a distance, , with an intrinsic pixel scale, , can then be expressed as,
| (A1) |
The constant, , is the factor by which the image of the galaxy must be “rebinned” to simulate its observed appearance at higher redshift in the given detector. Rewriting equation A1 then yields, . This rebinning factor is applied to each galaxy image, averaging over pixel intensity values in order to preserve the object surface brightness, which is independent of cosmology. To do the rebinning, we have used the IDL function FREBIN, which has the property that each input pixel is equally represented in the output matrix (i.e., flux is preserved). This algorithm sums over the flux contributions from the fraction of each input pixel within the boundary of the output pixel. Thus, the total image flux or surface brightness can be conserved (the latter where each output pixel is normalized by the pixel area).
The second effect imposed by shifting reference frames derives from the relativistic cosmological expansion. For example, the surface brightness is defined as the energy from an object emitted per unit time per unit area per area of the incident detector (i.e., the flux per unit area). The energy, time, and area all transform with the cosmological redshift. Counting “powers” of , the energy of an incident photon is reduced by one power, and the length of unit time and each of the two dimensions of the unit area are each stretched by one power. Thus, the net affect of the cosmological expansion is to attenuate the observed bolometric surface brightness by . To account for these effects we have utilized the property that the intrinsic galaxy luminosity (the flux integrated over the surface area) is preserved. This leads to the equation,
| (A2) |
where, , is the galaxy’s flux density averaged over the number of pixels, (with corresponding area, , per pixel), and is the luminosity distance. Note that for local galaxies, is nil. The observed and redshifted bandpasses here have generally been selected such that [due to the fact that the cosmological expansion degrades the energy of an observed photon by the factor of ]. Thus, this makes the approximation that the two passbands have widths that sample co-moving wavelength ranges in the observed frame, i.e., . Therefore, equation A2 becomes,
| (A3) |
where this has utilized the facts that the physical pixel scale corresponds to a physical size on the sky by , and the angular diameter distance is related to the luminosity distance by .
References
- Abraham et al. (1999) Abraham, R. G., Ellis, R. S., Fabian, A. C., Tanvir, N. R., & Glazebrook, K. 1999, MNRAS, 303, 641
- Abraham et al. (1996) Abraham, R. G., Tanvir, N. R., Sanitago, B. X., Ellis, R. S., Glazebrook, K., & van den Bergh, S. 1996, MNRAS, 279, 47
- Bahcall, Guhathakurta, & Schneider (1990) Bahcall, J. N., Guhathakurta, P., & Schneider, D. P. 1990, Science, 248, 178
- Bell & de Jong (2001) Bell, E. F. & de Jong, R. S. 2001, ApJ, 550, 212
- Bell & Kennicutt (2001) Bell, E. F., & Kennicutt, R. C., Jr. 2001, ApJ, 548, 681
- Bendinelli et al. (1990) Bendinelli, O., Zavatti, F., Parmeggiani, G., & Djorgovski, S. 1990, AJ, 99, 774
- Bernstein, Freedman, & Madore (2002) Bernstein, R. A., Freedman, W. L., & Madore, B. F. 2002, ApJ, 571, 107
- Bertin & Arnouts (1996) Bertin, E., & Arnouts, S. 1996, A&AS, 117, 393
- Blanton et al. (2001) Blanton, M. R. et al. 2001, AJ, 121, 2358
- Bohlin et al. (1991) Bohlin, R. C. et al. 1991, ApJ, 368, 12
- Brinchmann et al. (1998) Brinchmann, J., et al. 1998, ApJ, 499, 112
- Brown et al. (2000) Brown, T. M., Bower, C. V., Kimble, R. A. , Sweigart, A. V., & Ferguson, H. C. 2000, ApJ, 532, 308
- Bruzual & Charlot (1993) Bruzual, G. A., & Charlot, S. 1993, ApJ, 405, 538
- Calzetti (2001) Calzetti, D. 2001, PASP, 113, 1449
- Calzetti et al. (2000) Calzetti, D., Armus, L., Bohlin, R. C., Kinney, A. L., Koornneef, J., & Storchi–Bergmann, R. 2000, ApJ, 533, 682
- Calzetti, Kinney, & Storchi–Bergmann (1994) Calzetti, D., Kinney, A. L., & Storchi–Bergmann, T. 1994, ApJ, 429, 582
- Cardelli, Clayton, & Mathis (1989) Cardelli, J. A., Clayton, G. C., & Mathis, J. S. 1989, ApJ, 345, 245
- Cheng et al. (1996) Cheng, K.–P., Hintzen, P., Smith, E. P., Angione, R., Talbert, F., Collins, N., & Stecher, T. 1996, Ground–Based CCD Imaging in Support of the ASTRO–1/UIT Space Shuttle Mission (3 vols.; NSSDC CD–ROM)
- Conselice et al. (2000) Conselice, C. J., Bershady, M. A., & Jangren, A. 2000, ApJ, 529, 886
- Conselice, Gallagher, & Wyse (2001) Conselice, C. J., Gallagher, J. S., & Wyse, R. F. G. 2001, AJ, 122, 2281
- Conselice (2003) Conselice, C. J., 2003, ApJS, 147, 1
- de Jong (1996) de Jong, R. S. 1996, A&A, 313, 377
- de Vaucouleurs et al. (1991) de Vaucouleurs, G., de Vaucouleurs, A., Corwin Jr., H.G., Buta, R.J., Fouque, P., & Paturel, G. 1991 The Third Reference Catalogue of Bright Galaxies, (New York: Springer–Verlag) [RC3]
- Dickinson (1999) Dickinson, M. 1999, in After the Dark Ages: When Galaxies were Young (the Universe at ), eds. S. Holt, & E. Smith (New York, American Institute of Physics), 122
- Dickinson et al. (2003a) Dickinson, M., Papovich, C., Ferguson, H. C., & Budavári, T. 2003a, ApJ, 587, 25
- Dickinson et al. (2003b) Dickinson, M., 2003b, in preparation
- Dorman, 0’Connel, & Rood (1995) Dorman, B., O’Connel, R. W., & Rood, R. T. 1995, ApJ, 442, 105
- Elmegreen et al. (1996) Elmegreen, B. G., Elmgreen, D. M., Salzer, J. J., & Mann, H. 1996, ApJ, 467, 579
- Elmegreen et al. (1994) Elmegreen, D. M., Elmegreen, B. G., Lang, C., & Stephens, C. 1994, ApJ, 425, 57
- Eskridge, et al. (2003) Eskridge, P. B. et al. 2003, ApJ, 586, 923
- Ferrarese et al. (1996) Ferrarese, L. et al. 1996, ApJ, 464, 568.
- Freedman et al. (1994) Freedman, W. L. et al. 1994, ApJ, 417, 680
- Freedman et al. (2001) Freedman, W. L. et al. 2001, ApJ, 553, 47
- Fruchter & Hook (2002) Fruchter, A. S. & Hook, R. N. 2002, PASP, 114, 144
- Gadotti & dos Anjos (2001) Gadotti, D. A., & dos Anjos, S. 2001, AJ, 122, 1298
- Gavazzi et al. (1998) Gavazzi, G., Catinella, B., Carrasco, L., Boselli, A., & Contursi, A. 1998, AJ, 115, 1745
- Giavalisco et al. (1995) Giavalisco, M., Livio, M., Bohlin, R. C., Macchetto, F. D., & Stecher, T. P. 1995, AJ, 112, 369
- Giavalisco, Steidel, & Macchetto (1996) Giavalisco, M., Steidel, C. C., & Macchetto, F. D. 1996, ApJ, 470, 189
- Hutchings et al. (1990) Hutchings, J. B., Lo, E., Neff, S. G., Stanford, S. A., & Unger, S. W. 1990, AJ, 100, 60
- Kohle et al. (1996) Kohle, S., Kissler–Patig, M., Hilker, M., Richtler, T., Infante, L., & Quintana, H. 1996, A&A, 309, 39
- Kron (1980) Kron, R. G. 1980, ApJS, 43, 305
- Kuchinski et al. (2001) Kuchinski, L. E., Mardore, B. F., Freedman, W. L., & Trewhella, M. 2001, AJ, 122, 729
- Kuchinski et al. (2000) Kuchinski, L. E., et al. 2000, ApJS, 131, 441
- Lauer (1999) Lauer, T. R. 1999, PASP, 111, 1434
- Lilly et al. (1998) Lilly, S. J., et al. 1998, ApJ, 500, 75
- Lowenthal et al. (1997) Lowenthal, J. D., et al. 1997, ApJ, 481, 673.
- Marcum et al. (2001) Marcum, P. M., et al. 2001, ApJS, 132, 129
- Marleau & Simard (1998) Marleau, F. R., & Simard, L. 1998, ApJ, 507, 585
- McMillan, Ciardullo, & Jacoby (1993) McMillan, R., Ciardullo, R., & Jacoby, G. H. 1993, ApJ, 416, 62
- McNamara & O’Connell (1989) McNamara, B. R. & O’Connell, R. W. 1989, AJ, 98, 2018
- Menanteau, Abraham, & Ellis (2001) Menanteau, F., Abraham, R. G., & Ellis, R. S. 2001, MNRAS, 322, 1
- Moshir et al. (1990) Moshir, M. et al. 1990, IRAS Faint Source Catalogue, version 2.0 (1990)
- Neff et al. (1994) Neff, S. G., Fanelli, M. N., Roberts, L. J., O’Connell, R. W., Bohlin, R., Roberts, M. S., Smith, A. M., & Stecher, T. P. 1994, ApJ, 430, 545
- Ohl et al. (1998) Ohl, R. G. et al. 1998, ApJ, 505, L11
- Oke, Gunn, & Hoessel (1996) Oke, J., Gunn, J., & Hoessel, J. 1996, AJ, 111, 29
- Papovich, Dickinson, & Ferguson (2001) Papovich, C., Dickinson, M., & Ferguson, H. C. 2001, ApJ, 559, 620
- Papovich et al. (2003) Papovich, C., Dickinson, M., Giavalisco, M., Conselice, C. C., & Ferguson, H. C. 2003, in preparation (Paper II)
- Rice et al. (1988) Rice, W., Lonsdale, C. J., Soifer, B. T., Neugebauer, G., Koplan, E. L., Lloyd, L. A., de Jong, T., & Habing, H. J. 1988, ApJS, 68, 91
- Roberts & Haynes (1994) Roberts, M. S., & Haynes, M. P. 1994, ARA&A, 32 115
- Roberts et al. (2001) Roberts, T. P., Schurch, N. J., & Warwick, R. S. 2001, MNRAS, 324, 737
- Romaniello et al. (2002) Romaniello, M., Panagia, N., Scuderi, S., & Kirshner, R. P. 2002, AJ, 123, 915
- Schade et al. (1995) Schade, D., Lilly, S. J., Crampton, D., Hammer, F., Le Fevre, O., & Tresse, L. 1995, ApJ, 451, L1
- Schlegel, Finkbeiner, & Davis (1998) Schlegel, D. J, Finkbeiner, D. P., & Davis, M. 1998, ApJ, 500, 525
- Schweizer (1980) Schweizer, F. 1980, ApJ, 237, 303
- Sharina et al. (1996) Sharina, M. E., Karachentsev, I. D., & Tikhonov, N. A. 1996, A&AS, 119, 499
- Shaya et al. (1996) Shaya, E. J. et al. 1996, AJ, 111, 2212
- Simard et al. (1999) Simard, L., et al. 1999, ApJ, 519, 563
- Stecher et al. (1997) Stecher, T. P., et al. 1997, PASP, 109, 584
- Trager et al. (2000) Trager, S. C., Faber, S. M., Worthey, G., & González, J. J. 2000, AJ, 120, 165
- van den Bergh (2002) van den Bergh, S. 2002, PASP, 114, 79
- van den Bergh, et al. (1996) van den Bergh, S., Abraham, R. G., Ellis, R., S., Tanvir, N. R., & Glazebrook, K. G. 1996, AJ, 112, 359
- van den Bergh, Cohen, & Crabbe (2001) van den Bergh, S., Cohen, J. G., & Crabbe, C. 2001, AJ, 122, 611
- Williams et al. (1996) Williams, R. E., et al. 1996, AJ, 112, 1335
- Windhorst et al. (2002) Windhorst, R. A., et al. 2002, ApJS, 143, 113