SGR A EAST AND ITS SURROUNDINGS OBSERVED IN X-RAYS
Abstract
We report the results of an XMM-Newton observation of Sgr A East and its surroundings. The X-ray spectrum of Sgr A East is well represented with a two-temperature plasma model with temperatures of 1 and 4 keV. Only the iron abundance shows clear spatial variation; it concentrates in the core of Sgr A East. The derived plasma parameters suggest that Sgr A East originated in a single supernova. Around Sgr A East, there is a broad distribution of hard X-ray emission with a superimposed soft excess component extending away from the location of Sgr A East both above and below the plane. We discuss the nature of these structures as well as the close vicinity of Sgr A*.
INTRODUCTION
The Galactic Centre region consists of many complex and interesting structures, which can be observed in a variety of windows encompassing the radio to -ray bands (e.g. Mezger et al. 1996). The brightest region in the radio continuum band is named Sgr A, which is resolved into Sgr A West and Sgr A East. Sgr A West includes a super massive black hole Sgr A∗, of which the mass is (2–3) M⊙ (e.g. Genzel et al. 2000), as well as a three-arm spiral-like structure orbiting Sgr A∗ (the mini-spiral) and the central dense star cluster (IRS 16 star cluster). Sgr A West is surrounded by Sgr A East in projection. Sgr A East shows an oval shell-like structure in the radio continuum. There is quite good evidence for a physical interaction between Sgr A West and East (e.g. Yusef-Zadeh et al. 2000), although many of the details remain uncertain.
The shell-like structure of Sgr A East suggests it may be a supernova remnant (SNR), SNR 000.0+00.0 (Jones 1974). On the other hand, alternative interpretations have also been proposed, e.g. the remnant of an explosion caused by the central massive black hole Sgr A∗. In any case, both the origin of Sgr A East and its past evolution remain open questions.
The surface brightness of the diffuse radio non-thermal emission surrounding Sgr A is much brighter than other nearby radio structures. Some of the latter are filamentary and possibly a part of another SNR (e.g. Ho et al. 1985). There are also giant molecular clouds in vicinity of Sgr A, which are probably undergoing some physical interaction with the radio continuum structures (e.g. Coil and Ho 2000). The presence of extended hot plasma as detected in X-ray observations (e.g. Yusef-Zadeh et al. 2000; Koyama et al. 1996) must also play an important role in relation to both the structure and the evolution of Sgr A. Furthermore, the detection of the electron-positron annihilation line, high-energy cosmic ray excess, and a GeV source (Mayer-Hasselwander et al. 1998) from somewhere in the Galactic Centre region, most likely related with Sgr A∗ or Sgr A East, implies highly energetic activity and/or particle acceleration.
The ultimate goal of studies of the Sgr A region is to understand the distribution and state of the matter, the complex nature of the interactions and the dominant emission and absorption processes in operation, as a step towards a better general understanding of the nature of the central regions of galaxies. At the same time, the more specific study of a SNR (candidate) in the Galactic Centre may help us to understand the special interstellar environment and hopefully provide information relating to its evolution and/or formation.
The hard X-ray imaging observations of the Sgr A region were first made with ASCA (Koyama et al. 1996) and traced an extended distribution of X-ray emission originating from a thin thermal plasma. More recently this region has been observed by Chandra/ACIS, at a spatial resolution of 0.5 arcsec (Baganoff et al. 2002; Maeda et al. 2002). Sgr A∗ was, for the first time, resolved in the X-ray band (Baganoff et al. 2002) and, in addition, bright diffuse X-ray emission from Sgr A East detected (Maeda et al. 2002). The X-ray emission associated with Sgr A East fills the inner part of the region defined by a non-thermal radio shell and has a spectrum characteristic of thin thermal emission at a temperature keV and a metal abundance (Maeda et al. 2002).
In this paper, we report the XMM-Newton results for Sgr A East and its surroundings as derived from both X-ray image and spectral data. XMM-Newton observations benefit from the large effective area and good imaging capability (5 arcsec) of the XMM mirrors as well as good energy resolution of the EPIC CCD detectors ( at 5.9 keV). With this capability, the quality of the spectrum and statistics of the image are remarkable. We adopt the distance of 8.0 kpc to the Galactic Centre throughout this paper (Reid 1993).
OBSERVATION
The XMM-Newton observation of the Sgr A region was made on 2001 September 4. In this paper, we concentrate on the results from the European Photon Imaging Camera (EPIC) on board XMM-Newton. The EPIC instrument consists of two MOS CCDs cameras (MOS1 and MOS2) and one pn CCD camera, which operate simultaneously. The MOS and pn cameras were used in Full Frame and Extended Full Frame mode, respectively, with the medium filter selected. Data reduction and filtering were carried out with the Standard Analysis Software (SAS) Ver.5.4. We accepted pixel patterns of 0–12 (single to quadruple events) for the MOS CCDs but only single events (pattern 0) recorded by the pn system, because of the calibration uncertainties for other pixel patterns in the pn Extended Full Frame mode. The effective exposure times for MOS1, 2 and pn after the background filtering were 22.4 ks, 24.0 ks, and 17.5 ks, respectively.
X-RAY IMAGES OF SGR A EAST AND ITS SURROUNDINGS
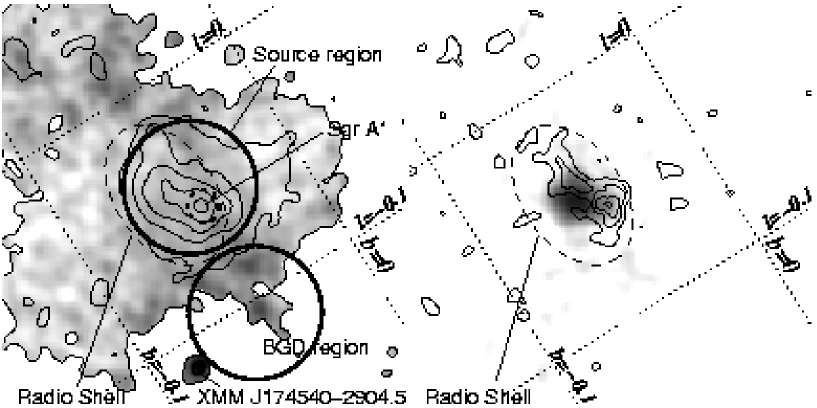
The left panel of Figure 1 shows the X-ray hardness ratio and the 2–9 keV surface brightness measured by the MOS (1+2) cameras within a field of view centred on Sgr A. The region surrounding Sgr A∗, the central massive black hole, is the brightest in the image, although Sgr A∗ itself was not spatially resolved. There is a further X-ray emission to the east from Sgr A∗, elongated nearly parallel to the Galactic plane. The e-folding radius of the core of this extended source is 28′′ in the 2–10 keV band, although the region with significantly enhanced surface brightness (relative to the surroundings) has a major axis dimension of .
As shown in Figure 1, the X-ray emitting region is contained within the radio shell and the molecular dust ring, as is also readily apparent from the Chandra observation (Maeda et al. 2002). This suggests the strong correlation between the extended X-ray emission and the radio structure, Sgr A East. Henceforce, we call this X-ray emission Sgr A East.
Figure 1 also shows the hardness image in which the regions to the north and south of Sgr A East in Galactic coordinates appear to exhibit enhanced soft X-ray emission. Alternatively, one might argue that a narrow ( wide) strip along the Galactic plane has a harder spectral form. These two options suggest either the presence of a soft outflow from the Galactic Centre or the preferential absorption of the soft (2–4.5 keV) X-rays along the Galactic plane. However, since the scale height of the molecular clouds in the Galactic Centre region is 5′–9′ (Tsuboi et al. 1999; Sakano 2000), which corresponds to the full extent of our X-ray picture rather the narrow “absorption” feature identified above and the fact that the soft enhancement is significantly brighter than its adjacent regions, favours the outflow argument. However, we note that the soft emission does not seem to emanate directly from Sgr A∗, but from the region shifted by a couple of arcminutes east of Sgr A∗. Further detailed study is beyond the scope of this paper.
In the field of view, we discovered an apparently very hard source, XMM J1745402904.5, south of Sgr A∗, as indicated in Figure 1. This source was found to be extended and have a non-thermal radio counterpart, which is well-aligned with the X-ray structure (Ho et al. 1985; Sakano et al. 2003). Detailed results on this source are presented elsewhere (Sakano et al. 2003).
Since the X-ray spectrum of Sgr A East shows distinct emission lines (see the next section), we also made line narrow-band images corresponding to the He-like iron (6.7-keV) and sulfur (2.4-keV) lines. In this case the underlying continuum is subtracted using adjacent bandpasses and assuming an averaged spectral shape (Figure 1 right panel). The 6.7-keV line is clearly more concentrated in the core of Sgr A East than the continuum (Figure 1). This implies that the core of Sgr A East is more abundant in iron or higher in temperature, or perhaps a combination of these factors. In contrast, the 2.4-keV line peak is located on Sgr A∗. These features are quantitatively evaluated by applying spatially-resolved spectral analysis, as described below.
X-RAY SPECTRA OF SGR A EAST
| S | Ar | Ca | Fe |
|---|---|---|---|
| 1.00 | 2.5 | 1.9 | 4.1 |


We accumulated the source spectrum of Sgr A East from a region of radius 100′′ (see Figure 1), but excluding both Sgr A∗ and its immediate surroundings and the region around a bright soft point source. We extracted a background spectrum from a nearby region at nearly the same Galactic latitude so as to minimize the influence of the spatial fluctuation of the background plasma. Figure 2 shows the resulting background-subtracted pn spectra (although the spectral analysis was carried out using simultaneous fits to the MOS 1, MOS 2 and pn spectra). Several strong emission lines at energies corresponding to K lines from highly ionized ions, can be seen. This implies that a significant amount of the emission originates in a hot thin thermal plasma.
From the line ratios of K lines from helium(He)-like and hydrogen(H)-like atoms, we estimated the ionization temperature for each atom. The temperatures are found to be significantly different from element to element; 1 keV for sulfur, 2 keV for argon and calcium, and 4 keV for iron (Table 1). The clear implication is that the plasma has a multi-temperature characteristic (or originates in a combination of processes).
As a first approximation, we applied a two-temperature thin-thermal plasma model (MEKAL) with a common absorption column, allowing the abundances of silicon, sulfur, argon, calcium, and iron in both the plasmas to be free. The abundance of nickel was linked to that of iron. In the best-fitting result (Table 2) there still remains a counts excess below 2 keV.
Then, we examined the possibility that the absorption is patchy. Specifically we assumed that a certain ratio (: a free parameter) of the emission is absorbed by H cm-2 (fixed) with the remaining fraction subject to absorption by roughly twice the fixed column density (with the higher column density a free parameter of the fit). This resulted in a significantly improved fit (with a probability by the F-test of 99.97 %; (Table 2; Figure 1) and removed the bulk of the systematic trend apparent in the residuals. The Galactic Centre region is known to be full of molecular clouds of various sizes from radio and far infrared observations. A partial absorption model with a large covering fraction (i.e. small fraction for the ‘hole’) may, therefore, be quite realistic. We note that the inclusion of another lower temperature component instead of a partial absorption model is found to give neither good improvements in the fitting nor a realistic soft X-ray luminosity.
The main results of the spectral analysis are that: (i) the temperatures of the two components are 1 keV and 4 keV, which is fully consistent with the estimate based on the line-ratios; (ii) the lower-temperature component has by an emission measure an order of magnitude larger than the higher-temperature component; (iii) the metal abundances are a few to several tens per cent higher than the solar value on average, although calcium is significantly more abundant (2 solar) than the other elements.
| Params. | Unit | — Data — | ||
| Sgr A East | Sgr A East | Sgr A∗ | ||
| Frac(i) | — | 0.93 (0.82–0.97) | 0.93 (fixed) | |
| (i) | (H cm-2) | 13.5 (12.8–14.2) | 14.5 (13.7–16.1) | 14.1 (13.2–15.0) |
| (ii) | (H cm-2) | — | 7.0 (fixed) | 7.0 (fixed) |
| (1) | (keV) | 4.23 (3.82–4.71) | 4.40 (3.95–4.91) | 5.70 (4.75–6.79) |
| Norm(1) | 1.66 (1.33–1.93) | 1.68 (1.40–2.02) | 0.47 (0.38–0.63) | |
| (2) | (keV) | 0.94 (0.85–1.00) | 0.96 (0.90–1.03) | 0.96 (0.81–1.10) |
| Norm(2) | 11.6 (9.5–12.7) | 15.9 (11.5–20.3) | 4.0 (2.8–6.5) | |
| 5.1 (3.5–7.3) | 1.83 (1.15–2.96) | 0.96 (0.36–1.94) | ||
| 1.94 (1.56–2.47) | 1.46 (1.18–1.77) | 1.81 (1.41–2.34) | ||
| 1.23 (0.84–1.67) | 0.96 (0.67–1.27) | 1.12 (0.64–1.74) | ||
| 2.54 (2.04–3.07) | 2.04 (1.63–2.47) | 0.63 (0.05–1.23) | ||
| 1.33 (1.18–1.51) | 1.26 (1.13–1.42) | 0.50 (0.40–0.63) | ||
| Fe-K | (ph s-1 cm-2) | 1.4 (1.1–2.2) | 1.2 (0.8–1.8) | 0.1 (0.0–0.4) |
| /dof | 374.5/321 | 359.3/320 | 217.2/188 | |
| (MOS) (erg cm-2) | 12.6 | 12.5 | 3.4 | |
Spectral variation within Sgr A East
Next, we examine the possible spectral variation within Sgr A East. We extracted spectra from concentric regions of radii of 28′′ (the core region), 28′′–60′′ (the peripheral region) with the centre at the peak of the 6.7-keV line image (Figure 1), and from the outer part with a radius of (the outer region) with the same centre as defined in the previous sub-section (see Figure 1). We fitted these spectra with the final version of the model described earlier, fixing the covering fraction for the absorption at the best-fitting value. Analysis shows that the iron abundance is significantly higher in the core (Z ) in comparison to the outer region (Z ). In contrast the abundances of other metals do not vary significantly within Sgr A East.
Plasma parameters
From the apparent extension of Sgr A East in the hard X-ray band of 28 arcsec in radius, we calculate the total plasma volume to be 1.6 cm3, assuming a spherical shape. The plasma is found to comprise two components and we assume that each component exists separately in the pressure balance with the other. Using the best-fitting parameters for the core region and introducing the total filling factor , which is the sum of the filling factors of the two components, we estimated the filling factor of and , the density of and , a total energy of erg, and a total X-ray emitting mass of 1.8 M⊙, where the subscriptions of L and H mean the lower- and higher-temperature components, respectively.
X-RAY SPECTRA OF SGR A*
According to the results reported by Baganoff et al. (2002) based on the 1999 Chandra observation, the compact X-ray source in Sgr A∗ is typically very faint with a flux erg s-1 cm-2, whereas the integrated emission from other point sources and diffuse emission within a 10′′-radius region is erg s-1 cm-2. We did not resolve Sgr A∗ in our XMM data (see the image section). We collected the spectrum from a circular region of radius 24′′, and found the flux to be erg s-1 cm-2. Taking the highly elevated diffuse emission (Baganoff et al. 2002) into account, the integrated flux measured with XMM are fully consistent with the Chandra result. Note the time interval including the Sgr A∗ flare reported by Goldwurm et al. (2003) was not included in our analysis.
We fitted the spectrum with the same model for Sgr A East, with the absorption parameters fixed. Table 2 summarises the result. We obtained temperatures of 0.96 (0.81–1.10) keV and 5.7 (4.8–6.8) keV, sulfur abundance of 1.8 (1.4–2.3), argon abundance of 1, and iron abundance of 0.5 (0.4–0.6) solar. As before, the emission measure of the lower-temperature component is about 10 times larger than that of the higher-temperature one. The increase in the higher temperature to 6 keV may be due to the contribution from discrete point sources, including Sgr A∗ itself. We note that the iron abundance is found to be significantly lower than Sgr A East, 0.5 solar. This low iron-abundance is very similar to the value obtained for the outer region of Sgr A East.
DISCUSSION
What is Sgr A East?
The total energy of erg is smaller than the nominal energy for a SNR ( erg). Since the plasma has already reached ionization equilibrium, this estimate does apply to the full thermal energy in the observable X-ray band. The total energy derived here is consistent with the Chandra measurements reported by Maeda et al. (2002). If Sgr A East has a SNR origin, one SNR can easily account for the observed structure and there is no need to invoke multiple supernovae as suggested by Mezger et al. (1989).
On the other hand, the estimated mass of 1.8 is sufficiently large to account for a supernova. If there is some amount of unobserved mass, the total mass may be even larger. With an age of 8000 yr of Sgr A East (Mezger et al. 1989), this mass may originate as either the ejecta or swept-up interstellar material. The localisation of the iron abundance enhancement suggests that the mass is predominantly that of the ejecta, and that a type-II SNR with a low-mass progenitor or a type-Ia SNR is the likely scenario for the origin of Sgr A East.
The most remarkable characteristic of Sgr A East is its unusually high temperature of 4 keV. In fact, this temperature is comparable with, or even higher than, the temperatures of young ‘historical’ SNRs, Cas A, Kepler, and Tycho. One possible scenario to explain this high temperature is the shock has interacted with an ambient plasma already preheated to a temperature of several keV. In fact, it is suggested that the Galactic Centre region is filled with the 10 keV plasma (e.g. Koyama et al. 1996), although other interpretations of the observed X-ray spectra are now emerging (e.g. Dogiel et al. 2002).
Comments on the abundance in the Galactic Centre region
The abundance in the Galactic Centre region is uncertain at present, mainly because of the difficulty of the measurements. The extrapolation of the abundance gradient in the Galactic plane (e.g. McWilliam et al. 1997) points to an abundance higher than solar by a factor of 3 or more. A radio measurement by Mezger et al. (1979) gave an (oxygen) abundance of 2 solar. Recent measurements of X-ray reflection nebulae model also give a relatively high (iron) abundance for iron ( solar) in the Sgr B2 cloud (Murakami et al. 2001). On the other hand, measurements of the iron abundance in the atmosphere of infrared stars in the Galactic Centre region, which may represent the most precise technique available, give an inconsistent value of solar (Carr et al. 2000; Ramírez et al. 2000).
Our result shows that the iron abundance in the high-temperature interstellar matter is sub-solar in the region around Sgr A∗. Therefore, it rather favours the smaller abundance, suggested by the near infrared observations. We note that the infrared star (IRS 7) observed by Carr et al. (2000) is located very close (0.2 pc away) to Sgr A∗, and thus samples basically the same region as the X-ray data.
ACKNOWLEDGEMENTS
We are grateful to Dr. R. Willingale, Dr. Y. Maeda and Dr. S. Park for their valuable comments. We thank Dr. R. Saxton, Dr. S. Sembay, Dr. G. Griffiths, and Dr. I. Stewart for their comments and help on the XMM-Newton analysis software. M. S. acknowledges the financial support from JSPS.
REFERENCES
- (1)
- (2) Baganoff, F. K., Y. Maeda, M. Morris, et al., Chandra X-ray spectroscopic imaging of Sgr A* and the central parsec of the Galaxy, submitted to Astrophys. J., 2002.
- (3)
- (4) Carr, J. S., K. Sellgren, and S. C. Balachandran, The first stellar abundance measurements in the Galactic Center: the M supergiant IRS 7, Astrophys. J., 530, 307–322, 2000.
- (5)
- (6) Coil, A. L., and P. T. P. Ho, The dynamics of molecular material within 15 parsecs of the Galactic Center, Astrophys. J., 533, 245–259, 2000.
- (7)
- (8) Dogiel, V. A., V. Schönfelder, and A. W. Strong, Nonthermal hard X-ray emission from the Galactic Ridge, Astron. Astrophys., 382, 730–745, 2002.
- (9)
- (10) Goldwurm, A., E. Brion, P. Goldoni, et al., A new X-ray flare from the Galactic nucleus detected with the XMM-Newton photon imaging cameras, Astrophys. J., 584, 751–757, 2003.
- (11)
- (12) Genzel, R., C. Pichon, A. Eckart, et al., Stellar dynamics in the Galactic Centre: proper motions and anisotropy, Mon. Not. Roy. Astron. Soc., 317, 348–374, 2000.
- (13)
- (14) Ho, P. T. P., J. M. Jackson, A. H. Barrett, et al., Interactions between the continuum sources in the galactic center and their immediate molecular environment, Astrophys. J., 288, 575–579, 1985.
- (15)
- (16) Jones, T. W., Nature of the nonthermal radio emission from the galactic center, Astron. Astrophys., 30, 37–40, 1974.
- (17)
- (18) Koyama, K., Y. Maeda, T. Sonobe, et al., ASCA view of our Galactic Center, Publ. Astron. Soc. Japan, 48, 249–255, 1996.
- (19)
- (20) Maeda, Y., F. K. Baganoff, E. D. Feigelson, et al., A Chandra study of Sgr A East, Astrophys. J., 570, 671–687, 2002.
- (21)
- (22) Mayer-Hasselwander, H. A., D. L. Bertsch, B. L. Dingus, et al., High-energy gamma-ray emission from the Galactic Center, Astron. Astrophys., 335, 161–172, 1998.
- (23)
- (24) McWilliam, A., Abundance ratios and Galactic chemical evolution Ann. Rev. Astron. Astrophys., 35, 503–556, 1997.
- (25)
- (26) Mezger, P., V. Pankonin, J. Schmid-Burgk, et al., Radio determination of oxygen abundance variation in the galaxy, Astron. Astrophys., 80, L3–5, 1979.
- (27)
- (28) Mezger, P. G., R. Zylka, C. J. Salter, J. E. Wink, R. Chini, et al., Continuum observations of Sgr A at mm/submm wavelengths, Astron. Astrophys., 209, 337–348, 1989.
- (29)
- (30) Mezger, P., W. J. Duschl, and R. Zylka, The Galactic Center, Astron. Astrophys. Rev., 7, 289–388, 1996.
- (31)
- (32) Murakami, H., K. Koyama, and Y. Maeda, Chandra observations of diffuse X-rays from the Sagittarius B2 cloud, Astrophys. J., 558, 687–692, 2001.
- (33)
- (34) Ramírez, S. V., K. Sellgren, J. S. Carr, et al., Stellar iron abundances at the Galactic Center, Astrophys. J., 537, 205–220, 2000.
- (35)
- (36) Reid, M. J., The distance to the center of the Galaxy, Ann. Rev. Astron. Astrophys., 31, 345–372, 1993.
- (37)
- (38) Sakano, M., X-ray population of the Galactic Center region, PhD thesis, Kyoto Univ, 2000.
- (39)
- (40) Sakano, M., R. S. Warwick, A. Decourchelle, et al. The discovery of a new non-thermal X-ray filament near the Galactic Centre, Mon. Not. Roy. Astron. Soc., 340, 747–751, 2003.
- (41)
- (42) Tsuboi, M., T. Handa, and N. Ukita, Dense molecular clouds in the Galactic Center, Astrophys. J. Suppl., 120, 1–39, 1999.
- (43)
- (44) Yusef-Zadeh, F., F. Melia, and M. Wardle, The Galactic Center, Science, 287, 85–91, 2000.
- (45)
E-mail address of M. Sakano mas@star.le.ac.uk