7323
scilla@df.unipi.it
The Pisa Evolutionary Library
Abstract
We supplement recent evolutionary computations of canonical stellar models (i.e. with inefficient core overshooting) with Z=0.0002, 0.0004, 0.0006, 0.001, 0.004, 0.008 and suitable assumptions about the original He content. Evolutionary results have been compared with observational data in order to properly calibrate the efficiency of the surface convection. On this basis, we follow the evolution of stellar models in the mass range 0.6 to 11 M⊙ from the Main Sequence (MS) until C ignition or the onset of thermal pulses in the advanced Asymptotic Giant Branch (AGB) phase, presenting cluster isochrones covering the range of ages from 20 Myr to 20 Gyr. To allow a comparison with evolutionary investigations appeared in the recent literature, we computed additional sets of models which take into account moderate core overshooting during the H burning phase (for the metallicities suitable for stars in the Magellanic Clouds: Z=0.004, Z=0.008). Selected predictions constraining the cluster ages are discussed, presenting a calibration of the difference in magnitude between the luminous MS termination and the He burning giants in terms of the cluster age. Both evolutionary tracks and isochrones have been made available at the URL http://gipsy.cjb.net in the “Pisa Evolutionary Library” directory.
keywords:
stars: evolution – globular clusters : general – open clusters and associations : general – galaxies: Magellanic Clouds1 Model calibrations
There is the need for an extensive grid of stellar models with a range of suitable chemical compositions and ages to analyze the history of stellar populations in the Milky Way and in nearby galaxies. Recent theoretical computations all rely on the assumption of an efficient overshooting in the convective cores Yi et al. (2001); Girardi et al. (2000); Salasnich et al. (2000). The parallel availability of canonical evolutionary
results, employing the Schwarzschild criterion are needed.


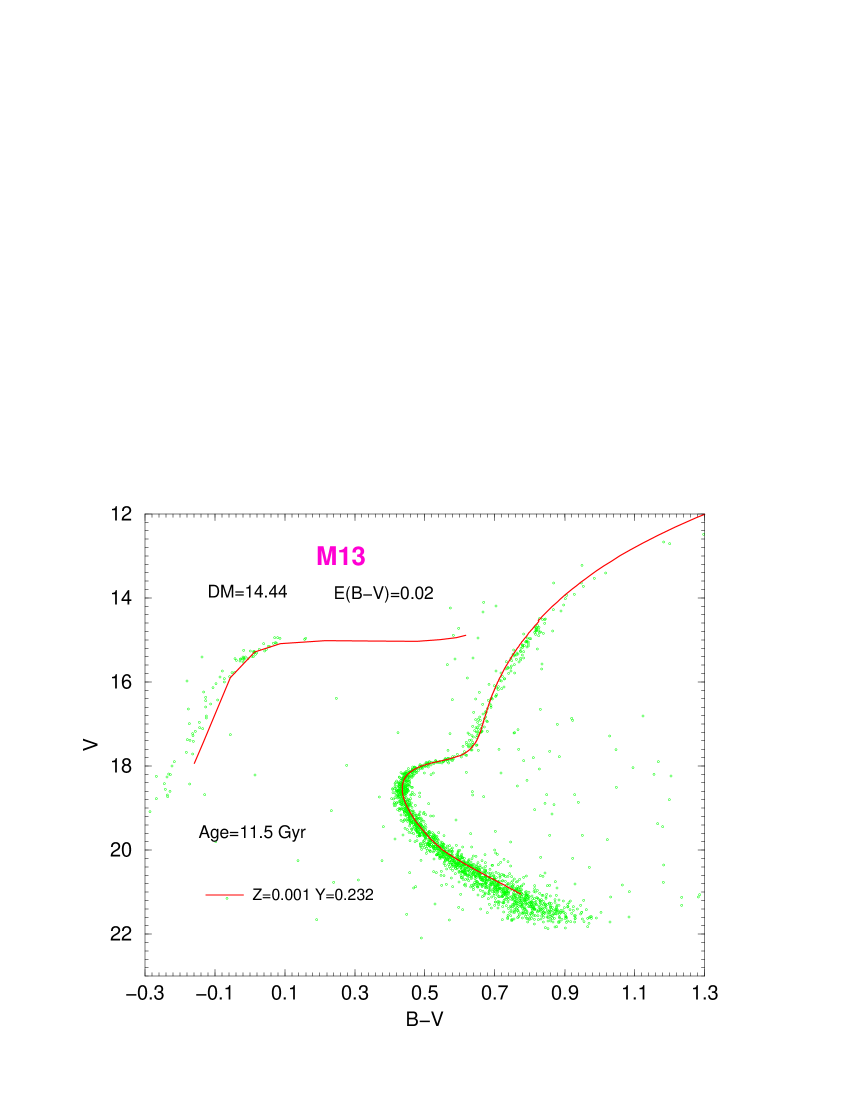
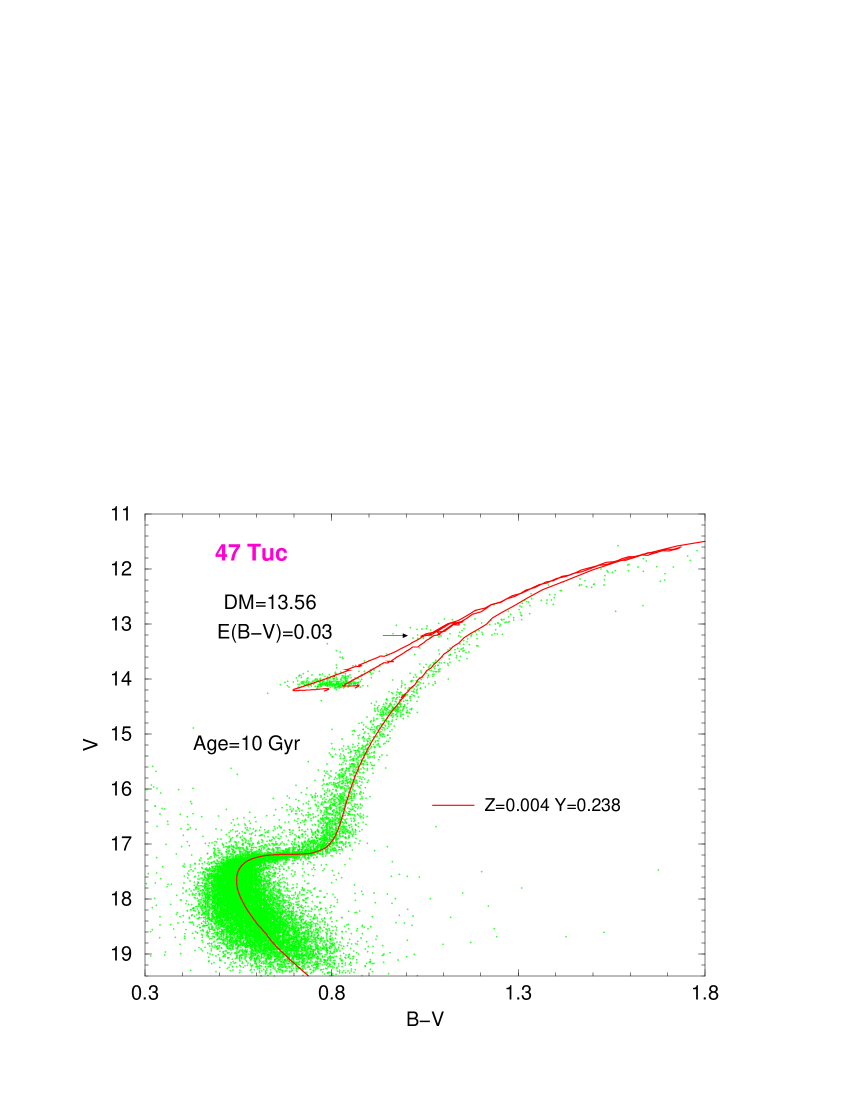
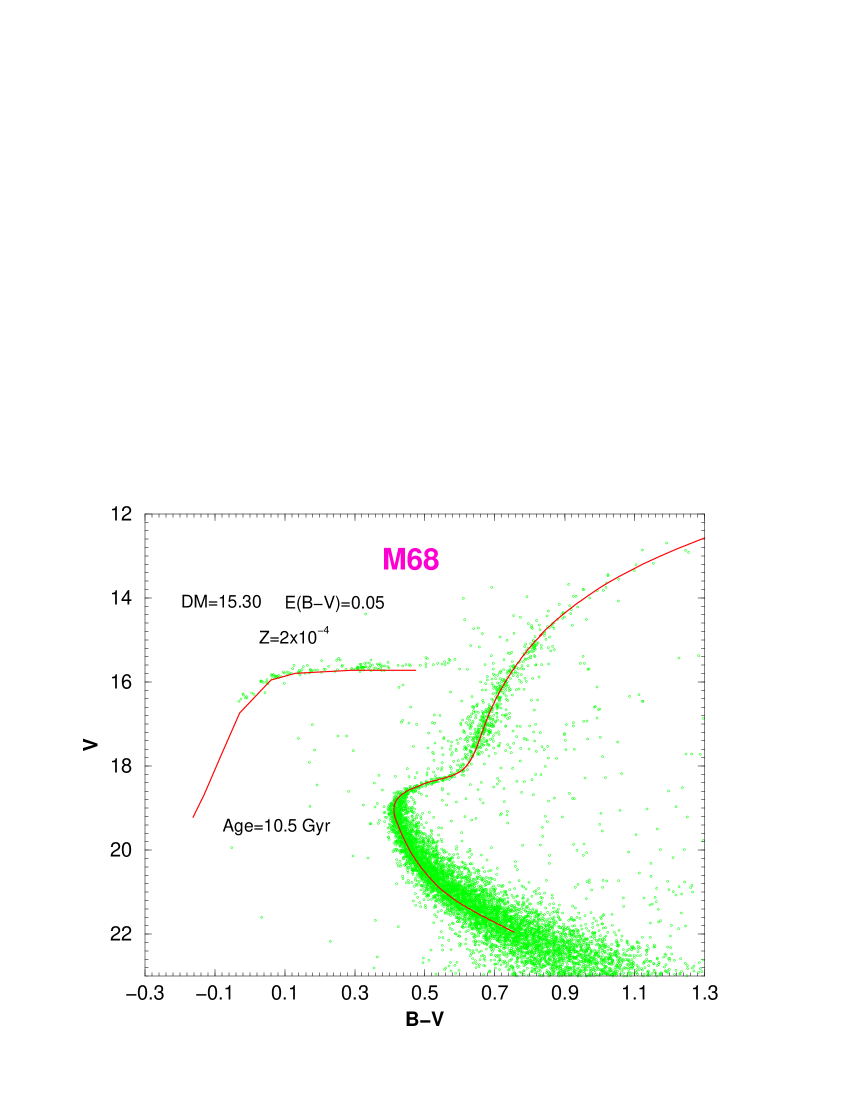
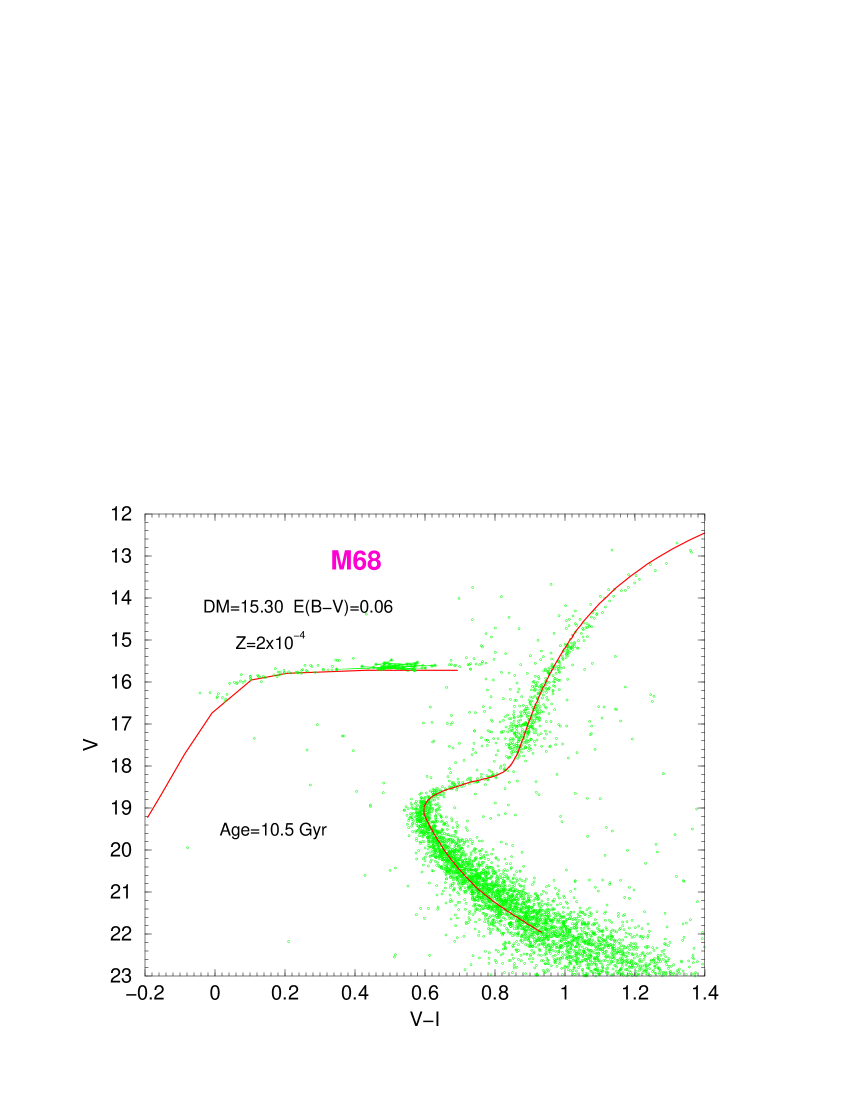
Our theoretical approach has been already satisfactorily tested vis-a-vis Solar Standard Models Degl’Innocenti et al. (1997) and young metal rich galactic clusters with Hipparcos parallaxes Castellani et al. (2001, 2002). Here we extended this procedure to lower metallicities. Original helium abundances have been obtained by assuming a primordial helium content Y=0.23 and Y/Z=2.5 Pagel & Portinari (1998). The efficiency of the superadiabatic convection at the upper envelope of stellar structures, specified by the mixing length parameter, has been calibrated against the observations. As an example, Figures 1 and 2 show the comparison of our isochrones with well observed, not too reddened, globular clusters with appropriate [Fe/H]. All the clusters appear well fitted, with distance moduli, reddenings and ages well within the range of values accepted in the recent literature Sarajedini & Da Costa (1991); Gratton et al. (1997); Rood et al. (1999); Carretta et al. (2000). Moreover Fig. 2 shows the encouraging evidence that the best fit obtained in the (V,B-V) plane also holds when passing to V-I, supporting the consistency of the adopted model atmospheres by Castelli, 1999. The physical inputs adopted in our code have been described in Castellani et al., 2003 (Paper I), Ciacio et al., 1997; Cassisi et al., 1998. In the present canonical models the convective boundaries are fixed by the Schwarzschild criterion; however we computed additional sets of models (Z=0.004 Y=0.238, Z=0.008 Y=0.25, see paper I) by allowing an efficient core overshooting in the H burning phase, as modelled according to Castellani et al., 2000 with , and values covering the range suggested in the recent literature Girardi et al. (2000). Comparisons with the Girardi et al., 2000 and Yi et al., 2001 models can be found in Paper I, in Cariulo et al., 2003 and in Castellani et al., 2000. Detailed tables for both tracks and isochrones are available at the URL http://gipsy.cjb.net in the “Pisa evolutionary library” directory including also all the adopted chemical compositions, tables with the distribution of Zero Age Horizontal Branch (ZAHB) models together with tables reporting the Horizontal Branch (HB) and AGB evolution of all these models. To allow a detailed comparison among different evolutionary computations, the web site contains files listing the evolution of structural characteristics of three selected models (M=0.9, 2.0 and 4.0 M⊙) for all chemical compositions.
2 An age indicator
Isochrone fitting is the best way for dating stellar clusters. However, the availability of more direct and simple “age indicators” has been proved to be useful. Since the pioneering paper by Iben, 1968, for old globulars, the so called “vertical method”, based on the difference between the Turn-Off and the helium burning HB phase has been widely used Stetson et al. (1996); Cassisi et al. (1998, 1999). A similar method can also be used for younger clusters, calibrating the difference in magnitude between the bright terminal MS (MT) and the clump of He burning giants evaluated, respectively, at the brightest magnitude reached just after the overall contraction (H exhaustion) phase and the minimum luminosity of the He clump region Salaris & Girardi (2002); Castellani et al. (1999); Udalski et al. (1998). We used our new isochrones to calibrate these parameters in terms of the cluster ages. The aim is to derive an easy-to-use observational parameter that is able to provide a correct order of magnitude for the age from the color-magnitude diagram of a cluster, independently of its distance. Figure 3 shows the run of MV as a function of the cluster age for the selected chemical compositions. As already known (see, e.g., Fig. 11 in Castellani et al., 1992) MV works as an univocal indicator only for ages larger than 700-800 Myr, whereas for lower ages there is some ambiguity. Data in the same figure shows the dependence of the calibration on the assumptions about overshooting and He content. In papers I and II one can find tables which give, for each value of the cluster age, the V magnitude of the MT and the difference in visual magnitude between HB and MT. For each age, the original mass of stars populating the He burning clump is also reported. Data in these tables can be useful in several ways. For example, by looking at the CM diagram of cluster NGC2420 Anthony-Twarog et al. (1990) from the observed difference in magnitude between the He-clump and the MS termination (M 1.5 mag) one finds for the cluster a (canonical) age of the order of 2 Gyr, in agreement with the results obtained through the fit of the CMD diagram Pols et al. (1998); Prada Moroni et al. (2001) but without the need for a complicate isochrone fitting procedure.
Acknowledgements.
We warmly thank Vittorio Castellani for his advice and Steve Shore for a careful reading of the manuscript.References
- Anthony-Twarog et al. (1990) Anthony-Twarog B.J., Twarog B.A., Kaluzny J., & Shara M.M. 1990, AJ 99, 1504
- Cariulo et al. (2003) Cariulo P.,Degl’Innocenti S., Castellani V., 2003, A&A submitted
- Carretta et al. (2000) Carretta E., Gratton R., Clementini G. & Fusi Pecci F. 2000, ApJ 533, 215
- Carretta & Gratton (1997) Carretta E., & Gratton R., 1997, A&AS 121, 95
- Cassisi et al. (1998) Cassisi S., Castellani V., Degl’Innocenti S., & Weiss A. 1998, A&AS 129, 267
- Cassisi et al. (1999) Cassisi S., Castellani V., Degl’Innocenti S., Salaris M., & Weiss A. 1999, A&AS 134, 103
- Castellani et al. (1992) Castellani V., Chieffi A., & Straniero O. 1992, ApJS 78,517
- Castellani et al. (2000) Castellani V., Degl’Innocenti S., Girardi L. et al. 2000, A&A, 354, 150
- Castellani et al. (1999) Castellani V., Degl’Innocenti S., & Marconi M. 1999, MNRAS 303, 265
- Castellani et al. (2003) Castellani V., Degl’Innocenti S., Marconi M., Prada Moroni P.G., Sestito P., 2003, A&A in publication (Paper I)
- Castellani et al. (2001) Castellani V., Degl’Innocenti S., & Prada Moroni P.G. 2001, MNRAS 320, 66
- Castellani et al. (2002) Castellani V., Degl’Innocenti S., Prada Moroni P.G., & Tordiglione V. 2002, MNRAS 334, 193
- Castelli (1999) Castelli F. 1999, A&A, 346, 564
- Ciacio et al. (1997) Ciacio F., Degl’Innocenti S., & Ricci B. 1997, A&AS 123, 449
- Degl’Innocenti et al. (1997) Degl’Innocenti S., Dziembowski W.A, Fiorentini G., & Ricci B. 1997, Astrop. Phys. 7, 77
- Girardi et al. (2000) Girardi L., Bressan A., Bertelli G., & Chiosi C. 2000, A&AS 141, 371
- Gratton et al. (1997) Gratton R. et al., 1997, ApJ 491, 749
- Iben (1968) Iben I.Jr. 1968, Nature, 220, 143
- Pagel & Portinari (1998) Pagel B.E.J., & Portinari L., 1998, MNRAS 298, 747
- Pols et al. (1998) Pols O.R., Schroeder K-P, Hurley J.R., Tout C.A., & Eggleton P.P. 1998, MNRAS 298, 525
- Prada Moroni et al. (2001) Prada Moroni P.G., Castellani V., Degl’Innocenti S., & Marconi M. 2001, Mem. SAIt 72, 407
- Rood et al. (1999) Rood, R. T., Carretta, E., Paltrinieri B. et al., 1999, ApJ 523,752
- Salaris & Girardi (2002) Salaris M, & Girardi L., 2002, MNRAS 337, 332 (2002)
- Salasnich et al. (2000) Salasnich B., Girardi L., Weiss A., & Chiosi C. 2000, A&A 361, 1023
- Sarajedini & Da Costa (1991) Sarajedini A. & Da Costa G.S., 1991, AJ 102, 628
- Stetson et al. (1996) Stetson P.B., VandenBerg D.A., & Bolte M., 1996, PASP 108, 560
- Udalski et al. (1998) Udalski A., Szymański M., Kubiak M. et al., 1998, Acta Astr. 48, 1
- Yi et al. (2001) Yi S., Demarque P., Kim Y-C. et al., 2001, ApJ 533, 670