Chandra Observations of Low Mass X-ray Binaries and Diffuse Gas in the Early-Type Galaxies NGC 4365 and NGC 4382 (M85)
Abstract
We used the Chandra X-ray Observatory ACIS S3 to image the X-ray faint elliptical galaxy NGC 4365 and lenticular galaxy NGC 4382. The observations resolve much of the X-ray emission into 99 and 58 sources, respectively, most of which are low-mass X-ray binaries (LMXBs) associated with each of the galaxies. Within one effective radius of NGC 4365, about 45% of the counts are resolved into sources, 30% are attributed to unresolved LMXBs, and 25% are attributed to diffuse gas. Within two effective radii of NGC 4382, about 22% of the counts are resolved into sources, 33% are attributed to unresolved LMXBs, and 45% are attributed to diffuse gas. We identify 18 out of the 37 X-ray sources in a central field in NGC 4365 with globular clusters. The luminosity functions of the resolved sources for both galaxies are best fit with cutoff power-laws whose cutoff luminosity is ergs s-1. These luminosities are much larger than those previously measured for similar galaxies; we do not find evidence for a break in the luminosity function at the Eddington luminosity of a 1.4 neutron star. The spatial distributions of the resolved sources for both galaxies are broader than the distribution of optical stars. In both galaxies, a hard power-law model fits the summed spectrum of all of the sources. The unresolved emission is best fit by the sum of a soft mekal model representing emission from diffuse gas, and a hard power-law, presumed to be from unresolved LMXBs. There is some evidence that the temperature of the diffuse gas increases with increasing radius. A standard beta model fits the radial distribution of the diffuse gas in both galaxies. In the elliptical NGC 4365, the best-fit core radius is very small, while the S0 galaxy NGC 4382 has a larger core radius. This may indicate that the gas in NGC 4382 is rotating significantly.
1 Introduction
Early-type galaxies are luminous X-ray sources (Forman, Jones, & Tucker 1985). For galaxies of a given optical luminosity, the X-ray-to-optical luminosity ratio () ranges over two orders of magnitude for galaxies (Canizares, Fabbiano, & Trinchieri 1987; White & Davis 1997). We will refer to galaxies with relatively high ratios as “X-ray bright” and to galaxies with relatively low ratios as “X-ray faint.” Hot ( keV) interstellar gas dominates the X-ray emission in X-ray bright galaxies (e.g., Forman et al. 1985; Trinchieri, Fabbiano, & Canizares 1986); whereas X-ray faint galaxies exhibit two distinct spectral components: a hard (5–10 keV) component (Matsumoto et al. 1997) and a very soft ( 0.2 keV) component (Fabbiano, Kim, & Trinchieri 1994; Pellegrini 1994; Kim et al. 1996). Since the hard component is actually found in both X-ray bright and X-ray faint early-type galaxies, with strengths roughly proportional to the optical luminosity of the galaxy, Kim et al. (1992) suggested that the hard component is due to low-mass X-ray binaries (LMXBs) like those observed in the Milky Way’s bulge.
Chandra observations of the X-ray faint elliptical, NGC 4697 (Sarazin, Irwin, & Bregman 2000, 2001), resolved the majority of emission into X-ray point sources, whose properties are consistent with LMXBs. Chandra observations show that a significant fraction of the LMXBs are coincident with globular clusters (Sarazin et al. 2000; Angelini et al. 2001). Taken together, the X-ray spectra of LMXBs in early-type galaxies are hard, and can be fit by thermal bremsstrahlung with a temperature of keV. However, there is a considerable variety in observed X-ray spectra and colors of individual sources. Some of the LMXBs have very soft X-ray spectra, similar to those of Galactic supersoft sources (Sarazin et al. 2000). The luminosity function of LMXBs in early-type galaxies in the luminosity range erg s-1 appears to generally be fit by a broken power-law (Sarazin et al. 2000, 2001), with a break luminosity which is comparable to the Eddington luminosity for spherical accretion onto a 1.4 neutron star. This suggests that the sources more luminosity than erg s-1 are accreting black holes.
In addition to the LMXBs, the Chandra observations of NGC 4697 also detected diffuse emission from interstellar gas. The gas is quite cool, with temperatures keV (Sarazin et al. 2000, 2001).
With Chandra’s ability to study both the LMXB population and diffuse X-ray emission of early-type galaxies, it is useful to extend such studies to other early-type galaxies. Since diffuse emission could dominate the LMXBs in X-ray bright galaxies, the ideal targets for studying the LMXB population of early-type galaxies are X-ray faint galaxies. In this paper, we present the results of two such observations. Both NGC 4365 and NGC 4382 are early-type galaxies located in the Virgo cluster. NGC 4365 is an E3 galaxy. NGC 4382 (M85) is a S0 galaxy with an interacting companion NGC 4394, which together with several other nearby galaxies (VCC 797, IC 3292) form a galaxy group RSCG 54 (Barton et al. 1996). Since NGC 4382 has somewhat bluer colors than are typical for a S0, and its disk shows a spiral pattern, it is sometimes classified as an Sa. It was the host of the Type Ia supernova SN1960r (e.g., Porter 1993). The distances to these galaxies are 20.4 Mpc (NGC 4365) and 18.5 Mpc (NGC 4382), based on the method of surface brightness fluctuations (Tonry et al. 2001). For comparison, NGC 4697 has a distance of 11.7 Mpc using the same technique. All three galaxies have similar X-ray luminosities and ratios (O’Sullivan, Forbes, & Ponman 2001).
In § 2, we discuss the observations and data reduction of these galaxies. The X-ray images are presented in § 3. The properties of resolved sources are given and discussed in § 4. We discuss the X-ray spectral properties in § 5. The spatial distribution of the diffuse X-ray emitting gas is determined in § 6. We summarize our conclusions in § 7.
2 Observation and Data Reduction
NGC 4365 was observed on 2001 June 2–3 with a live exposure of 40,429 s, while NGC 4382 was observed on 2001 May 29–30 for 39,749 s. Both galaxies were observed with the ACIS-235678 chips operated at a temperature of 120 C and with a frame time of 3.2 s. We determined the pointings so that the entire galaxy was located on the S3 chip and so that the center of each galaxy was not on a node boundary of the chip. Although a number of serendipitous sources were seen on the other chips, the analysis of both galaxies in this paper will be based on data from the S3 chip alone. The data were telemetered in Faint mode, and only events with ASCA grades of 0,2,3,4, and 6 were included. Photon energies were determined using the gain file acisD2000-08-12gainN0003.fits. We excluded bad pixels, bad columns, and columns adjacent to bad columns or chip node boundaries.
Chandra is known to encounter periods of high background (“background flares”), which especially affect the backside-illuminated S1 and S3 chips111See http://cxc.harvard.edu/contrib/maxim/acisbg/.. We determined the background count rate for each galaxy, using the S1 chip to avoid the enhanced flux due to the galaxy on the S3 chip. For both NGC 4365 and NGC 4382, no background flares were seen. The backgrounds for extended regions were taken from the deep blank sky backgrounds compiled by Maxim Markevitch33footnotemark: 3, and were adjusted to the aspect histories of our observations using his make_acisbg program33footnotemark: 3 The normalization of the background was increased very slightly to match the 5–10 keV count rate of the blank-sky background with a galaxy emission-free region of each galaxy on the S3 chip. We included the “background” due to the readout artifact in ACIS using his make_readout_bg program33footnotemark: 3.
On the S3 image of NGC 4365, there were two X-ray sources with positions that agreed with positions from the U.S. Naval Observatory A2.0 (USNOA2 Monet et al. 1998) or the Two Micron All Sky Survey (2MASS Cutri et al. 2001) catalogs. Src. 98 in Table 1, an X-ray source near the edge of the field where the Chandra point-spread-function (PSF) is quite broad and the X-ray position is uncertain, corresponded to USNOA2 0900-07143676. For this source, the optical and X-ray positions agree to within 04. The second possible optical identification is between the optical nucleus of NGC 4365 itself and Src. 1 in Table 1. Unfortunately, the central region of this galaxy is crowded with sources, and it is uncertain whether the source closest to the nucleus is, in fact, an active galactic nucleus (AGN), a nearly coincident X-ray binary, or a combination of sources. Confusion limits the accuracy with which the positions of sources near the center of NGC 4365 can be determined. In the absence of more direct evidence, we will assume that the positions in NGC 4365 are accurate to 1″. In NGC 4382, there were two X-ray sources with optical identifications and positions from the Tycho-2 catalog (Høg et al. 2000), the 2MASS catalog, and/or the USNOA2 optical catalog. The first source, Src. 38 in Table 2, corresponds to J1225+182, a quasar (Knezek & Bregman 1998) and is the brightest X-ray source in the S3 field. The second source, which was just below the detection threshold for inclusion in Table 2, corresponds to BD+18 2609, a G5 star with a proper motion of 90 mas yr-1 (Høg et al. 1998). The X-ray positions agreed with the optical positions to better than 04 in both cases with no evidence for a systematic offset. We believe that the X-ray positions for NGC 4382 are generally accurate to 05.
We performed initial data reduction and some of the data analysis using the Chandra analysis package ciao222See http://asc.harvard.edu/ciao/.. We extracted spectra using the calcrmf333See http://asc.harvard.edu/cont-soft/software/. software kindly provided by Alexey Vikhlinin and Jonathon McDowell. The spectra were fit using xspec444See http://heasarc.gsfc.nasa.gov/docs/software/lheasoft/.. Since launch, the ACIS quantum efficiency (QE) has undergone continuous degradation555See http://cxc.harvard.edu/cal/Acis/Cal_prods/qeDeg/.. We used the xspec acisabs model to correct X-ray spectra for this effect.
3 X-ray Image
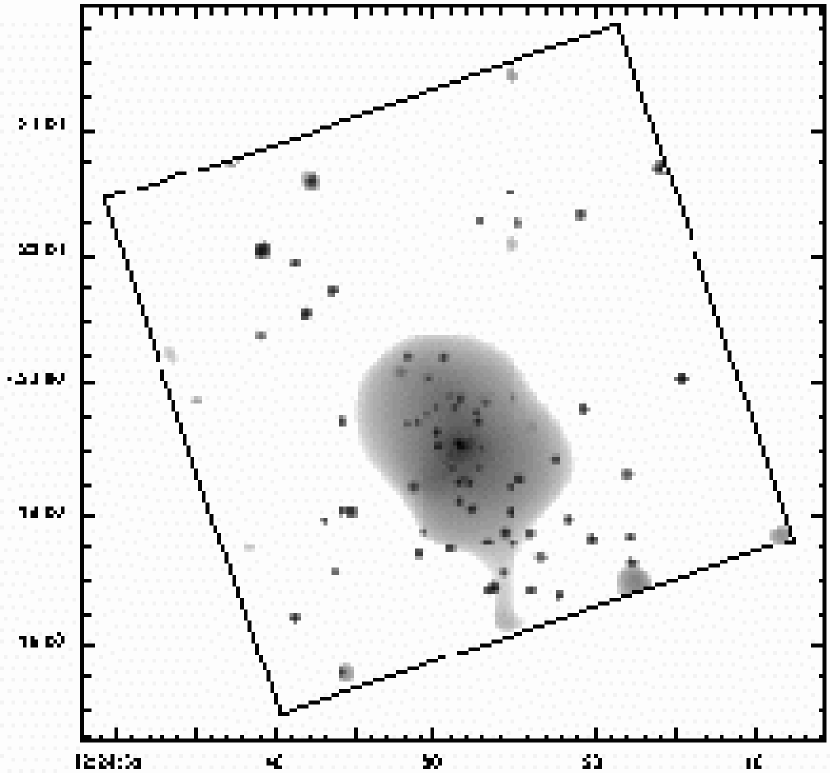
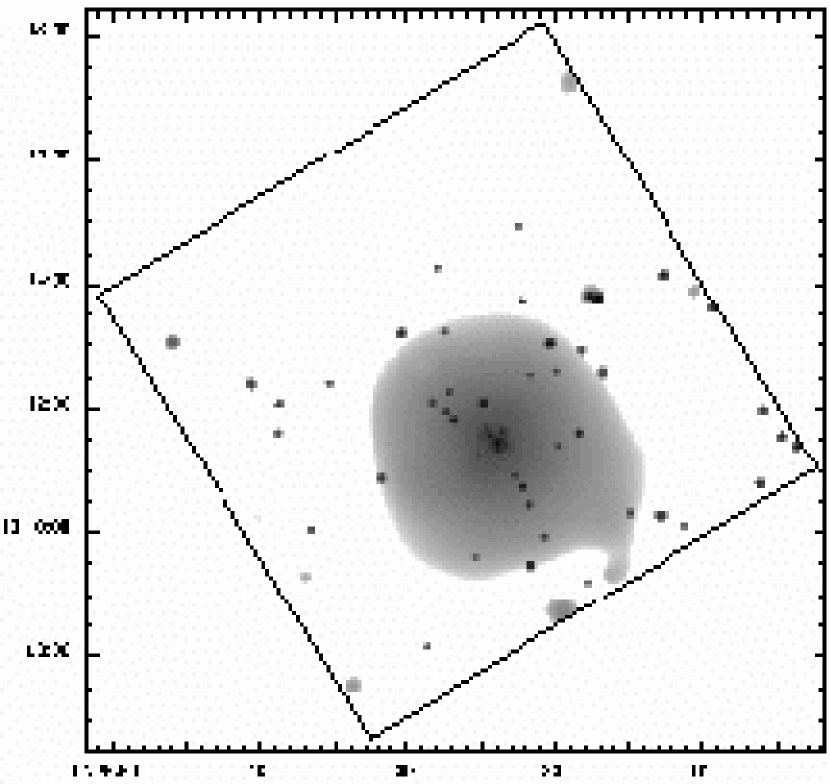
The X-ray images of NGC 4365 and NGC 4382 show both resolved point sources and diffuse emission. To best image this combination, we adaptively smoothed the Chandra S3 image using a minimum signal-to-noise ratio (SNR) per smoothing beam of 3. After correcting for exposure and background, we removed regions of less than 20 ks to avoid artifacts at the chip’s edge. Figure 1 displays gray scale images with a logarithmic surface brightness scale ranging between cnt pix-1 s-1 and cnt pix-1 s-1. In both galaxies, the majority of the X-ray luminosity emission has been resolved into point sources.
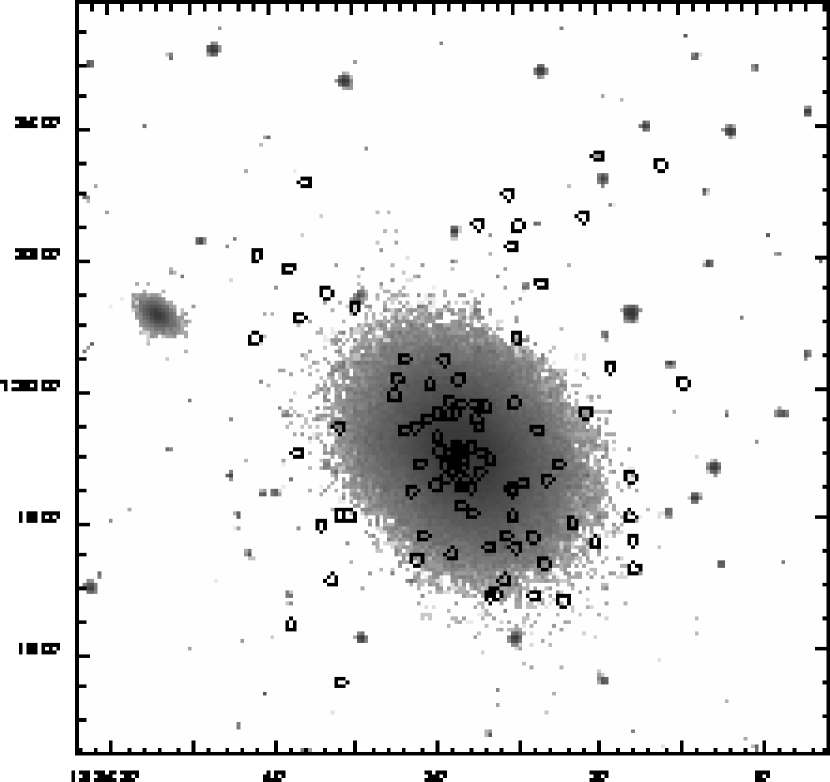
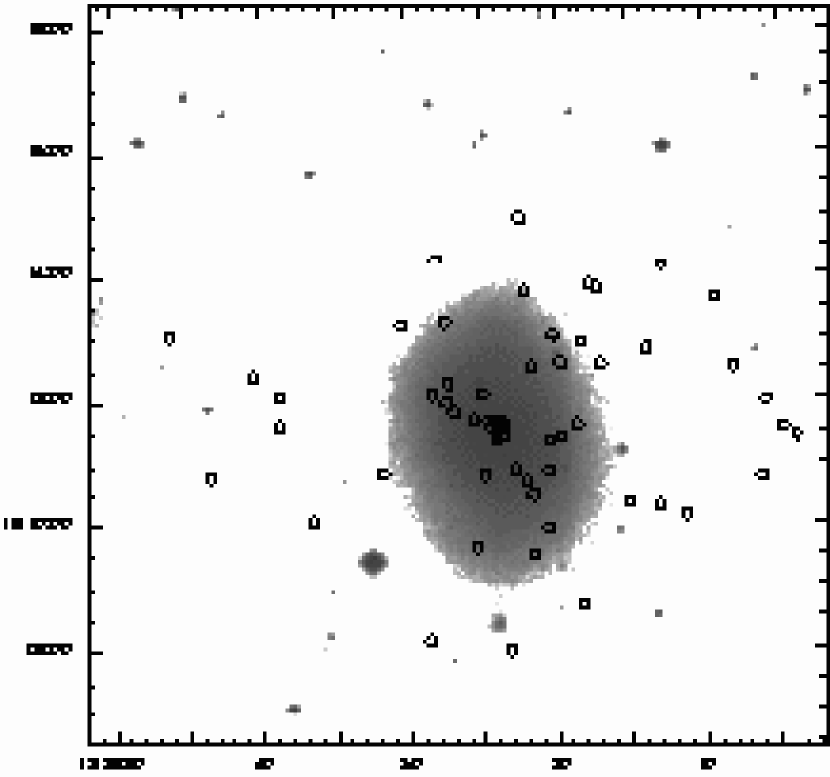
In Figure 2, we show the Digital Sky Survey (DSS) optical images centered on NGC 4365 and NGC 4382 using a logarithmic gray scale. The overlaid circles indicate the positions of the X-ray point sources listed in Tables 1 and 2. Only a small fraction of the weaker point sources are not evident in Figure 1. In NGC 4365, the diffuse emission qualitatively has the same ellipticity and position angle (PA) as the optical emission. On the other hand, the X-ray emission in NGC 4382 appears rounder than the optical emission.
4 Resolved Sources
4.1 Detections
The discrete X-ray source populations on the ACIS S3 images of the two galaxies were determined using using the wavelet detection algorithm (ciao wavdetect55footnotemark: 5 program), and were confirmed with a local cell detection method and by visual inspection. The wavelet source detection threshold was set at , which implies that 1 false source (due to a statistical fluctuation in the background) would be detected in the entire S3 image. We further restricted the sources by requiring sufficient source counts to determine the source flux at the level. Over most of the image, the minimum detectable flux was about cnt s-1 in the 0.3–10 keV band for both galaxies. The detection limit is slightly higher at large distances where the Point-Spread-Function (PSF) is larger, and near the center of the galaxy where confusion with other discrete sources or diffuse gaseous emission may affect the sensitivity. For all source analyses, we used a local background with an area three times that of each source’s region from wavdetect. There were a few cases of nearby sources where the source regions or background regions were altered slightly to avoid overlaps, without affecting the net count rates.
Tables 1 and 2 list the discrete sources detected by this technique in NGC 4365 and NGC 4382, respectively. In each case, the sources are ordered with increasing projected distance from the center of the galaxy. Columns 1-7 provide the source number, the IAU name, the source position (J2000), the projected distance from the center of each galaxy, the count rate with its error, and the SNR for the count rate. The fluxes were corrected for exposure and the instrument PSF. Since we did not detect a distinct source which was unambiguously associated with an AGN at the center of either NGC 4365 or NGC 4382 (see § 4.2), we adopted the central optical/IR positions of R.A. = 12h24m2826 and Dec. = +7°19′38 for NGC 4365, and R.A. = 12h25m2404 and Dec. = +18°11′259 for NGC 4382 from the 2MASS survey (Cutri et al. 2001). As noted in § 2, the overall absolute errors are probably 1″ for NGC 4365 and 05 for NGC 4382 near the centers of the fields, with larger errors further out for both observations.
Our detection limit for sources should result in 1 false source (due to a statistical fluctuation) in the entire S3 field of view for each galaxy. However, some of the detected sources may be unrelated foreground or (more likely) background objects. Based on the source counts in Brandt et al. (2000) and Mushotzky et al. (2000), we would expect 12 such unrelated sources in each observation. These should be spread out fairly uniformly over each S3 image (Figure 1), except for the reduced sensitivity at the outer edges of the field due to reduced exposure and increased PSF. Thus, the unrelated sources should mainly be found at larger distances from the optical centers of the galaxies (the latter entries of Tables 1 & 2), while the sources associated with the galaxies should be concentrated to their centers.
4.2 Identifications
In addition to the identifications mentioned in § 2, we visually examined the first and second generation DSS images for position matches. Both Src. 98 (USNOA2 0900-07143676) of NGC 4365, and Src. 38 (J1225+182) of NGC 4382 were visible. In addition, Srcs. 88 and 97 of NGC 4365 and Srcs. 48, 53, and 57 of NGC 4382 had possible optical counterparts. None of these five sources corresponded to objects listed in NED or SIMBAD.
In both galaxies, the area enclosed by Src. 1 is coincident with our adopted optical/IR positions of the galaxy center. In NGC 4365, the centroid of Src. 1 is off by an amount which is consistent with our positional uncertainty, while in NGC 4382, the centroid is off by times our positional uncertainty. It is unclear whether either of these sources is an AGN in the galaxy center or a LMXB projected near the center. We also examined hard-band (2–10 keV) images of both galaxies in which AGNs might be more obvious, particularly as the diffuse emission from the galaxies is soft. We did not see any new sources near the center, nor were either of the centermost sources particularly hard. Thus, we have no unambiguous evidence for AGNs in these galaxies. Conservatively, we adopt the luminosity of the centermost source in each galaxy ( ergs s-1 in NGC 4365 and ergs s-1 in NGC 4382) as the upper limit to the central AGN luminosity.
We examined NGC 4382 for a source associated with SN1960r. Src. 27 is the closest detected source; however, it is 20″from the Porter (1993) position. We placed a 2.0″radius circular aperture, similar to that of Src. 27 plus 0.5″to account for our positional uncertainty, and a 4.0″radius circular aperture to determine the local background. No net counts were detected and we can place a upper limit of ergs s-1.
For NGC 4365, A. Kundu kindly provided a list of 325 globular cluster positions from data presented in Kundu & Whitmore (2001). The WFPC2 field of view overlaps 37 X-ray point sources from Table 1. After solving for a small offset, 18 of the 37 sources have a globular cluster within 102. The expected number of associations from random positions is based on the density of the globular clusters. This number is consistent with Kundu et al. (2003), who adopted a less strict source detection criteria. Recently Larsen et al. (2003) published a short list of globular clusters with spectroscopy. In addition to globular clusters identifications from Kundu & Whitmore (2001), Larsen et al. (2003) globular cluster #1 agrees with the position of our Src. 59. Sources with candidate globular clusters are noted in Table 1. There were no available lists of globular clusters for NGC 4382.
4.3 X-ray Luminosities and Luminosity Functions
When converting the source count rates into unabsorbed X-ray (0.3–10 keV) luminosities, we assumed that each source was at the distance of the target galaxy. We then used the best-fit Chandra X-ray spectrum of the inner (one effective radius for NGC 4365, two effective radii for NGC 4382) resolved sources (Tables 3 and 4, row 3). The conversion factors were ergs cnt-1 for NGC 4365 and ergs cnt-1 for NGC 4382. Column 8 of Tables 1 and 2 list the X-ray luminosities in units of ergs s-1, and range roughly from to ergs s-1 for NGC 4365 and to ergs s-1 for NGC 4382.
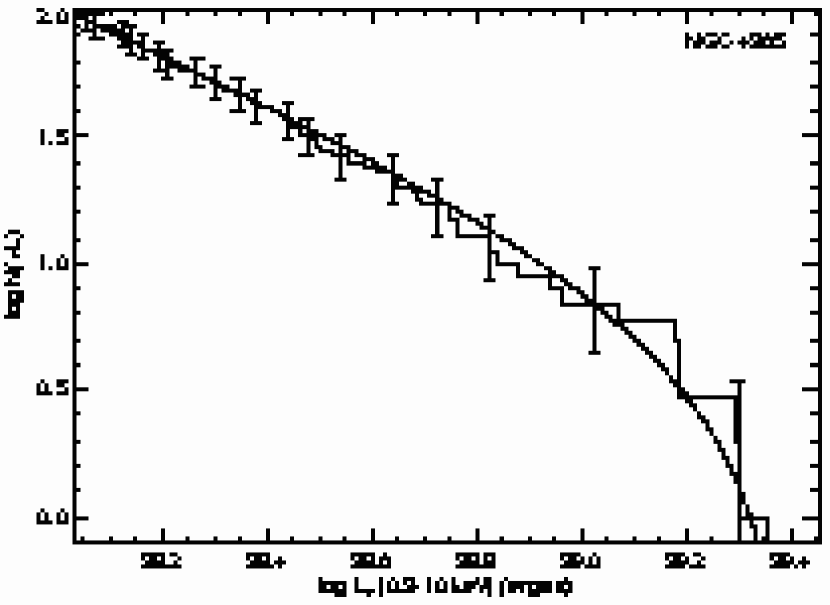
In Figure 3, we display the cumulative luminosity functions of all resolved sources in the S3 field. Each cumulative luminosity function should be the sum of the point source (LMXB) population of the target galaxy and the foreground/background population. We fit the luminosity function using the same techniques as we have used previously (Sarazin et al. 2000, 2001; Blanton, Sarazin, & Irwin 2001; Irwin, Sarazin, & Bregman 2002); a single power-law, broken power-law, and a cutoff power-law were all used to model the LMXB population. The background source population was modeled as discussed in the previous references. For NGC 4365, a single power-law fit was acceptable (at 54% confidence level). However, the single power-law fit for NGC 4382 was rejected at the greater than 94% confidence level. Attempts at broken power-law fits were more successful [ and , with two less degrees of freedom (dof) compared to the single power-law]; however, the power-law exponents at high luminosities were steep (9), so that these models effectively had a cutoff above the break luminosity. As a result, we fit the luminosity functions with a cutoff power-law model ( and , with one less dof compared to the single power-law):
| (1) |
where is the X-ray luminosity, erg s, and is the cutoff luminosity. The best fits were determined by the maximum likelihood method, and the errors (90% confidence interval) were determined by Monte Carlo techniques. For NGC 4365, , , and ergs s-1; while for NGC 4382, , , and ergs s-1.
At the faint end of the luminosity function, incompleteness may play a role. Since the incompleteness is a complicated function of source counts, spectra, background, the point spread function, and the detection band, we used simulations to understand the incompleteness. With marx666See http://space.mit.edu/CXC/MARX/. simulations, we found that incompleteness can lead to a depressed luminosity function for luminosities higher than the minimum detectable luminosity in these galaxies. In our cases, that corresponds to ergs s-1 (14 counts) for both galaxies. This is in rough agreement with other reported simulations (Kim & Fabbiano 2003). The largest effect of incompleteness for our fits would be in their power-law slopes. When we fit the luminosity function at a minimum of ergs s-1, we find agreement within the errors reported above.
The X-ray luminosity functions of LMXBs have been determined with Chandra in a number of other early-type galaxies. In most cases, the observations are limited to ergs s-1. The best-fit slope of NGC 4365 is steeper than the low luminosity slope in NGC 1553 (Blanton et al. 2001), NGC 4649 (Randall et al. 2003), and NGC 4697 (Sarazin et al. 2001), although the values for NGC 4365, NGC 4649, and NGC 4697 agree within the 90% confidence intervals. The slope in NGC 4365 is also flatter than the high luminosity slope in these three galaxies, and the single power-law slope in NGC 1316 (Kim & Fabbiano 2003). The 90% confidence intervals of NGC 4382 overlap with in NGC 1553, NGC 4649, and NGC 4697.
The cutoff luminosities of NGC 4365 and NGC 4382 ( 0.9-3.2 ergs s-1) are much higher than the break or cutoff luminosities of NGC 1291, NGC 1553, NGC 4649, and NGC 4697 ( 2-6 ergs s-1) (Sarazin et al. 2001; Blanton et al. 2001; Irwin et al. 2002; Randall et al. 2003). The differences probably are too large to be explained by distance errors. When we fit the luminosity functions in NGC 4365 and NGC 4382 with broken power-laws, the break values were somewhat lower than the cutoff luminosities but consistent within the errors. Moreover, the break luminosities were significantly larger than the values found in NGC 1291, NGC 1553, and NGC 4697. A very high break luminosity or single power-law fit was found previously for NGC 1316 (Kim & Fabbiano 2003); this galaxy had a single power-law fit, but a break at ergs s-1 could not be excluded.
In Sarazin et al. (2000), we argued that a break luminosity similar to the Eddington luminosity of a spherically accreting neutron star indicated that the LMXBs above the break contain accreting black holes. The large luminosities of the cutoff or broken power-laws for NGC 1316, NGC 4365, and NGC 4382 seem less consistent with this interpretation, barring a large error in the distance.
In the luminosity function of NGC 4382, the best-fit clearly misses the brightest source, Src. 38. Since Src. 38 is a bright background AGN, this is not indicative of a poor fit.
4.4 Hardness Ratios
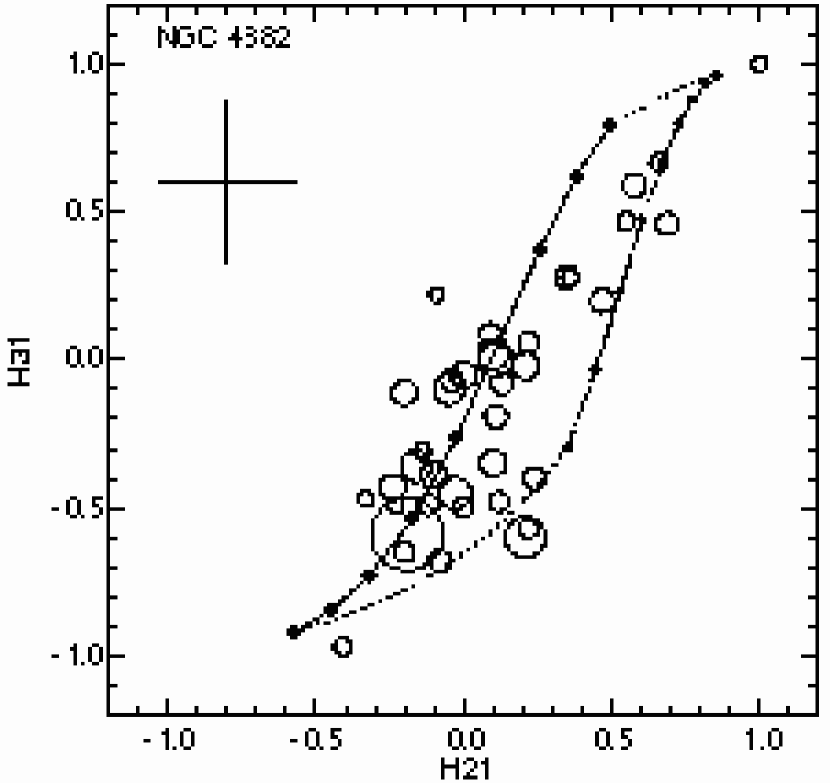
We determined X-ray hardness ratios for the sources, using the same techniques and definitions we used previously (Sarazin et al. 2000, 2001; Blanton et al. 2001; Irwin et al. 2002). Hardness ratios or X-ray colors are useful for crudely characterizing the spectral properties of sources, and can be applied to sources that are too faint for detailed spectral analysis. We define two hardness ratios as H21 and H31 , where , , and are the total counts in the soft (0.3–1 keV), medium (1–2 keV), and hard (2–10 keV) bands, respectively. Since the hardness ratios measure observed counts, Galactic absorption, as well as QE degradation, must be taken into account when interpreting the ratios. The hardness ratios and their errors are listed in columns 9 and 10 of Tables 1 and 2. Figure 4 plots H31 vs. H21 for the 48 and 39 sources of NGC 4365 and NGC 4382, respectively, with at least 20 net counts. The hardness ratio for the sum of those sources are (H21,H31) for NGC 4365 and for NGC 4382. Sources with 40 net counts had errors similar to the median of the uncertainties, . The errors scale roughly with the inverse square root of the net counts.
As was also seen in the bulge of NGC 1291, NGC 1553, and NGC 4697 (Sarazin et al. 2000, 2001; Blanton et al. 2001; Irwin et al. 2002), most of the sources lie along a broad diagonal swath extending roughly from (H21,H31) to (0.4,0.5). In Figure 4, the solid line corresponds to Galactic absorption, QE degradation, and power-law spectra with photon indices of to 3.2. Most of the sources (37/48 and 26/39) are displaced to the right of the solid curve. Were the solid curve a good fit to the data, one would expect to find roughly equal numbers of sources on each side of the curve. Assuming that this is the case, the probability of seeing 9/48 and 13/39 sources to the left of the line is 0.01% and 2.66% for NGC 4365 and NGC 4382, respectively. The spectra seem to be more complex than a single power-law with varying indices.
Between NGC 4697 and the bulge of NGC 1291, there were four sources with (H21,H31) . These supersoft sources have, essentially, no emission above 1 keV. Based on scaling to the 3 sources in NGC 4697, one might have expected 5–6 supersoft sources in NGC 4365 and 3 supersoft sources in NGC 4382. However, no supersoft sources are observed in either galaxy.
In Figure 4, there are three NGC 4365 sources (Srcs. 36, 69, and 92) and four NGC 4365 sources with very hard spectra (hardness ratios [H21,H31] ). These may be unrelated, strongly absorbed AGNs, similar to the sources which produce the hard component of the X-ray background, and which appear strongly at the faint fluxes in the deep Chandra observations of blank fields (Brandt et al. 2000; Mushotzky et al. 2000; Giacconi et al. 2001). There also are two sources with hardnesses ratios of around ; these are Src. 38 of NGC 4365 and Src. 10 of NGC 4382; although the hardness ratio of the latter is highly uncertain. Studies of other galaxies (Sarazin et al. 2001) and deep blank sky images (e.g., Giacconi et al. 2001) suggest that many of sources, similarly lacking hard emission, may be unrelated background sources. However, such sources, especially when at smaller radii, may be part of the host galaxy. Although the identification of Src. 38 of NGC 4382 with a quasar marks it as a background object, it occupies a typical part of the figure ([H21,H31] ).
4.5 Variability
We searched for variability in the X-ray emission of the resolved sources over the duration of the Chandra observation using the Kolmogoroff-Smirnov (KS) test (see Sarazin et al. 2001). In most cases, the tests were inconclusive. For NGC 4365, six sources (Srcs. 16, 21, 29, 31, 48, and 86) had a % probability that they were variable. For NGC 4382, only Src. 54 had a % probability that it was variable. Figure 5 displays the total count histograms of the three sources in NGC 4365 (Srcs. 16, 29, and 86) that had a % probability that they were variable and NGC 4382 Src. 54 which had a % probability that it was variable. NGC 4365 Src. 16 seems to be gradually fading. Similarly, NGC 4365 Src. 29 also seems to fade gradually, but has only 15 net counts. The X-ray light curve for NGC 4365 Src. 86 is shown in Figure 6. This source appears to have turned on after the start of the observation, and undergone a large outburst after about 1/3 of NGC 4365’s exposure. It then decreased, and probably underwent at least one more outburst before gradually fading as the observation was ending. The light curve of NGC 4382 Src. 54 suggests that it underwent an outburst after about 3/8 of NGC 4382’s exposure, and that the outburst gradually faded. Variable sources are noted in Tables 1 and 2.
4.6 Spatial Distribution
As in Sarazin et al. (2001), we have performed two comparisons of the spatial distribution of the X-ray sources with that of the optical light; we have fit the position angle (PA) distribution and the radial distribution. For both galaxies, we limited the analysis to all sources within 3 of the galaxy center to ensure that the circular area lies completely on the chip. In this area, we expect 5 background sources in each exposure. We have adopted the Third Reference Catalogue of Bright Galaxies (RC3) values for the optical photometry’s effective radii, position angle, and ellipticity (de Vaucouleurs et al. 1992). At an effective radius of , NGC 4365 has PA = 40 and ; while at an effective radius of , NGC 4382 has . There is no PA listed for NGC 4382 in RC3. Fisher (1997) found that NGC 4382 has an isophotal twist, with its PA ranging from 60 at its center to 0 at large radii. We adopted that latter PA for NGC 4382. These elliptical isophotes contain one-half of the optical light.
In Figure 7, we show the observed distributions of PAs (modulo 180°, measuring PA from north to east). In addition to the observed distribution and the expected optical distribution, we have fit a distribution representing the number of expected background sources plus the number of sources expected from a set of sources with constant projected density on elliptical isophotes. For NGC 4365 and NGC 4382, between the optical fits and the maximum likelihood fits indicate that the optical fits are acceptable at the 83% and 54% confidence level. The best-fit distribution of NGC 4365 gives PA = 32° and , while the best-fit distribution for NGC 4382 has PA = 39° and . The PA value of NGC 4382 lies within the range of angles Fisher (1997) reports.
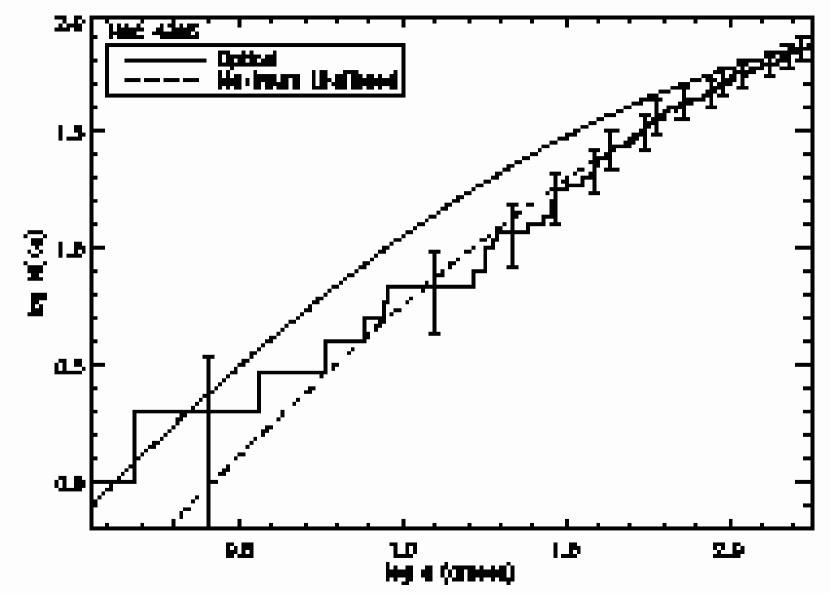
Adopting the optically determined values for ellipticity and PA, we show the accumulated source number as a function of semi-major axis, , in Figure 8. The use of elliptical isophotes reduces the number of background sources modeled in each galaxy by . We modeled the galactic LMXB distribution using a de Vaucouleurs profile, and included a uniform distribution of background sources at the level expected from deep Chandra observations. If we fix the effective semi-major axis of the LMXB distribution at the value determined by the optical light distribution in NGC 4365, , the KS test indicates that the optical distribution is rejected at the % confidence level. The best-fit de Vaucouleurs model has an effective semi-major axis of 136″. Similarly, the KS test for NGC 4382 rejects the optical distribution at the 85% confidence level. The best-fit de Vaucouleurs profile for the LMXBs has an effective radius of 129″. Both fits indicate that there are more X-ray sources at larger radii than expected from the optical light distribution. Radial fits from circular isophotes yield similar results. Since NGC 4382 is an S0 galaxy, this disagreement may reflect the contribution of X-ray sources associated with the disk of the galaxy. However, this would not explain the difference between the LMXB distribution and the optical light distribution in NGC 4365.
We note that a significant fraction of the LMXBs in NGC 4365 are associated with globular clusters (§ 4.2), as is generally true of elliptical galaxies (Angelini, Loewenstein, & Mushotzky 2001; Sarazin et al. 2000). In elliptical galaxies (including NGC 4365), the globular cluster population is more broadly distributed than that of the optical light and field stars (e.g., Harris 1991). This might help to explain the broader distribution of the LMXBs. Figure 8 suggests that there may be two populations of LMXBs, one with a small effective radius perhaps consistent with the optical distribution, and one with a larger effective radius. It is possible that these two distributions represent the LMXBs formed in globular clusters and those formed from field binary star systems. However, we note that in NGC 4697, the LMXBs followed the optical light distribution (Sarazin et al. 2001). More elliptical galaxies need to be observed to resolve this question.
To test whether the LMXBs in these galaxies could discriminate between such models, we added either a second de Vaucouleurs model or an exponential model to the optical light distribution. For either additional component, there were only minimal improvements to the fits ( for NGC 4365 and for NGC 4382, with one less dof compared to the single profile), indicating that the current data cannot statistically discriminate between single de Vaucouleurs distributions with large effective radii or multiple component distributions.
5 Spectral Analysis
We extracted spectra of the sources and diffuse emission in both galaxies. We restricted the spectral analysis to the 0.7 – 9 keV range. The lower limit was taken to avoid calibration uncertainties, while there are few non-background counts beyond 9 keV. We also found a possible spectral artifact around 1.6–1.9 keV, which has been noticed by others 777See http://asc.harvard.edu/cal/Links/Acis/acis/Cal_projects/index.html.. We believe this artifact is minor enough that it should not effect continuum models (bremsstrahlung or power-law); however, we chose to excise the 1.6–1.9 keV band when we fit line models (mekal). All of the spectra were grouped to have at least 25 counts per spectral bin prior to background correction to enable our use of statistics. The use of minimum counts per spectral bin and restricted energy ranges can result in bins being excluded in the allowed energy range.
The results of the spectral fits are summarized in Tables 3 and 4. Spectra were extracted for the resolved point sources (‘Sources’), the unresolved diffuse emission excluding the point sources (‘Unresolved’), and for the total emission (sources and unresolved emission). The total emission spectra were studied for comparison to instruments with poorer spatial resolution that cannot resolve the point sources. The third column gives the geometric region for the spectrum; ‘Field’ implies the entire S3 chip. The value of the absorbing column density () applied to all components of the model emission spectrum is given in column 4. In this and other columns, values in parentheses are fixed (not allowed to vary). The fixed value of is the Galactic value from Dickey & Lockman (1990). As in Sarazin et al. (2001), a two component model was necessary to fit the total spectrum data. A hard component, modeled by thermal bremsstrahlung (‘bremss’) or by a power-law (‘power’) spectrum, was used to model the resolved and unresolved LMXBs. An additional soft line emitting component (‘mekal’) was used for gaseous diffuse emission. We used the xspec acisabs model to correct for the QE degradation. For the hard component, columns 5–7 give the spectral model, the temperature (for bremsstrahlung) or photon number spectral index , and the unabsorbed flux of the hard component, (0.3–10 keV). Similarly, columns 8–10 give the temperature , overall heavy element abundance relative to solar, and flux for the soft mekal component. For the unresolved emission, the spectra exclude regions around each of the resolved sources. The last two columns give the number of net counts in each spectrum, and per degree of freedom (dof) for the best-fit model. All errors reported in the spectral analysis are 90% confidence level errors. Parentheses are used to indicate a frozen parameter and brackets are used when an error is unconstrained.
The background spectra for the resolved sources were determined locally, using the same nearby regions as discussed in § 4. For the spectra of the resolved diffuse emission and the total spectrum (sources and unresolved emission), the background was taken from the deep blank sky backgrounds compiled by Maxim Markevitch33footnotemark: 3.
The spectra of several spatial regions were analyzed. In NGC 4365, the spectra of sources, unresolved emission, and total emission were derived from an inner region, which was determined by the elliptical optical isophote containing one-half of the optical light. We will refer to this region as within “one effective radius”. The semimajor axis of this isophote is defined as . In NGC 4365, this isophote has , a semi-minor axis of , and a PA of 40° (de Vaucouleurs et al. 1992). In NGC 4382, the corresponding isophote did not have sufficient counts from resolved sources for spectral analysis. Therefore, we chose the innermost region of NGC 4382 to be twice as large (2 ), which gave an elliptical region with a semi-major axis of 123″, a semi-minor axis of 955, and a PA of 0° (de Vaucouleurs et al. 1992; Fisher 1997). This isophote contains 69% of the optical light. We fit the sources (resolved emission), unresolved emission, and total emission in these innermost regions. We also examined the spectra of the sources for the entire field. In order to search for changing unresolved emission with radius, we chose to analyze the elliptical annulus between one and three effective radii for both galaxies, corresponding to % of the optical light. For both galaxies, we used the same PA as the innermost region. In NGC 4365, there were enough counts from resolved sources between one and three effective radii to also analyze that spectrum. Finally, we analyzed the total emission spectra in the three effective radii region. Since the different spectra (source, unresolved, and total) were binned separately, all of the counts for a point source were assigned to a region based the source was near the edge of the region, and the source spectra used a local background, while the unresolved and total spectra used a blank-sky background, the counts of the source spectrum plus the unresolved spectrum in a region will not exactly equal the counts of the total spectrum.
5.1 X-ray Spectra of Resolved Sources
5.1.1 NGC 4365
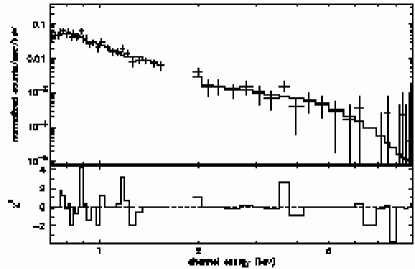
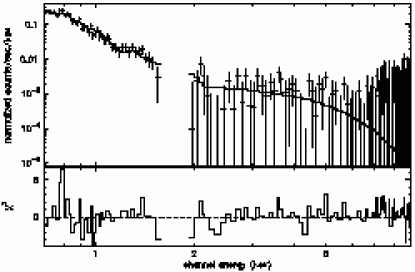
For NGC 4365, we extracted the spectrum of all resolved sources within one effective radius. The observed spectrum is shown on the left side of Figure 9. As has been found in other early-type galaxies (Sarazin et al. 2001), the combined spectra of the sources was reasonably well-fit by either a thermal bremsstrahlung model with keV (Table 3, row 1) or power-law model with a photon number spectral index of (row 3). The power-law model gave a slightly better fit, so we adopted this model as our best-fit. The fits were not improved significantly when the absorbing column was allowed to vary (rows 2 & 4), so we fixed the hydrogen column at the Galactic value, cm-2 (Dickey & Lockman 1990). The adopted best-fit power-law model with Galactic absorption and residuals to the fit are shown on the left side of Figure 9. Although the hardness ratios indicate that each source is probably fit by a more complex model than a power-law and Galactic absorption, the summation of counts from objects with different emission properties can be well fit with a single power-law and Galactic absorption. Extending the spectrum down to 0.3 keV to see how the restricted energy range used in fitting affects the absorbing column does result in a somewhat higher absorption value; however, we believe the calibration at low energies is still too unreliable to confidently claim an excess absorption.
We also searched for any radial variation in the spectra of the sources. We extracted the spectrum from an elliptical annulus between one and three effective radii. We first fit this region using the source best-fit model from the inner one effective radius region, which provided an acceptable fit (row 5). When we allowed the power-law index to vary (row 6), we found a better fit ( with one less dof); however, the two values of agree their 90% confidence limits. Freeing the absorption also yielded a better fit, ( with one fewer dof); however, Galactic absorption was allowed at the 90% confidence limit.
We also attempted to fit the collective spectrum of all of the resolved sources on the S3 chip, which had 2660 net counts. Again, freeing the power-law index from the best-fit value for the inner effective radii produced a better fit; however, the power-law index is still consistent with the best-fit 90% confidence limit (rows 8 & 9). Freeing the absorbing column did not produce a better fit (rows 9 & 10). We find no clear trend between radius and spectral fit. This is consistent with results from a study of the sources in 15 galaxies by Irwin et al. (2003).
5.1.2 NGC 4382
For NGC 4382, the lower number of sources and counts required using the inner two effective radii to attain 921 net counts in the spectrum. For this region, the adopted best-fit model had a power-law index of 1.52 with the Galactic absorption column of cm-2 (Table 4, row 3). Neither using a bremsstrahlung model (row 1) nor freeing the absorbing column (rows 2 and 4) gave a better fit. Again, we remark that although hardness ratios indicate that each source is probably fit by a more complex model than a power-law and Galactic absorption, the summation of counts from objects with different emission properties can be well fit with a single power-law and Galactic absorption. The best-fit indicated no excess absorption when we extended the spectrum down to 0.3 keV.
Since there were not enough resolved source counts between one and three effective radii, we determined the spectrum of the entire field (which of course includes the inner two effective radius region discussed above). There were no large statistically-significant differences in the fits for the entire field and for the inner region (rows 5–7). Within the 90% confidence level, the sources could be fit by a power-law fit with indices between 1.45 and 1.65 (inclusive of the inner two effective radius fit) and an absorbing column of cm-2. Note that an important contribution to the spectrum in the outer parts of the observation of NGC 4382 is Src. 38, which is a known background AGN. However, this AGN has X-ray hardness ratios which indicate that it doesn’t have a particularly hard or absorbed spectrum (Table 2). The X-ray hardness ratios for this source are similar to the average values for the LMXBs in NGC 4382. Since we can rarely identify an AGN with a particular source, AGN always contribute to spectra describing the resolved sources. Removing Src. 38 from the spectral analysis would hinder comparisons with other galaxies’ resolved sources.
5.2 X-ray Spectra of Unresolved Emission
5.2.1 NGC 4365
Again, we began by exploring the spectrum of the inner effective radius, which had 935 net counts. This spectrum is shown on the left side of Figure 10. First, we attempted to model the unresolved emission with a soft mekal component representing the emission by diffuse interstellar gas (Table 3, row 11). In general, none of the spectral fits were improved by allowing the absorbing column to vary (e.g., row 12), so we will discuss only fits with a fixed Galactic column. Values from both mekal-only fits are consistent with previous ROSAT measurements from Davis & White (1996). The fits to the unresolved emission using only a soft mekal model showed large residuals at high energies. Of course, the unresolved emission includes unresolved point sources as well as diffuse gas, and the unresolved point sources will have a hard spectrum if they are like the resolved sources. Thus, we added a hard component to the fit with the same spectral shape as the best-fit model for the source. This produced a dramatic reduction in by 37 for one less dof, clearly indicating values from single temperature fits, like in Davis & White (1996), may be suspect. Allowing the power-law index to vary did not improve the fit significantly. Therefore, we adopted the model with a power-law index of 1.67, a mekal temperature of keV, and an abundance in solar units of (row 13) as our best-fit model for unresolved emission (Figure 10). Although the line emission strength from heavy elements is well constrained, minimal emission from hydrogen leads to poorly constrained () abundances. These best-fit values are consistent with some of the soft temperatures and abundances found from two-temperature fits to ASCA observations (Buote & Fabian 1998).
We also examined whether the unresolved emission’s spectrum changed with radius. The unresolved spectrum between one and three effective radii had 1155 net counts. We first fit this spectrum with the best-fit model for unresolved emission (row 14). Then, we allowed the soft component model to vary in the fit. This produced a much better fit () with a statistically significant higher temperature (row 15). This suggests that there is a positive radial gradient in the temperature of the gas. If there is a significant gradient, this would also affect the spectra in the inner parts of the galaxy. We would be observing both cooler gas located near the center of the galaxy, and hotter gas at larger radii seen in projection against the center. Thus, we tried fitting the emission from the inner effective radius with two soft components and a hard component; that model did not improve on the single soft+hard model spectral fit we report in Table 3. A temperature gradient may exist in the diffuse gas; however, deeper observations of NGC 4365 are necessary to do a more detailed deprojection.
In addition to a possible temperature gradient in the diffuse emission, the spectral fits of the sources and unresolved emission point to a possible change in the unresolved sources with respect to radius. In the resolved sources, the model flux for sources in the inner effective radius and sources between one and three effective radii are about the same. The correction for increased contribution by background sources based on the luminosity function we fit earlier suggests that the flux from resolved sources between one and three effective radii should be times the flux from resolved sources in the inner effective radius. The luminosity function of background sources in a particular field can differ from an average field either by total number of sources or by having a brighter than expected background source in the field. Source 69 is a very hard and bright source that might be such an unusually bright AGN. This source accounts for of the hard counts in the one to three effective radii resolved source region. If we were to exclude this source, the flux ratio between the two regions would be . One would expect that if the unresolved sources distribution is the same as the resolved source distribution, we should find a flux ratio between and for the unresolved sources. Instead, the best-fit unresolved emission between one and three effective radii is a purely soft component fit. At best, we can limit the ratio to be . This suggests that the unresolved sources radial distribution may decline more rapidly than the resolved source distribution. Poisson errors in the 2–9 keV count rate of the one to three effective radii unresolved emission are too large to statistically confirm this result. Deeper X-ray observations of NGC 4365 are needed to resolve enough sources to allow the faint source and bright source radial distribution to be compared.
5.2.2 NGC 4382
The spectrum of the unresolved emission of the inner two effective radii (right side of Figure 10) had 2620 counts. We initially fit the spectrum with a model containing only a soft mekal component representing emission from diffuse interstellar gas (row 8). The best-fit models with varying absorption gave values below the Galactic column, but with an upper limit which included the Galactic value (Table 4, row 9). Thus, we chose to use the Galactic column for all remaining fits of this galaxy’s spectra. As with NGC 4365, the addition of a hard component representing unresolved sources led to a much better statistical fit (row 10). Allowing the parameters of the hard component to vary did not result in a significantly better fit, and the hard component parameters were very poorly constrained. Thus, we fixed the shape of the spectrum of the hard component to the adopted model for the resolved sources in the galaxy. This leads to an acceptable fit (row 10); however, its abundance is abnormally high and poorly constrained due to minimal emission from hydrogen. Therefore, we have frozen the abundance at 0.5 solar for all remaining soft component fits in this galaxy. This choice (row 11) is very close to the best fit (). This best-fit model has a temperature of and is shown in Figure 10.
We extracted the unresolved emission spectrum from a larger (but overlapping) elliptical annulus extending from one to three effective radii. The spectrum in this region was reasonably fit by the same gas temperature and abundance which provided the best fit within two effective radii (row 12). When the gas temperature was allowed to vary (row 13), the best-fit temperature increased; however, that increase was not statistically significant. Unlike in NGC 4365, we find no change in the flux ratio of the resolved and unresolved sources with increasing radius.
5.3 Total X-ray Spectra
5.3.1 NGC 4365
We first extracted the spectrum of all of the emission within one effective radius. The spectrum in this region is consistent with the best-fit spectra for the resolved and unresolved emission (row 16); when the spectral parameters of the hard and soft components were allowed to vary, the fits were not significantly improved (rows 17 and 18) and did not constrain the abundance. We also attempted a model with a bremsstrahlung hard component (row 19). This fit slightly better than the power-law model, was more successful at constraining the abundance ( solar), but did not constrain the bremsstrahlung temperature well ( keV). We therefore adopted the sum of the best-fit spectra for the resolved and unresolved emission as our best-fit for the total emission. The total emission within three effective radii yielded the same fit within the overlap of the two region’s errors for a power-law hard component model. Again, a bremsstrahlung hard component could better constrain the soft component abundance at the expense of constraining the hard component temperature. The abundance is significantly lower than the best-fit unresolved abundance; however, the statistics can not discriminate between the power-law fit, with its poorly constrained abundance ( solar), and the bremsstrahlung fit to within a 90% confidence level. Therefore, we do not claim any abundance gradient in the total emission.
In Matsumoto et al. (1997), a bremsstrahlung model with a temperature of keV or a power-law model with index was fit to the hard component, while the soft component was fit by either a mekal or a Raymond-Smith model with temperature keV and poorly constrained abundance ( solar). These results are consistent with what we have found.
5.3.2 NGC 4382
The results for NGC 4382 were similar to those for NGC 4365. Within two effective radii, the total spectrum was fit well by the combination of the best-fit hard component from the resolved sources and the best-fit soft component from the diffuse emission (Table 4, row 14). Freeing the hard and soft spectral parameters did not improve the fit significantly (rows 15 and 16). A bremsstrahlung hard component did not produce a better fit and poorly constrained the bremsstrahlung temperature keV. There was no significant change between the total emission within two effective radii and the total emission within three effective radii.
Once again, the results were similar to Matsumoto et al. (1997). They used the same hard component model discussed above for NGC 4365, and fit a soft temperature keV. Matsumoto et al. (1997) were able to constrain the abundance using the Raymond-Smith model to 0.029–0.21 solar, but could not constrain the abundance for the mekal model.
5.4 Discrete versus Diffuse Emission
We used both counts (0.3–10.0 keV) and spectral fitting results to determine the fraction of the X-ray emission which was due to diffuse gas versus the fraction due to point sources, whether resolved or not. The unresolved emission is a combination of unresolved point sources and truly diffuse gaseous emission. We used the resolved source hardness ratios of the each region to separate unresolved counts into point sources and diffuse gas. We also compared the hard flux (point sources) to the soft flux (diffuse gas) in the total emission spectra. Uncertainty in the spectral models used lead to a much wider range of derived flux ratios than count ratios. Since the gas is softer than the sources, absorption affects the diffuse emission more. Therefore, the unabsorbed flux ratio of point sources to total emission need not be larger than the count ratio of point sources to total emission, as one one would expect.
For the inner one effective radius of NGC 4365 the point sources are responsible for of the total counts and of the unabsorbed flux (Table 3, rows 16–19). Approximately of the point source counts are resolved. The unresolved point source flux overlaps with 90% confidence level fluxes obtained from the derived luminosity function extended down to ergs s-1. Moving to the region within three effective radii the point sources are responsible for of the total counts and of the unabsorbed flux (rows 20 & 21).
In the inner two effective radii of NGC 4382 the point sources account for of the total counts and of the unabsorbed flux (Table 4, rows 14–17), with of the point source counts resolved. Again, the unresolved point source flux overlaps with 90% confidence level fluxes obtained from the derived luminosity function extended down to ergs s-1. In the inner three effective radii, the point sources account for of the total counts and of the unabsorbed flux (rows 18 & 19).
For both galaxies, it was crucial that a majority of the source were resolved. For power-law models, the 90% confidence limit on the power-law index was cut by a factor of 2–3 sources were resolved. If one uses bremsstrahlung models, the bremsstrahlung temperature had no upper constraint unless the sources’ spectra could be fit separately.
6 Spatial Distribution of the Diffuse Gaseous Emission
We derived the radial distribution of the diffuse gas, based on the surface brightness distribution in the soft band (0.3–1 keV). We excluded regions around each of the resolved sources in determining the diffuse surface brightness. Although the diffuse gas generally dominates in the soft band, this emission still contains a contribution from unresolved sources (§ 5.2). To remove the effect of the unresolved point sources, we have assumed that the spectrum of the sum of all resolved sources in the S3 field is representative of the spectrum of the unresolved sources. Based on the observed spectra, we also assume that the diffuse gas produces no significant hard band (2–10 keV) emission. Thus, we determined the surface brightness profile in the hard band (removing resolved sources), and scale this by the ratio of soft to hard band emission expected based on the best-fit spectrum of the resolved point sources. This soft band surface brightness profile for the sources was subtracted from the observed soft band profile, and we attribute the remainder to diffuse gas. We performed this operation in regular circular annuli out to , and corrected the profiles for background and exposure.
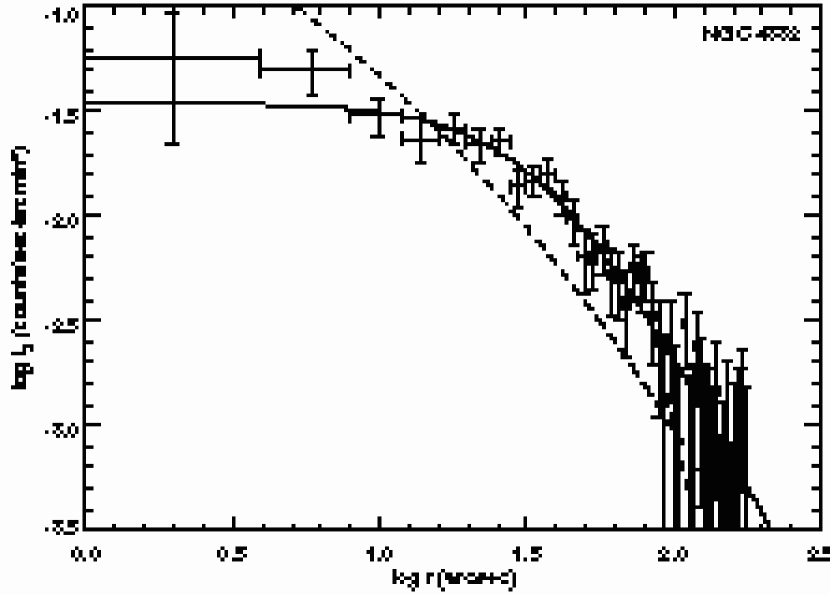
Figure 11 displays the observed soft band gaseous surface brightness profiles as a function of projected radius, . The dashed lines display the best-fit de Vaucouleurs profiles with effective radii fixed at the values for the optical light in the galaxies (498 for NGC 4365 and 546 for NGC 4382). The normalization was varied to achieve the best fit. NGC 4365 is acceptably fit by such a profile, with a of 29.8 for 29 dof. NGC 4382 is unacceptably fit by the de Vaucouleurs profile, and the diffuse gas surface brightness is consistently larger than the optical profile at . Baggett, Baggett, & Anderson (1998) found that NGC 4382 could be decomposed into a bulge with an effective radius of and a disk with a scale length of . Adjusting the normalization of the bulge plus disk profile better fit the X-ray profile; however, it was still an unacceptable fit ( for 29 dof). Therefore, we attempted a standard beta model profile,
| (2) |
where is the core radius. The fit for NGC 4365 was much better than the de Vaucouleurs profile, of 17.7 for 27 dof with (0.50 kpc) and (90% confidence errors). This near power-law fit is similar to those for NGC 1291 and NGC 4697 (Irwin et al. 2002; Sarazin et al. 2001). NGC 4382 had a similar quality beta model fit with (3.2 kpc) and . Since is constrained by the outer data points, the much larger core radius of NGC 4382 is responsible for the larger confidence limit of its compared to NGC 4365. The beta models for both galaxies are similar to the profiles of X-ray bright galaxies within the errors (Forman et al. 1985; Trinchieri et al. 1986). For NGC 4382, its large core radius, rounder X-ray emission than optical emission, and lower gas temperature at inner radii are roughly consistent with predictions by Brighenti & Mathews (1996) for a rotating interstellar gas distribution; however, the core radius is about half their predicted value for a galaxy in Virgo.
7 Conclusions
The ability of Chandra observations to separate X-ray emission into point sources (LMXBs and background sources) and diffuse emission (unresolved LMXBs and diffuse gas) plays a crucial part in exploring the properties of the X-ray faint early-type galaxies NGC 4365 and NGC 4382. We detected 99 sources in NGC 4365 and 58 sources in NGC 4382, while we expect that approximately 12 sources in each galaxy are due to unrelated background sources. Within one effective radius of NGC 4365, of the counts is resolved into sources, of the counts is attributed to unresolved LMXBs, and is attributed to diffuse gas. This distribution is consistent with that of another X-ray faint elliptical galaxy, NGC 4697 (Sarazin et al. 2001), after correcting for different sensitivities. Within two effective radii of NGC 4382, of the counts is resolved into sources, of the flux is attributed to unresolved LMXBs, and is attributed to diffuse gas. The higher diffuse gas fraction in this lenticular is consistent with NGC 1553 (Blanton et al. 2001), also an X-ray faint lenticular galaxy; however, NGC 4382 resolves less of its flux into sources than NGC 1553, despite a better sensitivity.
The hardness ratios of the resolved sources tend to be harder (more H21) than a range of power-law indices with Galactic absorption. This suggests that the source emission spectra are more complex than single power-laws. No supersoft sources were found in either of the two galaxies. The spectra of the sum of all the sources were best fit by a power-law model with Galactic absorption. The power-law of NGC 4382, 1.52, was harder than that of NGC 4365, 1.67; however, the indices are the same within their 90% confidence interval and are consistent with the best-fit value of the sources simultaneously fit in a survey of 15 galaxies (Irwin et al. 2003).
For sources in NGC 4365, 18 sources out of 37 in a WFPC2 field of view had positions correlated with a globular cluster compared to the expected from random association. An additional source’s position has also been identified with a globular cluster. Three of the sources in NGC 4365 are variable at the 99% confidence level. The spatial distributions of the sources are broader than the optical de Vaucouleurs distribution of each galaxy.
The most surprising results from analysis of the sources are the luminosity fits. Both galaxies were best fit with cutoff power-laws, where the cutoff luminosities were between 0.9-3.1 ergs s-1. Although broken power-laws were within the 90% confidence interval, the break luminosity was similar to the cutoff luminosity. This is in contrast to the prior break/cutoff luminosities of NGC 1291, NGC 1553, and NGC 4697 ( 2-6 ergs s-1), which had been identified with the Eddington luminosity of a spherically accreting neutron star (Sarazin et al. 2001; Blanton et al. 2001; Irwin et al. 2002). It seems unlikely that the cutoff luminosities of NGC 4365 and NGC 4382 can be attributed to that physical mechanism. One other X-ray faint early-type galaxy, NGC 1316, indicates a break luminosity that may be as high as the cutoff luminosities found in NGC 4365 & NGC 4382; however, the galaxies in this paper provide a tighter constraint on a cutoff/break luminosity well above the neutron star Eddington luminosity.
In NGC 4365, the temperature of the diffuse gas is keV and its abundance is poorly constrained ( solar) in the inner effective radius. There is some evidence for a positive temperature gradient in NGC 4365; however, deeper observations are necessary to confirm any radial gradients in temperature or abundance. NGC 4382 was best fit with a temperature of keV and a poorly constrained abundance ( solar).
The diffuse gas surface brightness profiles in both galaxies were fit by standard beta model profiles. NGC 4365 had a small (, 0.5 kpc) core radius and , similar to NGC 4697. NGC 4382 had a larger core radius (3.2 kpc) and between and . The larger core radius, combined with the X-ray emission being rounder than the optical emission, and evidence of a cooler central region, may indicate rotation of the diffuse gas.
References
- Angelini et al. (2001) Angelini, L., Loewenstein, M., & Mushotzky, R. F. 2001, ApJ, 557, L35
- Baggett et al. (1998) Baggett, W. E., Baggett, S. M., & Anderson, K. S. J. 1998, AJ, 116, 1626
- Barton et al. (1996) Barton, E., Geller, M., Ramella, M., Marzke, R. O., & da Costa, L. N. 1996, AJ, 112, 871
- Blanton et al. (2001) Blanton, E. L., Sarazin, C. L., & Irwin, J. A. 2001, ApJ, 552, 106
- Brandt et al. (2000) Brandt, W. N., et al. 2000, AJ, 119, 2349
- Brighenti & Mathews (1996) Brighenti, F., & Mathews, W. G. 1996, ApJ, 470, 747
- Buote & Fabian (1998) Buote, D. A., & Fabian, A. C. 1998, MNRAS, 296, 977
- Canizares et al. (1987) Canizares, C. R., Fabbiano, G., & Trinchieri, G. 1987, ApJ, 312, 503
- Cutri et al. (2001) Cutri, R. M., et al. 2001, Explanatory Supplement to the 2MASS Second Incremental Data Release, The Two Micron All Sky Survey at IPAC Website: http://www.ipac.caltech.edu/2mass/releases/second/doc/explsup.html
- Davis & White (1996) Davis, D. S., & White, R. E. 1996, ApJ, 470, L35+
- de Vaucouleurs et al. (1992) de Vaucouleurs, G., de Vaucouleurs, A., Corwin, H. G., Buta, R. J., Paturel, G., & Fouque, P. 1992, Third Reference Catalogue of Bright Galaxies (RC3)
- Dickey & Lockman (1990) Dickey, J. M., & Lockman, F. J. 1990, ARA&A, 28, 215
- Fabbiano et al. (1994) Fabbiano, G., Kim, D.-W., & Trinchieri, G. 1994, ApJ, 429, 94
- Fisher (1997) Fisher, D. 1997, AJ, 113, 950+
- Forman et al. (1985) Forman, W., Jones, C., & Tucker, W. 1985, ApJ, 293, 102
- Giacconi et al. (2001) Giacconi, R., et al. 2001, ApJ, 551, 624
- Harris (1991) Harris, W. E. 1991, ARA&A, 29, 543
- Høg et al. (1998) Høg, E., Kuzmin, A., Bastian, U., Fabricius, C., Kuimov, K., Lindegren, L., Makarov, V. V., & Roeser, S. 1998, A&A, 335, L65
- Høg et al. (2000) Høg, E., et al. 2000, A&A, 355, L27
- Irwin et al. (2003) Irwin, J. A., Athey, A. E., & Bregman, J. N. 2003, ApJ, 587, 356
- Irwin et al. (2002) Irwin, J. A., Sarazin, C. L., & Bregman, J. N. 2002, ApJ, 570, 152
- Kim & Fabbiano (2003) Kim, D., & Fabbiano, G. 2003, ApJ, 586, 826
- Kim et al. (1996) Kim, D.-W., Fabbiano, G., Matsumoto, H., Koyama, K., & Trinchieri, G. 1996, ApJ, 468, 175
- Kim et al. (1992) Kim, D.-W., Fabbiano, G., & Trinchieri, G. 1992, ApJ, 393, 134
- Knezek & Bregman (1998) Knezek, P. M., & Bregman, J. N. 1998, AJ, 115, 1737
- Kundu et al. (2003) Kundu, A., Maccarone, T. J., Zepf, S. E., & Puzia, T. H. 2003, ApJ, 589, L81
- Kundu & Whitmore (2001) Kundu, A., & Whitmore, B. C. 2001, AJ, 121, 2950
- Larsen et al. (2003) Larsen, S. S., Brodie, J. P., Beasley, M. A., Forbes, D. A., Kissler-Patig, M., Kuntschner, H., & Puzia, T. H. 2003, ApJ, 585, 767
- Matsumoto et al. (1997) Matsumoto, H., Koyama, K., Awaki, H., Tsuru, T., Loewenstein, M., & Matsushita, K. 1997, ApJ, 482, 133
- Monet et al. (1998) Monet, D. B. A., et al. 1998, USNO-A2.0, A Catalog of Astrometric Standards (Flagstaff: U.S. Naval Observatory)
- Mushotzky et al. (2000) Mushotzky, R. F., Cowie, L. L., Barger, A. J., & Arnaud, K. A. 2000, Nature, 404, 459
- O’Sullivan et al. (2001) O’Sullivan, E., Forbes, D. A., & Ponman, T. J. 2001, MNRAS, 328, 461
- Pellegrini (1994) Pellegrini, S. 1994, A&A, 292, 395
- Porter (1993) Porter, A. C. 1993, PASP, 105, 1250
- Randall et al. (2003) Randall, S. W., Sarazin, C. L., & Irwin, J. A. 2003, ApJ, submitted
- Sarazin et al. (2000) Sarazin, C. L., Irwin, J. A., & Bregman, J. N. 2000, ApJ, 544, L101
- Sarazin et al. (2001) —. 2001, ApJ, 556, 533
- Tonry et al. (2001) Tonry, J. L., Dressler, A., Blakeslee, J. P., Ajhar, E. A., Fletcher, A. ., Luppino, G. A., Metzger, M. R., & Moore, C. B. 2001, ApJ, 546, 681
- Trinchieri et al. (1986) Trinchieri, G., Fabbiano, G., & Canizares, C. R. 1986, ApJ, 310, 637
- White & Davis (1997) White, R. E., & Davis, D. S. 1997, in ASP Conf. Ser. 115, Galactic Cluster Cooling Flows, ed. N. Soker (San Francisco: ASP), 217
| Src. | R.A. | Dec. | Count Rate | |||||||
|---|---|---|---|---|---|---|---|---|---|---|
| No. | Name | (h:m:s) | (::) | () | ( s-1) | SNR | H21 | H31 | Notes | |
| (1) | (2) | (3) | (4) | (5) | (6) | (7) | (8) | (9) | (10) | (11) |
| 1 | CXOU J122428.3071904 | 12 24 28.32 | 7 19 04.1 | 1.0 | 37.343.18 | 11.75 | 152.49 | a,b,d | ||
| 2 | CXOU J122428.1071902 | 12 24 28.18 | 7 19 02.9 | 1.4 | 14.231.98 | 7.17 | 58.10 | a,b | ||
| 3 | CXOU J122428.4071906 | 12 24 28.44 | 7 19 06.0 | 3.5 | 48.893.61 | 13.53 | 199.64 | a,b | ||
| 4 | CXOU J122428.5071905 | 12 24 28.59 | 7 19 05.5 | 5.2 | 8.861.56 | 5.69 | 36.16 | a,b | ||
| 5 | CXOU J122427.8071907 | 12 24 27.89 | 7 19 07.3 | 6.5 | 4.591.16 | 3.95 | 18.75 | d,f | ||
| 6 | CXOU J122428.3071857 | 12 24 28.36 | 7 18 57.0 | 7.0 | 5.941.35 | 4.39 | 24.26 | |||
| 7 | CXOU J122428.6071908 | 12 24 28.67 | 7 19 08.0 | 7.4 | 13.661.97 | 6.93 | 55.76 | |||
| 8 | CXOU J122428.7071853 | 12 24 28.70 | 7 18 53.7 | 12.0 | 3.371.01 | 3.34 | 13.76 | d,f | ||
| 9 | CXOU J122428.9071856 | 12 24 28.97 | 7 18 56.6 | 12.8 | 7.111.43 | 4.98 | 29.04 | d,f | ||
| 10 | CXOU J122429.1071859 | 12 24 29.18 | 7 18 59.6 | 14.3 | 5.401.28 | 4.23 | 22.04 | d,f | ||
| 11 | CXOU J122428.4071849 | 12 24 28.43 | 7 18 49.4 | 14.6 | 3.531.04 | 3.39 | 14.42 | |||
| 12 | CXOU J122427.1071901 | 12 24 27.18 | 7 19 01.6 | 16.2 | 7.181.45 | 4.95 | 29.33 | d,f | ||
| 13 | CXOU J122429.3071850 | 12 24 29.33 | 7 18 50.4 | 20.8 | 4.161.14 | 3.67 | 17.00 | d,f | ||
| 14 | CXOU J122429.7071904 | 12 24 29.72 | 7 19 04.1 | 21.7 | 16.482.12 | 7.78 | 67.31 | |||
| 15 | CXOU J122428.9071844 | 12 24 28.92 | 7 18 44.0 | 22.1 | 6.531.31 | 5.00 | 26.66 | |||
| 16 | CXOU J122427.2071844 | 12 24 27.29 | 7 18 44.4 | 24.2 | 5.741.30 | 4.42 | 23.45 | g | ||
| 17 | CXOU J122426.6071856 | 12 24 26.61 | 7 18 56.3 | 25.7 | 3.220.97 | 3.31 | 13.14 | d,f | ||
| 18 | CXOU J122427.3071926 | 12 24 27.31 | 7 19 26.1 | 26.4 | 11.781.80 | 6.56 | 48.11 | d,f | ||
| 19 | CXOU J122429.8071916 | 12 24 29.85 | 7 19 16.6 | 26.9 | 14.331.97 | 7.28 | 58.51 | |||
| 20 | CXOU J122428.1071836 | 12 24 28.17 | 7 18 36.0 | 27.8 | 4.531.13 | 4.00 | 18.50 | |||
| 21 | CXOU J122429.3071839 | 12 24 29.32 | 7 18 39.0 | 29.3 | 3.891.07 | 3.63 | 15.88 | g | ||
| 22 | CXOU J122427.4071934 | 12 24 27.49 | 7 19 34.4 | 32.7 | 3.931.06 | 3.72 | 16.04 | |||
| 23 | CXOU J122428.5071831 | 12 24 28.50 | 7 18 31.1 | 32.9 | 21.172.38 | 8.90 | 86.44 | |||
| 24 | CXOU J122427.8071830 | 12 24 27.88 | 7 18 30.5 | 33.8 | 13.641.93 | 7.06 | 55.69 | |||
| 25 | CXOU J122428.7071938 | 12 24 28.72 | 7 19 38.7 | 35.5 | 6.861.38 | 4.97 | 27.99 | d,f | ||
| 26 | CXOU J122429.1071937 | 12 24 29.13 | 7 19 37.9 | 36.5 | 2.690.89 | 3.04 | 11.00 | d,f | ||
| 27 | CXOU J122429.9071832 | 12 24 29.97 | 7 18 32.5 | 40.4 | 3.511.01 | 3.48 | 14.32 | |||
| 28 | CXOU J122430.9071852 | 12 24 30.92 | 7 18 52.8 | 41.2 | 2.790.90 | 3.10 | 11.40 | |||
| 29 | CXOU J122429.8071938 | 12 24 29.82 | 7 19 38.5 | 41.7 | 2.650.89 | 3.00 | 10.83 | g | ||
| 30 | CXOU J122428.4071946 | 12 24 28.42 | 7 19 46.9 | 43.2 | 6.671.36 | 4.91 | 27.23 | |||
| 31 | CXOU J122427.6071947 | 12 24 27.63 | 7 19 47.1 | 44.3 | 2.660.89 | 3.00 | 10.87 | g | ||
| 32 | CXOU J122430.4071933 | 12 24 30.48 | 7 19 33.6 | 44.5 | 4.051.08 | 3.74 | 16.54 | |||
| 33 | CXOU J122426.8071944 | 12 24 26.89 | 7 19 44.7 | 45.7 | 5.031.51 | 3.33 | 20.53 | |||
| 34 | CXOU J122429.1071949 | 12 24 29.10 | 7 19 49.3 | 47.2 | 2.940.93 | 3.17 | 11.99 | d,f | ||
| 35 | CXOU J122431.2071925 | 12 24 31.20 | 7 19 25.7 | 49.0 | 5.081.20 | 4.24 | 20.76 | |||
| 36 | CXOU J122428.4071813 | 12 24 28.48 | 7 18 13.9 | 50.0 | 7.661.48 | 5.18 | 31.27 | |||
| 37 | CXOU J122425.3071828 | 12 24 25.35 | 7 18 28.0 | 56.2 | 2.790.92 | 3.04 | 11.40 | d,f | ||
| 38 | CXOU J122427.7071806 | 12 24 27.74 | 7 18 06.9 | 57.4 | 18.652.27 | 8.23 | 76.14 | |||
| 39 | CXOU J122431.8071923 | 12 24 31.89 | 7 19 23.4 | 57.5 | 3.220.96 | 3.37 | 13.15 | |||
| 40 | CXOU J122425.2071826 | 12 24 25.24 | 7 18 26.6 | 58.3 | 3.601.03 | 3.48 | 14.69 | d,f | ||
| 41 | CXOU J122431.4071827 | 12 24 31.45 | 7 18 27.5 | 59.8 | 5.431.22 | 4.45 | 22.19 | |||
| 42 | CXOU J122424.6071833 | 12 24 24.66 | 7 18 33.9 | 61.3 | 11.861.79 | 6.63 | 48.44 | |||
| 43 | CXOU J122425.1071947 | 12 24 25.16 | 7 19 47.9 | 63.9 | 3.951.06 | 3.74 | 16.11 | |||
| 44 | CXOU J122428.5072009 | 12 24 28.56 | 7 20 09.5 | 65.8 | 3.221.07 | 3.02 | 13.14 | d,f | ||
| 45 | CXOU J122430.3072005 | 12 24 30.30 | 7 20 05.1 | 68.4 | 4.211.19 | 3.55 | 17.21 | d,f | ||
| 46 | CXOU J122423.7071922 | 12 24 23.73 | 7 19 22.7 | 69.9 | 2.620.86 | 3.05 | 10.70 | |||
| 47 | CXOU J122425.2071804 | 12 24 25.29 | 7 18 04.6 | 73.9 | 10.721.68 | 6.39 | 43.76 | |||
| 48 | CXOU J122423.1071836 | 12 24 23.15 | 7 18 36.9 | 80.6 | 2.700.89 | 3.02 | 11.01 | d,f,g | ||
| 49 | CXOU J122432.5071955 | 12 24 32.50 | 7 19 55.2 | 81.5 | 3.170.96 | 3.29 | 12.94 | |||
| 50 | CXOU J122429.4072027 | 12 24 29.42 | 7 20 27.1 | 85.1 | 6.291.31 | 4.79 | 25.69 | d,f | ||
| 51 | CXOU J122430.7071746 | 12 24 30.75 | 7 17 46.5 | 85.7 | 3.651.03 | 3.55 | 14.89 | |||
| 52 | CXOU J122425.6071746 | 12 24 25.69 | 7 17 46.0 | 86.7 | 16.832.10 | 8.02 | 68.71 | |||
| 53 | CXOU J122422.4071851 | 12 24 22.40 | 7 18 51.4 | 88.0 | 5.851.26 | 4.64 | 23.89 | d,f | ||
| 54 | CXOU J122432.2072010 | 12 24 32.29 | 7 20 10.5 | 89.7 | 4.011.05 | 3.81 | 16.37 | |||
| 55 | CXOU J122426.7071736 | 12 24 26.76 | 7 17 36.6 | 90.0 | 4.841.14 | 4.25 | 19.75 | |||
| 56 | CXOU J122429.0071729 | 12 24 29.03 | 7 17 29.8 | 94.7 | 5.731.24 | 4.62 | 23.39 | |||
| 57 | CXOU J122431.8072028 | 12 24 31.85 | 7 20 28.2 | 99.9 | 2.810.88 | 3.20 | 11.50 | |||
| 58 | CXOU J122425.1071734 | 12 24 25.13 | 7 17 34.9 | 100.4 | 10.921.70 | 6.42 | 44.58 | |||
| 59 | CXOU J122424.0071745 | 12 24 24.04 | 7 17 45.1 | 100.7 | 3.350.96 | 3.49 | 13.67 | d,f | ||
| 60 | CXOU J122431.1071724 | 12 24 31.18 | 7 17 24.7 | 108.2 | 7.621.42 | 5.35 | 31.11 |
| TABLE 1— | ||||||||||
|---|---|---|---|---|---|---|---|---|---|---|
| Src. | R.A. | Dec. | Count Rate | |||||||
| No. | Name | (h:m:s) | (::) | () | ( s-1) | SNR | H21 | H31 | Notes | |
| (1) | (2) | (3) | (4) | (5) | (6) | (7) | (8) | (9) | (10) | (11) |
| 61 | CXOU J122424.9072046 | 12 24 24.92 | 7 20 46.9 | 114.4 | 2.870.95 | 3.03 | 11.73 | |||
| 62 | CXOU J122435.9071925 | 12 24 35.93 | 7 19 25.9 | 116.3 | 3.821.03 | 3.72 | 15.59 | |||
| 63 | CXOU J122420.7071938 | 12 24 20.72 | 7 19 38.0 | 117.2 | 6.591.34 | 4.93 | 26.93 | |||
| 64 | CXOU J122421.6071757 | 12 24 21.62 | 7 17 57.6 | 118.8 | 3.941.04 | 3.80 | 16.10 | |||
| 65 | CXOU J122435.3071805 | 12 24 35.30 | 7 18 05.4 | 119.9 | 10.811.70 | 6.34 | 44.13 | |||
| 66 | CXOU J122425.8071706 | 12 24 25.81 | 7 17 06.1 | 123.2 | 3.410.96 | 3.54 | 13.92 | |||
| 67 | CXOU J122423.3071720 | 12 24 23.35 | 7 17 20.6 | 126.4 | 3.600.99 | 3.62 | 14.70 | |||
| 68 | CXOU J122435.8071806 | 12 24 35.88 | 7 18 06.2 | 127.2 | 3.871.04 | 3.73 | 15.82 | |||
| 69 | CXOU J122426.3071653 | 12 24 26.39 | 7 16 53.2 | 133.5 | 48.433.54 | 13.67 | 197.75 | |||
| 70 | CXOU J122426.7071650 | 12 24 26.70 | 7 16 50.2 | 135.6 | 8.211.47 | 5.58 | 33.52 | |||
| 71 | CXOU J122420.1071739 | 12 24 20.18 | 7 17 39.4 | 146.8 | 16.462.08 | 7.89 | 67.20 | |||
| 72 | CXOU J122437.0071757 | 12 24 37.08 | 7 17 57.3 | 147.1 | 3.591.01 | 3.57 | 14.65 | |||
| 73 | CXOU J122423.9071651 | 12 24 23.95 | 7 16 51.0 | 147.4 | 5.061.17 | 4.34 | 20.66 | |||
| 74 | CXOU J122438.4071902 | 12 24 38.46 | 7 19 02.8 | 151.8 | 4.671.21 | 3.86 | 19.05 | |||
| 75 | CXOU J122419.2072019 | 12 24 19.25 | 7 20 19.3 | 153.9 | 2.880.90 | 3.20 | 11.78 | |||
| 76 | CXOU J122418.0071839 | 12 24 18.01 | 7 18 39.1 | 154.4 | 3.360.97 | 3.46 | 13.70 | |||
| 77 | CXOU J122418.0071803 | 12 24 18.04 | 7 18 03.5 | 163.6 | 3.450.98 | 3.52 | 14.08 | |||
| 78 | CXOU J122422.1071646 | 12 24 22.19 | 7 16 46.1 | 164.7 | 9.951.62 | 6.14 | 40.63 | |||
| 79 | CXOU J122434.9072116 | 12 24 34.93 | 7 21 16.1 | 165.4 | 2.860.95 | 3.02 | 11.67 | |||
| 80 | CXOU J122423.4072136 | 12 24 23.44 | 7 21 36.5 | 168.7 | 2.770.91 | 3.03 | 11.29 | |||
| 81 | CXOU J122436.4071706 | 12 24 36.47 | 7 17 06.7 | 169.2 | 3.340.96 | 3.49 | 13.63 | |||
| 82 | CXOU J122417.9071741 | 12 24 17.91 | 7 17 41.4 | 174.7 | 4.851.15 | 4.23 | 19.78 | |||
| 83 | CXOU J122417.8071715 | 12 24 17.80 | 7 17 15.6 | 189.5 | 7.111.38 | 5.17 | 29.02 | |||
| 84 | CXOU J122436.6072129 | 12 24 36.65 | 7 21 29.3 | 191.8 | 9.431.81 | 5.22 | 38.51 | |||
| 85 | CXOU J122425.1072211 | 12 24 25.19 | 7 22 11.2 | 192.9 | 3.331.03 | 3.24 | 13.59 | |||
| 86 | CXOU J122438.3072107 | 12 24 38.31 | 7 21 07.0 | 193.7 | 28.872.88 | 10.01 | 117.88 | g | ||
| 87 | CXOU J122427.2072231 | 12 24 27.28 | 7 22 31.2 | 207.9 | 8.821.87 | 4.72 | 36.03 | |||
| 88 | CXOU J122414.7072004 | 12 24 14.74 | 7 20 04.9 | 210.3 | 37.473.20 | 11.72 | 153.01 | d | ||
| 89 | CXOU J122424.8072229 | 12 24 24.83 | 7 22 29.4 | 211.9 | 4.531.35 | 3.36 | 18.48 | |||
| 90 | CXOU J122441.0072047 | 12 24 41.05 | 7 20 47.8 | 216.9 | 4.951.38 | 3.59 | 20.21 | |||
| 91 | CXOU J122438.9071625 | 12 24 38.96 | 7 16 25.8 | 224.3 | 12.211.84 | 6.65 | 49.87 | |||
| 92 | CXOU J122438.9072152 | 12 24 38.93 | 7 21 52.4 | 231.6 | 7.801.61 | 4.83 | 31.85 | |||
| 93 | CXOU J122425.4072258 | 12 24 25.42 | 7 22 58.7 | 238.6 | 7.471.62 | 4.60 | 30.48 | |||
| 94 | CXOU J122435.9071533 | 12 24 35.94 | 7 15 33.3 | 239.6 | 5.701.30 | 4.39 | 23.26 | |||
| 95 | CXOU J122420.8072237 | 12 24 20.84 | 7 22 37.0 | 240.1 | 6.851.55 | 4.41 | 27.96 | |||
| 96 | CXOU J122440.9072204 | 12 24 40.90 | 7 22 04.1 | 260.6 | 55.423.99 | 13.88 | 226.30 | |||
| 97 | CXOU J122437.9072311 | 12 24 37.91 | 7 23 11.0 | 285.9 | 22.692.74 | 8.27 | 92.64 | d | ||
| 98 | CXOU J122419.9072332 | 12 24 19.91 | 7 23 32.6 | 296.1 | 3.831.27 | 3.02 | 15.64 | d | ||
| 99 | CXOU J122416.0072324 | 12 24 16.03 | 7 23 24.3 | 317.7 | 36.754.33 | 8.65 | 150.05 | c | ||
| Src. | R.A. | Dec. | Count Rate | |||||||
|---|---|---|---|---|---|---|---|---|---|---|
| No. | Name | (h:m:s) | (::) | () | ( s-1) | SNR | H21 | H31 | Notes | |
| (1) | (2) | (3) | (4) | (5) | (6) | (7) | (8) | (9) | (10) | (11) |
| 1 | CXOU J122524.0181127 | 12 25 24.06 | 18 11 27.7 | 1.8 | 22.792.55 | 8.93 | 89.66 | b | ||
| 2 | CXOU J122523.9181121 | 12 25 23.99 | 18 11 21.7 | 4.2 | 16.442.15 | 7.63 | 64.71 | |||
| 3 | CXOU J122523.9181131 | 12 25 23.90 | 18 11 31.1 | 5.5 | 10.901.79 | 6.09 | 42.88 | |||
| 4 | CXOU J122523.5181126 | 12 25 23.58 | 18 11 26.7 | 6.6 | 11.871.88 | 6.33 | 46.71 | |||
| 5 | CXOU J122524.5181134 | 12 25 24.54 | 18 11 34.9 | 11.5 | 11.971.84 | 6.52 | 47.11 | |||
| 6 | CXOU J122523.6181136 | 12 25 23.60 | 18 11 36.4 | 12.2 | 5.101.24 | 4.12 | 20.06 | |||
| 7 | CXOU J122523.7181139 | 12 25 23.75 | 18 11 39.9 | 14.6 | 9.641.66 | 5.79 | 37.92 | |||
| 8 | CXOU J122524.7181141 | 12 25 24.70 | 18 11 41.0 | 17.7 | 11.311.79 | 6.33 | 44.48 | |||
| 9 | CXOU J122525.6181141 | 12 25 25.65 | 18 11 41.5 | 27.7 | 5.241.25 | 4.20 | 20.63 | |||
| 10 | CXOU J122522.8181053 | 12 25 22.84 | 18 10 53.6 | 36.5 | 7.191.43 | 5.01 | 28.28 | |||
| 11 | CXOU J122524.8181048 | 12 25 24.83 | 18 10 48.7 | 38.9 | 3.320.99 | 3.36 | 13.08 | |||
| 12 | CXOU J122524.9181205 | 12 25 24.95 | 18 12 05.7 | 41.8 | 27.912.76 | 10.12 | 109.83 | |||
| 13 | CXOU J122526.9181149 | 12 25 26.94 | 18 11 49.7 | 47.7 | 24.712.59 | 9.55 | 97.24 | |||
| 14 | CXOU J122520.5181121 | 12 25 20.53 | 18 11 21.8 | 50.1 | 2.740.91 | 3.01 | 10.78 | |||
| 15 | CXOU J122522.1181043 | 12 25 22.15 | 18 10 43.5 | 50.3 | 17.382.22 | 7.82 | 68.40 | |||
| 16 | CXOU J122520.6181052 | 12 25 20.69 | 18 10 52.5 | 58.3 | 2.800.93 | 3.01 | 11.03 | |||
| 17 | CXOU J122527.4181157 | 12 25 27.47 | 18 11 57.8 | 58.4 | 10.081.67 | 6.03 | 39.65 | |||
| 18 | CXOU J122519.7181125 | 12 25 19.75 | 18 11 25.0 | 61.2 | 4.491.14 | 3.92 | 17.66 | |||
| 19 | CXOU J122527.2181215 | 12 25 27.29 | 18 12 15.4 | 67.8 | 7.241.56 | 4.65 | 28.48 | |||
| 20 | CXOU J122521.7181026 | 12 25 21.72 | 18 10 26.3 | 68.1 | 9.071.57 | 5.79 | 35.69 | |||
| 21 | CXOU J122528.3181205 | 12 25 28.35 | 18 12 05.7 | 73.2 | 6.111.40 | 4.35 | 24.04 | |||
| 22 | CXOU J122521.6181232 | 12 25 21.68 | 18 12 32.1 | 74.2 | 3.541.01 | 3.51 | 13.91 | |||
| 23 | CXOU J122518.4181137 | 12 25 18.42 | 18 11 37.0 | 80.9 | 14.541.98 | 7.36 | 57.22 | |||
| 24 | CXOU J122519.8181235 | 12 25 19.82 | 18 12 35.3 | 91.8 | 3.611.01 | 3.59 | 14.19 | |||
| 25 | CXOU J122520.7180955 | 12 25 20.72 | 18 09 55.7 | 101.8 | 4.651.14 | 4.09 | 18.29 | |||
| 26 | CXOU J122520.3181301 | 12 25 20.32 | 18 13 01.7 | 109.5 | 40.733.37 | 12.10 | 160.27 | |||
| 27 | CXOU J122525.5180936 | 12 25 25.51 | 18 09 36.8 | 111.1 | 3.821.02 | 3.73 | 15.02 | |||
| 28 | CXOU J122531.6181051 | 12 25 31.68 | 18 10 51.8 | 114.1 | 5.661.26 | 4.49 | 22.26 | |||
| 29 | CXOU J122527.4181314 | 12 25 27.48 | 18 13 14.1 | 118.8 | 3.330.98 | 3.38 | 13.09 | |||
| 30 | CXOU J122521.6180929 | 12 25 21.61 | 18 09 29.0 | 121.9 | 21.552.39 | 9.01 | 84.78 | |||
| 31 | CXOU J122518.1181255 | 12 25 18.19 | 18 12 55.7 | 122.5 | 2.680.87 | 3.06 | 10.55 | |||
| 32 | CXOU J122516.8181234 | 12 25 16.82 | 18 12 34.3 | 123.5 | 8.371.51 | 5.53 | 32.93 | |||
| 33 | CXOU J122530.4181311 | 12 25 30.41 | 18 13 11.8 | 139.5 | 12.511.88 | 6.65 | 49.24 | |||
| 34 | CXOU J122522.2181344 | 12 25 22.22 | 18 13 44.0 | 140.5 | 7.371.46 | 5.04 | 28.99 | |||
| 35 | CXOU J122515.0181018 | 12 25 15.01 | 18 10 18.8 | 145.1 | 4.201.11 | 3.77 | 16.52 | |||
| 36 | CXOU J122513.8181248 | 12 25 13.80 | 18 12 48.9 | 167.9 | 2.700.88 | 3.05 | 10.62 | |||
| 37 | CXOU J122517.6181350 | 12 25 17.64 | 18 13 50.2 | 170.7 | 22.952.61 | 8.79 | 90.29 | |||
| 38 | CXOU J122517.1181346 | 12 25 17.17 | 18 13 46.8 | 171.6 | 156.447.25 | 21.60 | 615.56 | d,e | ||
| 39 | CXOU J122512.9181016 | 12 25 12.98 | 18 10 16.2 | 172.3 | 16.002.06 | 7.76 | 62.94 | |||
| 40 | CXOU J122528.0181417 | 12 25 28.06 | 18 14 17.2 | 180.7 | 3.561.04 | 3.42 | 14.08 | |||
| 41 | CXOU J122518.1180841 | 12 25 18.12 | 18 08 41.5 | 184.8 | 8.192.66 | 3.09 | 32.24 | c | ||
| 42 | CXOU J122536.5181002 | 12 25 36.58 | 18 10 02.6 | 197.2 | 6.431.37 | 4.70 | 25.31 | |||
| 43 | CXOU J122511.1181006 | 12 25 11.18 | 18 10 06.1 | 199.9 | 2.700.89 | 3.05 | 10.64 | |||
| 44 | CXOU J122528.6180808 | 12 25 28.66 | 18 08 08.6 | 208.0 | 3.200.94 | 3.39 | 12.59 | |||
| 45 | CXOU J122523.3180758 | 12 25 23.33 | 18 07 58.1 | 208.0 | 22.724.02 | 5.66 | 89.40 | c | ||
| 46 | CXOU J122538.8181137 | 12 25 38.83 | 18 11 37.1 | 211.1 | 5.711.41 | 4.06 | 22.48 | |||
| 47 | CXOU J122522.4181457 | 12 25 22.48 | 18 14 57.1 | 212.3 | 15.342.27 | 6.75 | 60.36 | |||
| 48 | CXOU J122538.7181205 | 12 25 38.75 | 18 12 05.1 | 213.2 | 6.641.53 | 4.33 | 26.13 | d | ||
| 49 | CXOU J122512.8181409 | 12 25 12.80 | 18 14 09.3 | 228.8 | 20.542.72 | 7.55 | 80.83 | |||
| 50 | CXOU J122508.0181229 | 12 25 08.00 | 18 12 29.9 | 237.3 | 3.751.11 | 3.37 | 14.73 | |||
| 51 | CXOU J122540.6181224 | 12 25 40.60 | 18 12 24.6 | 243.2 | 10.991.94 | 5.67 | 43.24 | |||
| 52 | CXOU J122509.2181336 | 12 25 09.27 | 18 13 36.7 | 247.8 | 9.672.13 | 4.55 | 38.07 | c | ||
| 53 | CXOU J122506.1181045 | 12 25 06.15 | 18 10 45.8 | 258.0 | 12.671.95 | 6.49 | 49.83 | d | ||
| 54 | CXOU J122505.9181158 | 12 25 05.91 | 18 11 58.9 | 260.5 | 9.251.67 | 5.53 | 36.41 | g | ||
| 55 | CXOU J122504.7181133 | 12 25 04.74 | 18 11 33.5 | 275.1 | 13.211.98 | 6.66 | 51.98 | |||
| 56 | CXOU J122543.4181048 | 12 25 43.44 | 18 10 48.3 | 278.9 | 8.822.98 | 3.02 | 34.69 | c | ||
| 57 | CXOU J122503.7181124 | 12 25 03.70 | 18 11 24.1 | 289.9 | 14.612.52 | 5.82 | 57.48 | c,d | ||
| 58 | CXOU J122546.0181302 | 12 25 46.05 | 18 13 02.9 | 328.3 | 12.112.49 | 4.86 | 47.65 |
| Hard Component | Soft Component (mekal) | |||||||||||
|---|---|---|---|---|---|---|---|---|---|---|---|---|
| Model | or | Abund. | ) | |||||||||
| Row | Origin | Region | ( cm-2) | (keV) | (aaSources near the center may be confused with nearby sources, making their positions, fluxes, and extents uncertain. ) | (keV) | (solar) | (aaUnits are ergs cm-2 s-1 in 0.3–10 keV band. ) | Counts | /dof | ||
| 1 | Sources | 1 | (1.63) | Bremss | 2.06 | (0.0) | 901 | 41.7/33=1.26 | ||||
| 2 | Sources | 1 | 0.00 [3.66] | Bremss | 2.05 | (0.0) | 901 | 40.6/32=1.27 | ||||
| 3bbSource is noticeably more extended than PSF. | Sources | 1 | (1.63) | Power | 2.35 | (0.0) | 901 | 38.6/33=1.17 | ||||
| 4 | Sources | 1 | 0.00 [9.74] | Power | 2.34 | (0.0) | 901 | 38.4/32=1.20 | ||||
| 5 | Sources | (1.63) | Power | (1.67) | 2.34 | (0.0) | 887 | 38.9/33=1.18 | ||||
| 6 | Sources | (1.63) | Power | 2.47 | (0.0) | 887 | 36.0/32=1.13 | |||||
| 7 | Sources | Power | 2.58 | (0.0) | 887 | 34.1/31=1.10 | ||||||
| 8 | Sources | Field | (1.63) | Power | (1.67) | 6.94 | (0.0) | 2660 | 85.6/89=0.96 | |||
| 9 | Sources | Field | (1.63) | Power | 7.28 | (0.0) | 2660 | 79.8/88=0.91 | ||||
| 10 | Sources | Field | 3.04 [8.76] | Power | 7.32 | (0.0) | 2660 | 79.6/87=0.92 | ||||
| 11ccSource is at the edge of the S3 detector, and flux is uncertain due to large exposure correction. | Unresolved | 1 | (1.63) | (0.0) | 1.59 | 935 | 71.3/48=1.49 | |||||
| 12ccThe energy range for this spectra excludes 1.6 - 1.9 keV. | Unresolved | 1 | 0.00 [13.11] | (0.0) | 1.53 | 935 | 71.1/47=1.51 | |||||
| 13b,cb,cfootnotemark: | Unresolved | 1 | (1.63) | Power | (1.67) | 1.30 | 0.35 [0.08] | 0.68 | 935 | 34.4/47=0.73 | ||
| 14ccThe energy range for this spectra excludes 1.6 - 1.9 keV. | Unresolved | (1.63) | Power | (1.67) | 1.51 | (0.56) | (0.35) | 0.84 | 1155 | 195.2/170=1.15 | ||
| 15ccThe energy range for this spectra excludes 1.6 - 1.9 keV. | Unresolved | (1.63) | Power | (1.67) | 0.00 [0.34] | 1.77 | 1155 | 158.6/168=0.94 | ||||
| 16b,cb,cfootnotemark: | Total | 1 | (1.63) | Power | (1.67) | 3.66 | (0.56) | (0.35) | 0.75 | 1831 | 70.7/72=0.98 | |
| 17ccThe energy range for this spectra excludes 1.6 - 1.9 keV. | Total | 1 | (1.63) | Power | (1.67) | 3.56 | 0.09 [0.00] | 1.09 | 1831 | 67.1/70=0.96 | ||
| 18ccThe energy range for this spectra excludes 1.6 - 1.9 keV. | Total | 1 | (1.63) | Power | 3.49 | 0.05 [0.00] | 1.34 | 1831 | 67.0/69=0.97 | |||
| 19ccThe energy range for this spectra excludes 1.6 - 1.9 keV. | Total | 1 | (1.63) | Bremss | 12.22 [] | 3.13 | 0.04 [0.26] | 1.64 | 1831 | 66.6/69=0.96 | ||
| 20ccThe energy range for this spectra excludes 1.6 - 1.9 keV. | Total | 3 | (1.63) | Power | 5.55 | 0.03 [0.01] | 3.32 | 3820 | 199.0/220=0.90 | |||
| 21ccThe energy range for this spectra excludes 1.6 - 1.9 keV. | Total | 3 | (1.63) | Bremss | 9.63 [3.36] | 4.74 | 3.90 | 3820 | 198.8/220=0.90 | |||
Note. — The units for are ergs s-1 in the 0.3–10 keV band.
Note. — The notation is the same as in Table 1.
| Hard Component | Soft Component (mekal) | |||||||||||
|---|---|---|---|---|---|---|---|---|---|---|---|---|
| Model | or | Abund. | ) | |||||||||
| Row | Origin | Region | ( cm-2) | (keV) | (aafootnotemark: ) | (keV) | (solar) | (aafootnotemark: ) | Counts | /dof | ||
| 1 | Sources | 2 | (2.45) | Bremss | 2.47 | (0.0) | 921 | 30.3/33=0.92 | ||||
| 2 | Sources | 2 | 0.00 [6.01] | Bremss | 2.47 | (0.0) | 921 | 29.5/32=0.92 | ||||
| 3bbThe adopted best-fit model for this emission. | Sources | 2 | (2.45) | Power | 2.73 | (0.0) | 921 | 29.2/33=0.89 | ||||
| 4 | Sources | 2 | 2.43 [12.63] | Power | 2.73 | (0.0) | 921 | 29.2/32=0.91 | ||||
| 5 | Sources | Field | (2.45) | Power | (1.52) | 6.08 | (0.0) | 2055 | 51.4/71=0.72 | |||
| 6 | Sources | Field | (2.45) | Power | 5.91 | (0.0) | 2055 | 50.0/70=0.71 | ||||
| 7 | Sources | Field | 0.00 [4.73] | Power | 5.87 | (0.0) | 2055 | 48.9/69=0.71 | ||||
| 8ccfootnotemark: | Unresolved | 2 | (2.45) | 5.68 | 2620 | 150.4/129=1.17 | ||||||
| 9ccfootnotemark: | Unresolved | 2 | 0.00 [4.38] | 4.99 | 2620 | 148.9/128=1.16 | ||||||
| 10ccfootnotemark: | Unresolved | 2 | (2.45) | Power | (1.52) | 1.57 | 7.73 [0.13] | 4.12 | 2620 | 122.7/128=0.96 | ||
| 11b,cb,cfootnotemark: | Unresolved | 2 | (2.45) | Power | (1.52) | 1.47 | (0.50) | 4.61 | 2620 | 123.0/129=0.95 | ||
| 12ccfootnotemark: | Unresolved | (2.45) | Power | (1.52) | 0.89 | (0.28) | (0.50) | 3.31 | 1966 | 193.8/195=0.99 | ||
| 13ccfootnotemark: | Unresolved | (2.45) | Power | (1.52) | 0.80 | (0.50) | 2.98 | 1966 | 193.2/194=1.00 | |||
| 14b,cb,cfootnotemark: | Total | 2 | (2.45) | Power | (1.52) | 4.32 | (0.28) | (0.50) | 4.73 | 3482 | 139.4/146=0.95 | |
| 15ccfootnotemark: | Total | 2 | (2.45) | Power | (1.52) | 4.19 | (0.50) | 4.14 | 3482 | 138.1/145=0.95 | ||
| 16ccfootnotemark: | Total | 2 | (2.45) | Power | 4.53 | (0.50) | 4.02 | 3482 | 136.0/144=0.94 | |||
| 17ccfootnotemark: | Total | 2 | (2.45) | Brem | 45.00 [] | 4.39 | (0.50) | 4.01 | 3482 | 136.2/144=0.95 | ||
| 18ccfootnotemark: | Total | 3 | (2.45) | Power | 5.69 | (0.50) | 5.06 | 4452 | 245.0/237=1.03 | |||
| 19ccfootnotemark: | Total | 3 | (2.45) | Brem | 58.57 [] | 5.53 | (0.50) | 5.08 | 4452 | 245.0/237=1.03 | ||
Note. — Notation is the same as Table 3.