Testing the binary black hole paradigm through the Fe K line profile: application to 3C 273
Abstract
We propose the study of long-term variations in the Fe K line profile as a discriminator for binary black hole (BH) systems. The existence of a binary BH in the center of an active galaxy will produce a particular signature in the evolution of the line profile, as a result of disk precession. This signature is a periodic variation of the position of the blue edge of the profile, accompanied by periodic change of its intensity. We show that detection of the former is clearly within the observational capabilities of planned X-ray missions. Detecting a periodic variation of line profiles would provide the first direct evidence for precessing discs in active galactic nuclei, as opposed to the existing evidence supporting only the precession of jets. We apply these ideas to 3C 273.
1 Introduction
The fact that many galaxies harbor supermassive BHs (SBHs) and that galaxies often merge imply that massive binary systems might exist at the core of some extragalactic objects (e.g. Begelman et al. 1980; Valtaoja et al. 1989; Yu 2002). These systems are expected to be stable for timescales of the order of the Hubble time if they are not subject to external perturbations (Valtaoja et al. 1989). SBH binaries can manifest themselves in Active Galactic Nuclei (AGNs) through remarkable periodic signals in the lightcurves at different wavelengths (e.g. Sillanpää et al. 1988; Fan et al. 2001), the presence of wiggling and precessing jets (e.g. Roos 1988, Kaastra & Roos 1992), or periodic morphological changes at milliarcsec scales (e.g. Abraham & Romero 1999). Here we propose an alternative test for binary BHs in AGNs based on high sensitivity X-ray spectroscopy of the Fe K line.
2 Jet and disc precession in 3C 273
3C 273 was first identified as a quasar at redshift by Schmidt (1963). Detailed observations of this object have been performed for almost 40 years, including simultaneous measurements of its spectrum from radio to -ray energies (e.g. Lichti et al. 1995) and multiwavelength variability studies (e.g. von Montigny et al. 1997). At VLBI scales the source presents a one-sided jet that extends up to milliarcsec from the core at 5 GHz (Zensus et al. 1988). The absence of a counterjet and the superluminal speeds of different components suggest a small angle with respect to the line of sight. Zensus et al. (1988) estimate that this angle should be smaller than , where is such that the Hubble constant is km s-1 Mpc-1.
Abraham & Romero (1999) have used all available VLBI data of superluminal components in 3C 273 to determine the kinematic evolution of the inner jet. The different velocities and position angles at the ejection time of the various well-monitored components are consistent with the existence of a precessing inner jet in the quasar. Fits of the VLBI data suggest a period of precession of years in the observer’s frame. For the jet would have a bulk Lorentz factor and precess within a cone of half-opening angle , forming a mean viewing angle of . The Doppler factor should vary between 2.8 and 9.4 because of the changing viewing conditions, resulting in periodic variations in the lightcurve, as have been found by Fan et al. (2001) at optical wavelengths. Romero et al. (2000) have explored the dynamical origin of the jet precession, suggesting that it might be induced by the precession of the accretion disk, which, in turn, would be the result of the external torque of a companion supermassive object. The recent detection of new superluminal components in 3C 273 shows ejection angles that are in good agreement with the predictions of the binary BH model (Krichbaum et al. 2001).
The precession of the accretion disk in 3C 273 will also affect the intensity and shape of the line profiles as seen in the observer’s frame. The Fe K line, for instance, has been recently detected by Yaqoob & Serlemitsos (2000) using ASCA and RXTE observations. The line is as broad as those observed in Seyfert 1 galaxies, with a mean Gaussian width of keV, corresponding to a FWHM of . The intrinsic 2–10 keV luminosity is in the range – erg s-1.
3 A line profile diagnosis


We use the ray-tracing technique to calculate the profile of the Fe K line (Fabian et al. 1989; Yu & Lu 2000, Lu & Yu 2001 and references therein). The parameters of the simulation are the inclination angle of the normal relative to the line of sight of the observer (), the inner disk radius (, assumed constant during the period in which the line variation is studied), the outer disk radius (), and the power-law index characterizing the surface emissivity of line photons, which we assume is proportional to . We also assume that the disk extends down to the innermost marginal stable orbit (; for a Schwarzschild BH and for a Kerr BH with spin ), and that the outer part of the precessing disk is at , where is the gravitational radius. We adopt for our calculations, which is the average emissivity exponent index obtained from the fitting of the Fe K line for a sample of AGNs observed by ASCA (Nandra et al. 1997). Since is a positive number, the line emission is dominated by the innermost region with sizes of a few to tens of gravitational radii. The line profile is not sensitive to the chosen outer radius. Note that if the line profile is different, for example due to disk ionization, the overall arguments will continue to apply under the only assumption that the intrinsic line emission mechanism does not change along the timescale relevant for disk precession.
The line profile depends on the mass through the combination ; it is determined by the Doppler shift due to Keplerian motion of the disk material and the general relativistic effects.555If we choose the same inner and outer radius of the emission region in units of the Schwarzschild radius, the same inclination angle and the same emissivity law, we would predict the same line profile whatever the BH mass is. Romero et al.’s (2000) dynamical modelling of 3C 273 explains the jet precession by a tidal perturbation on the accretion disk due to a secondary BH. Different BH masses are obtained with somewhat different models. However, for the observational test we are proposing, it does not matter what the BH mass is, since we only need to know the changes of the disk inclination angle in order to compute the profile evolution.
Abraham & Romero (1999) have found that the half opening-angle of the precessing jet (assumed to be normal to the disk) in 3C 273 is about 3.9∘, thus the disk inclination angle should slowly change periodically from to . The angle is not well-known. We adopt here an average value in accordance with the best fit for by Abraham & Romero (1999). This value is in good agreement with the estimates by Zensus et al. (1988), which are derived from jet observations. However, both the model of the UV band spectrum in 3C 273 by Kriss et al. (1999) and the spectral fits of the Fe K in this object by Yaqoob & Serlemitsos (2000) suggest a far larger value of . This value seems to contradict the fact that 3C 273 is a blazar-like object and a superluminal source (a behavior that requires a close alignment between the jet and the line of sight, i.e. a nearly face-on disk). Notwithstanding, we have also calculated the Fe K profile evolution for a disk with . We are assuming that only one of the BHs has a significant accretion disc. This may well not be the case, and a larger inclination angle could result in the –probably unlikely– case of the jetless BH producing the profile.
The results of our calculations are shown in Fig. 1: the blue edge of the Fe K line moves down to a lower energy as the inclination angle decreases from 10∘ to 6∘, then moves back as the inclination angle increases, and finally extends to a higher energy when the inclination angle goes to 14∘. The total shift in energy of the peak of the line, along a span of 8 years, is 0.1 keV (at keV). On the same timescale, the variation of the intensity is %. The same kind of behavior can be seen in the bottom panel of Fig 1: a shift in energy of 0.4 keV at keV and an intensity change of %. However, note that if the relation between continuum and line emission is not exactly known, we can not put much emphasis in observing line intensity variations as a signature of disc precession.
4 Feasibility
Although the Fe K emission line in 3C 273 is relatively weak, and the effect produced by the disc precession is small, this would be detectable by a high-throughput high-spectral resolution mission such as XEUS or Constellation-X. XEUS is a mission currently under study by the European Space Agency (ESA) and Japan, with an expected launch around 2015. See the XEUS baseline mission profile in Bleeker et al. (2000) and the XEUS science case in Arnaud et al. (2000). For the purposes of observing the Fe line at high resolution, the most appropriate of the foreseen instruments is the Narrow-Field 2 instrument, which is based on Transition Edge Sensors (see Hoevers & Verhoeve 2003). We have used the response matrices given in the XEUS web page at ESA.
Simulations have been performed using the parameters found by Yaqoob & Serlemitsos (2000). The underlying continuum is described by a single power law with , to which an Fe line, according to the above profiles, has been added. The equivalent width of the emission line (for which there are reported values from 100 to 300 eV) is assumed to be 200 eV. Galactic photoelectric absorption with column density cm-2 has been applied. The total unabsorbed 2–10 keV flux is assumed to be , which corresponds to a luminosity at of for a cosmology (, and ).
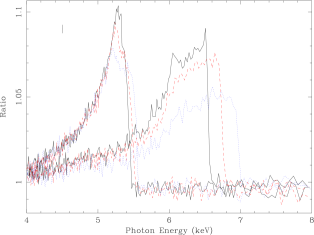
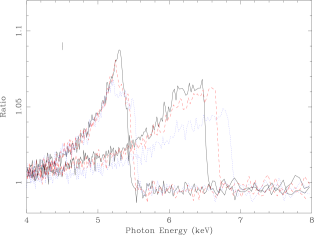
Simulations have been conducted with xspec (Arnaud 1996), version 11.2.0. 3C 273 would have a count rate of cts/s in the XEUS Narrow-field 2 detector, but since the specification is that it should be able to read up to 30 kHz, pile-up should not pose an unsolvable problem for this observation. If necessary, a thick filter suppressing soft X-ray photons (which are not interesting for this project) will solve this problem. All simulations were done for 100 ks and without any background. Counts were grouped on bins containing at least one million counts. We simulated one spectrum for each of the curves in Fig. 1 and fit a power-law only to the range 2–4 keV and 8–12 keV. Fig. 2 –top panels– (for a Schwarzschild and a Kerr case) display the ratio of the data to the absorbed power law model. The differences in the blue edge of the emission lines are readily apparent.
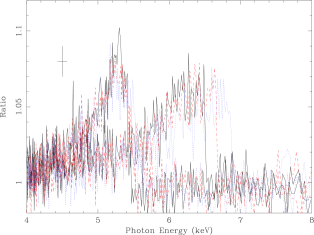
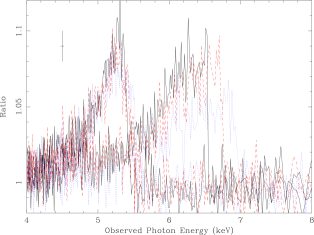
Similarly, we have also checked whether the Constellation-X mission would also be able to detect such differences with the “2 eV” calorimeter (i.e. a calorimeter with 2 eV spectral resolution) and with a similar integration time. For review articles on the science and instruments of Constellation-X see Trümper and Tananbaum (2003). Although its effective area would be a factor of several smaller than that of XEUS at these energies, the effect is still detectable (although not so visually obvious) with a similar exposure time, see Fig. 2 –bottom panels–. The only difference with respect to the XEUS simulations presented in the top panels of the same figure is that counts are grouped in bins containing counts as opposed to count bins for the former case.
To further illustrate the capabilities of both missions to detect the drift in the blue edge of the lines, we have performed a traditional fitting exercise to the simulated X-ray spectra. We have used model lines with Kerr profiles and various inclination angles, and then fitted the grouped spectra in the 2–12 keV band according to the above-explained grouping criteria. The fitting model is chosen as the sum of a power law, a maximally rotating Kerr, and a Schwarzschild BH line profiles, in order to partially mimic our likely limited knowledge on the BH spin. The inclination of the disk is left free but the same for both line components, whereas the intensities of both line components are independently left as free parameters too. Models are generated by xspec by linearly interpolating inclination angles over our step models. Since we are interested just in showing further evidence for the detectability of the periodic variation of the blue edge of the line, this approach is enough for illustrative purposes. Results of the fitting exercise are presented in Table 1. For small inclination angles, the proposed Constellation-X observations would deliver 90% confidence measurements of the angle within , while variations of per year are expected. The situation is much more favorable with XEUS, where the inclination angle can be measured with a 90% confidence within . In the high inclination situation, the errors are much smaller and the blue edge variations more easily detectable for both telescopes.
| [CON-X] | [XEUS] | |
|---|---|---|
| 8.0 | ||
| 10.0 | ||
| 12.0 | ||
| 58.0 | ||
| 60.0 | ||
| 62.0 |
Calibration, as in any other X-ray observation, needs to be known to high precision. In order to detect the Fe line itself the effective area needs to be known to better than 10%, whereas to detect differences between the blue edge of the various profiles shown in Fig. 2, it needs to be better than a few per cent. Furthermore, the energy scale needs to be known to within less than 10 eV (the drift corresponds to per degree). It is expected that both the Constellation-X and XEUS high spectral resolution instruments will have a well calibrated and monitored energy scale to a level at least commensurate with the spectral resolution of a few eV. Under these assumptions, the variation of the blue edge of the line can be precisely tracked as it changes in time because of the disc precession, ultimately probing the innermost regions of the galaxy and supporting or disproving a binary BH interpretation for 3C 273.
5 Discussion
Short term variability (on time scales of about s) of both the intensity and shape profile of the Fe K line are an important feature revealed by observations of some Seyfert galaxies (Iwasawa et al. 1996; Nandra et al. 1999). This variability may be produced by X-ray flares above the accretion disk. There could also exist similar variability in the profile of the Fe K line in 3C 273. However, this component, if present, will be chaotic, not producing a periodic long-term variation as predicted here for the precession. It is also true that the emissivity law could be a function of azimuthal angle. However, there is no reliable model on the production mechanism for the assumed X-ray flares that gives their possible distribution or the dependence of line emissivity on the azimuthal angle that we are aware of. One could arbitrarily assume a line emissivity dependence on azimuthal angle, but with current information this would be just as good as assuming a uniform distribution.
The essential point of this research is not to produce a fully testable model for the Fe K line, but rather to look for an unambiguous signature of disk precession in the line profile evolution. The drift of the blue edge of the line (averaged or properly sampled over, at least, an orbital period) can only be due to disk precession if, whatever the emission mechanism is (including its possible azimuthal dependence), it does not change in time. The relevant point here is whether or not we sample an azimuth-averaged situation, since sampling different phases could lead to distinct line profiles. But this can be reliably done, whatever the emission properties, with a properly tailored observing strategy. Each visit to the target should represent an azimuth-averaged observation. For 3C273, with mass , the orbital timescale at 10 is a few times s, with the observed line photons dominated by those coming from the inner region (with or less). An exposure of several days on 3C273 would then average any putative dependence of the line emissivity law on azimuthal angle. Also, a few 10–50 ks snapshots spread over a few orbital periods can be equally used for averaging any inhomogeneity over. Note that 3C273 is a very likely calibration target for any X-ray mission. This means that these rather demanding observations could be conducted anyway. Therefore, several observations over a total span of the order of the precession period ( yr) might reveal the systematic change of the line profile associated with the presence of a SBH companion. The detection of the predicted changes in the line profile would provide direct evidence of disk precession, which can be considered as even stronger evidence for a massive companion than the evidence from the jet precession (since instabilities in the jet can in some cases be responsible for twisting, e.g. Romero 1995).
Acknowledgments
The work of DFT was performed under the auspices of the U.S. DOE–NNSA by U. of California LLNL under contract No. W-7405-Eng-48. GER is supported by PICT 03-04881, PIP 0438/98, and F. Antorchas. XB acknowledges partial financial support by the Spanish Ministerio de Ciencia y Tecnología, through project AYA2000-1690. DFT acknowledges C. Mauche for insightful comments. Two anonymous Referees are also acknowledged.
References
- (1) Abraham Z., Romero G.E., 1999, A&A 344, 61
- (2) Arnaud M. et al. 2000, SP-1238, ESA Publications
- (3) Arnaud, K.A. 1996, in ASP Conference Series, Vol 101, 17
- (4) Bleeker J.A.M., et al 2000, The XEUS mission summary, ESA SP-1242
- (5) Fabian, A. C., Iwasawa, K., Reynolds, C. S., & Young, A. J., 2000, PASP, 112, 1145
- (6) Fan J.H., Romero G.E., Lin R.G., 2001, Chinese Astron. Astrophys. 25, 282
- (7) Hoevers H., Verhoeve P., 2003, in XEUS– Studying the evolution of the hot Universe, Hasinger G., Boller Th., Parmar A.N., eds. MPE Report, 281, 127
- (8) Iwasawa, K., et al., 1996, MNRAS, 282, 1038
- (9) Kaastra J.S., Roos N., 1992, A&A 254, 96
- (10) Krichbaum, T.P., Witzel, A., & Zensus, J.A., 2001, in: Proceedings of the 5th European VLBI Network Symposium, eds. J.E. Conway, A.G. Polatidis, R.S. Booth, and Y.M. Pihlstrom, p. 25 [astro-ph/0103444]
- (11) Kriss, G. A., Davidsen, A. F., Zheng, W., & Lee, G., 1999, ApJ, 527, 683
- (12) Lichti G.G., Balonek T., Courvoisier T.J-L., et al., 1995, A&A 298, 711
- (13) Lu, Y., & Yu, Q. 2001, ApJ, 561, 660
- (14) Nandra, K., George, I. M., Mushotzky, R. F., Turner, T. J., & Yaqoob, T., 1997, ApJ, 477, 602
- (15) Nandra, K., George, I. M., Mushotzky, R. F., Turner, T. J., & Yaqoob, T., 1999, ApJL, 523, 17
- (16) Romero, G.E., 1995, Ap&SS, 234, 49
- (17) Romero, G. E., Chajet, L., Abraham, Z, Fan, J. H. 2000, A&A, 360, 57
- (18) Roos N., 1988, ApJ 334, 95
- (19) Schmidt M., 1963, Nature 197, 1040
- (20) Sillampää A., Haarala S., Valtonen M.J., et al., 1988, ApJ 325, 628
- (21) Trümper J. E., & Tananbaum H.D. 2003, X-Ray and Gamma-Ray Telescopes and Instruments for Astronomy Proceedings of the SPIE, Volume 4851, (2003)
- (22) Valtaoja L., Valtonen M.J., Byrd G.G., 1989, ApJ 343, 47
- (23) von Montigny C., Aller H., Aller M., et al., 1997, ApJ 483, 161
- (24) Yaqoob, T., & Serlemitsos, P., 2000, ApJ, L95
- (25) Yu, Q., & Lu, Y., 2000, MNRAS, 311, 161
- (26) Yu Q. 2002, MNRAS, 331, 935
- (27) Zensus J.A., Bȧȧth L.B., Cohen M.H., 1988, Nature 334, 410