AGE DEPENDENCE OF THE VEGA PHENOMENON: OBSERVATIONS
Abstract
We study the time dependency of Vega-like excesses using infrared studies obtained with the imaging photopolarimeter ISOPHOT on board of ISO. We review the different studies published on this issue, and critically check and revise ages and fractional luminosities in the different samples. The conclusions of our study differ significantly from those obtained by other authors (e.g. Holland et al., 1998; Spangler et al., 2001) who suggested that there is a global power-law governing the amount of dust seen in debris disks as a function of time. Our investigations lead us to conclude that (i) for stars at most ages, a large spread in fractional luminosity occurs, but (ii) there are few very young stars with intermediate or small excesses; (iii) the maximum excess seen in stars of a given age is about fd , independent of time; and (iv) Vega-like excess is more common in young stars than in old stars.
1 INTRODUCTION
The detection of dust orbiting around Vega (Aumann et al., 1984) and other nearby main-sequence stars by the IRAS satellite marks the first detection of planetary material in stellar systems other than our own solar system. In the years since then, much attention has been paid to understand the origin and evolution of this phenomenon, and on the question if and how this discovery can tell us more about the planetary systems probably hidden in those dust rings and clouds. One important aspect of the research was the study of temporal evolution of the amount of dust present in these systems. Already Backman et al. (1987) noticed from colour-colour studies, that systems like Vega, Fomalhaut and Eridani could be more developed versions (with less dust) of the most famous Vega-like star Pictoris (catalog ). This suspicion was further strengthened by submillimetre observations of the four main members of this class of objects. Submillimetre observations are very useful since they have a better chance to measure the mass present in the system. Holland et al. (1998) showed that the measured masses of the disks of several prominent Vega-like stars seem to follow a power-law dependence with time. A stunning extra was that even the zodiacal dust cloud of the solar system seems to fit this trend.
With the launch of the Infrared Space Observatory, ISO, in 1995, several research groups set out to get a better handle on the time evolution of the Vega phenomenon. These groups used similar observations like the ones obtained with IRAS, namely photometry at mid-IR to far-IR wavelengths to determine the dust masses in these systems. Several roads where followed to improve the poor statistical significance of the IRAS studies: IRAS had shown that some stars display the Vega-phenomenon, but the stars did not form a good sample in several ways. First, the ages of the stars were poorly determined. And second, the detection limits of IRAS were such that large excesses could be detected, but for most stars the detection of the photosphere of the stars was not possible. It was therefore easier to establish that a star has a dust disk than to show that it does not have one.
The first issue, concerning the age determination, was addressed by several groups (e.g. Spangler et al., 2001) by choosing stars in different clusters. Since the ages of clusters can be determined rather accurately, this strategy should provide a much better calibration of the time axis. The disadvantage of this approach was that most clusters are not very nearby, and the photosphere of most stars in the sample was out of reach also for ISO sensitivities.
Habing et al. (1999, 2001) and Silverstone (2000) addressed the second problem of the IRAS results on the presence of a debris disk. They selected volume-limited samples of stars in order to study the Vega phenomenon in field stars. In particular, they chose different volumes for stars with different spectral type (i.e. luminosity) in order to ensure that the photosphere of the star would be detectable in all cases with good signal-to-noise. This sample is therefore mainly geared to check whether or not a disk is present. The obvious problem with field stars is, of course, that it is much more difficult to determine accurate ages for these stars, which may make a time-dust mass relation difficult to discover.
After the launch of ISO, it turned out that the targeted photometric sensitivities were difficult to reach. In fact, the limits could be reached, but only with a changed observational strategy (mini-maps) which required much more time than foreseen in the proposals. This has made the outcome of the studies less decisive than had been hoped. The task of cleaning up this question will be one of SIRTF’s major goals. Observers were faced with the decision to either accept larger limits, or to observe fewer sources and/or at fewer wavelengths.
Nevertheless, the groups working with ISO came up with age trends based on their observations. Studying the disk frequency around young A stars, Habing et al. (1999, 2001) concluded that there was a very clear break in the presence of a debris disk around 400 Myr. Most A stars younger than this limit showed Vega-like IR excesses while most A stars older than this limit did not show corresponding excesses. However, this work and the work of Decin et al. (2000) also showed that several stars supposedly much older did also show IR excesses.
Spangler et al. (2001) published the results of two samples: stars in several clusters of various ages, and a number of field stars with less well determined ages. In their data, Spangler et al. (2001) could determine a trend in the time evolution of the dust content of stellar systems. They found a power-law dependence with a power f. They further argued that a collisional cascade is expected to produce a dependence, and given the errors in the data that may well be just what is observed.
However, there are two reasons to doubt the conclusions reached by Spangler et al. (2001): (1) the observed relation between dust mass and age is not confirmed when large samples are considered, and (2) the expected relation between age and dust mass as derived by Spangler et al. (2001) omits some important physical effects. In this paper, we re-analyse observations of IR excess from Vega stars, and in a forthcoming paper (Dominik & Decin, 2003, hereafter Paper II) we will reformulate the theory for the time dependence of dust mass from debris disks. We would like to argue that the current observational evidence for the occurrence of this power-law is still very weak. First, in the cluster observations, this result is based on very small number statistics: usually there was only one excess source detected per cluster (with a maximum of three). Furthermore, in order to arrive at a representation of the average dust content of stars in a cluster, Spangler et al. (2001) average all the derived excesses. Due to the relatively low S/N in the observations, they also include in this calculation “negative” excesses. It is clear that such an approach can have strong problems when small numbers are involved. In particular, if only one source in each cluster has a clearly detectable excess, the procedure described above would dilute the measured IR excess. The average dust mass then depends on the number of observed stars in a certain cluster. Since this number varies per cluster, strong systematic effects are to be expected. A better approach would be to look only at the sources with clearly detected excesses. If there is a power-law time dependence intrinsic to these sources, then it should also be visible by just looking at the strongest excess stars of each age. Finally, Spangler et al. (2001) included in their plots also points obtained for the Chameleon I, Scorpius and Taurus star-forming clouds. These stars are clearly pre-main-sequence objects with first-generation disks in which the formation of larger bodies is incipient, while the dust in debris disks is thought to be replenished by collisions of e.g. comets. Moreover, the disks in pre-main-sequence stars are often optically thick in the radial direction, so that the IR luminosity in such sources is determined by the geometry of the disk (flaring or non flaring, for example) and not by the dust mass in the disk. These stars should therefore be excluded when considering the evolution of second-generation dust.
The purpose of this study is to re-investigate the time dependence of Vega-like excesses from photometric studies with the ISO satellite. The paper is organised as follows. A list of stars with IR excess detected by the ISO satellite is compiled in Sect. 2 and a critical assessment of the determinations of age and IR-to-total fractional luminosity is made. In the following section we plot the fractional luminosity versus age for various samples, and discuss these diagrams in the framework of the hypotheses alluded to in this introduction. In Sect. 4 we discuss the results and derive lessons and challenges for the coming SIRTF observations.
2 PARAMETER DETERMINATION
The data we discuss in this paper were taken from Habing et al. (1999, 2001); Decin et al. (2000); Silverstone (2000); Spangler et al. (2001) and Decin et al. (2003, in preparation). They all concern stars with an IR excess which is most probable caused by dust in a stellar disk and were obtained with ISOPHOT, the imaging photopolarimeter on board of ISO (Klaas et al., 1994; Kessler et al., 1996). All data in the samples of Habing et al. (1999, 2001); Decin et al. (2000) are C100 mini-maps at 60 m, while the samples of Silverstone (2000); Spangler et al. (2001) consist of a mixture of mini-maps and chopped C100 observations. In order to limit the discussion to debris disks and not to pollute the sample with first-generation disks, we only consider stars older than 10 Myr.
2.1 Age Determination
A variety of observational tests have been formulated to determine the age of main-sequence stars, which are based on different physical phenomena and can be applied to different stellar types with varying success. The dating of open clusters is considered as most reliable, e.g., by fitting the cluster member stars’ location on Hertzsprung-Russell diagrams to models of stellar evolution. This method is used for most stars in the sample of Spangler et al. (2001). The disadvantage of this approach for our purposes is that most clusters are far away, so that only disks with large excesses can be securely identified while small excesses will be difficult to distinguish from photospheric fluxes.
The other groups worked with single field stars, having a more difficult and uncertain age determination ((Decin et al., 2000; Habing et al., 2001; Silverstone, 2000) and some stars of Spangler et al. (2001)). An analysis of the different methods used for age determination for main-sequence stars was done by Lachaume et al. (1999). They concluded that isochrones are the best age estimators for stars with spectral type in the range B9–G5. A reliable age determination depends not only on the accuracy of the temperature and the luminosity determination, but also on that of the metallicity. Since stars evolve faster when they age, accurate age determinations are often more difficult for stars which are still close to the ZAMS. A far reaching ambiguity may arise when it is not clear if a star is evolved or still in the pre-main-sequence phase of evolution. A famous case is Pic (catalog ): from isochrones it was suggested that it may be 280 Myrs old. More recently, the discovery of several young M dwarfs which are in a moving group with Pic (catalog ) has shown that 15 Myr (Barrado y Navascués et al., 1999) is in fact a more likely age for this star, as was suggested by Lanz, Heap, & Hubeny (1995).
For late-type stars, Lachaume et al. (1999) concluded that a variety of methods (metallicity, rotation, calcium emission lines, and kinematics) is recommended, with a preference for age-determination using stellar rotation. However, many stars require in fact a combination of different methods to properly bracket their actual age. Beside the example given above of Pic (catalog ), also the age of e.g. HD207129 (catalog ) was in dispute for several years. While Jourdain de Muizon et al. (1999) deduced a lifetime of 4.6 Gyr based on the weakness of the CaII K-line emission; Zuckerman & Webb (2000) found an age estimate of 40 Myr relying on space motions and location in space.
All stars under study were subject to the same strategy to obtain a reliable age determination. Priority is given to ages determined by the lifetime of the cluster or moving group to which the star belongs. When it is not known whether a star is member of a moving group or cluster, and the star is an element of a binary system for which both stars can be placed on the Hertzsprung-Russell diagram, the age as determined by isochrone-fitting is taken. When none of these two conditions are met, the star is not on the ZAMS, and has a spectral type between B9 and G5, then we prefer isochrone-fitting to determine the age. Otherwise, the age as determined from rotation or chromospherical activity is taken.
2.2 Fractional Luminosity
The second parameter needed in our relationship is the fractional dust luminosity,
| (1) |
which is a commonly used measure of the amount of dust in these systems.
The different groups adopted different criteria for considering an objects as displaying an excess. Decin et al. (2000) and Habing et al. (2001) accepted only measurements where both the detection itself and the excess are measured with S/N 3; here the noise is calculated as the gaussian dispersion of the excess around zero for the non-excess stars, leading to a dispersion of 30 mJy at 60 m. Spangler et al. (2001) considered a source as detected if the flux at the on-target (centre) pixel exceeded 3 times the standard deviation of the flux on the 8 surrounding pixels; they obtained a standard deviation comparable with Decin et al. (2000) and Habing et al. (2001); however, an excess is accepted when it has a S/N 1. Silverstone (2000) used the same standard deviation calculation as Spangler et al. (2001), but used a S/N 2 criterion for the detection itself and for the excess measurement. To have a more consistent sample, we have refined the sample of Spangler by requiring a S/N ratio of the excess larger than 2; this led to the discarding of four objects.
The determination of the fractional luminosity, , is in principle straightforward if the excess radiation emitted by the dust can be measured at enough wavelengths. However, if the dust flux is measured at only one or a few points, one needs to make some assumption about the shape of the dust emission spectrum. While Decin et al. (2000) and Habing et al. (2001) derived the fractional luminosity based on the excess measurement at 60 m, making an assumption about the temperature of the dust as well, Spangler et al. (2001) and Silverstone (2000) calculated values of for each of their excess sources following the method of Backman & Gillett (1987), summing the luminosities in each wavelength band and including a correction to account for excess flux from wavelengths longer than the 90 or 100 m band. However, for the vast majority of their targets older than 20 Myr, there was either no measurable excess emission at 12 and 25 m or no flux measurement available. Therefore they calculated a correction factor necessary to reproduce the final values from only the 60 and 100 m excess, based on stars for which flux measurements at different wavelengths were known. Both methods give similar results except for two stars from Spangler’s sample, where their method led to an extremely high value for the fractional luminosity compared with the other method and compared to the results for similar stars. For both stars the fractional luminosity as obtained by the method of Decin et al. (2000) and Habing et al. (2001) is used during further discussion in this paper.
2.3 Overview of the Results
In this section, we report on the results of the determination of ages and fractional luminosities for the objects of the five samples considered. All results are summarised in Table AGE DEPENDENCE OF THE VEGA PHENOMENON: OBSERVATIONS.
-
•
Habing et al. (2001)
This sample was selected from the catalogue of stars within 25 pc from the Sun by Woolley (1970), and contained those main-sequence stars (spectral type A till K) for which the photospheric flux at 60 m is above the ISOPHOT detection limit (30 mJy). The sample was also restricted to those stars for which the infrared flux density can be unequivocally attributed to the target star. From a list of 84 main-sequence stars, 14 stars were found having a 3- infrared excess, i.e. exactly the same fraction as in the G dwarf sample of Decin et al. (2000). From the final list with stars with an IR excess, 55 Cnc (catalog ) is omitted as Vega-type star because the sub-millimetre flux, initially attributed to dust orbiting the star (Dominik et al., 1998), is reported instead to be from nearby background sources (Greaves et al., 2000).The ages were estimated by Lachaume et al. (1999) using isochrones for the early-type stars, and stellar rotation or a combination of methods for late-type stars. Since, these determinations have been questioned for two objects of the sample which appear to belong to moving groups of considerably shorter age. As already mentioned, Barrado y Navascués et al. (1999) associated Pic (catalog ) with several co-moving young M dwarfs, the age of which they estimated at 15 Myr. From a more extensive study of this moving group, Zuckerman et al. (2001) lowered this age to the 12 Myr we adopt in this study. Zuckerman & Webb (2000) suggested that also HD207129 (catalog ) belongs to a young moving group, the Tucanae Association, for which they estimate the age at 40 Myr, i.e. two orders of magnitude shorter than the result of the isochrone and the CaII study by Lachaume et al. (1999). In support of their shorter age for HD207129 (catalog ), which we also adopt, (Zuckerman & Webb, 2000) mention, besides the kinematic evidence, also high lithium abundance and an X-ray luminosity which is ten times that of the Sun.
-
•
Decin et al. (2000)
This sample was selected from the CORALIE planet-search programme, and consists mainly of G dwarfs (Udry et al., 2000). The CORALIE distance criterion locates the chosen stars in the Local Bubble, reducing the possibility that the dust responsible for excess thermal emission originates from the interstellar medium rather than from a planetary debris system. Decin et al. (2000) found 5 excess stars with a S/N3 out of the 30 measured targets. Since the sample selection was free from bias with respect to infrared excess, this works suggests that some 17% of G dwarfs possess debris disks.Since a fairly conservative approach was used for the selection of the excess stars, we are confident that the fractional luminosities were determined reliably. The ages were estimated from isochrones and confirmed – when possible – by other methods. There is no indication that any of these stars is particularly young. Four objects occur rather close to the ZAMS in the HR-diagram, so that their ages determined from isochrones may be rather uncertain, but the star HD22484 (catalog ) definitely is well evolved. By all means, the fact that sizeable fraction of a fairly unbiased sample of G dwarfs displays excesses, strongly suggests that relatively massive debris disks may survive around main-sequence stars of several Gyr old.
-
•
Spangler et al. (2001)
The targets in this sample fall in three distinct categories: (1) main-sequence stars in relatively nearby (generally closer than 120 pc) open clusters including Persei, Coma Berenices, Hyades, Pleiades, and the Ursa Major nucleus and stream. Cluster ages are between 50 and 700 Myr, and the target stars span spectral types A–K. (2) Selected classical and weak-line T Tauri stars in the Chameleon I, Scorpius, and Taurus star-forming clouds, and (3) a small sample of relatively nearby (less than 60 pc) isolated stars with indications of youth. As mentioned above, the sample of the T Tauri stars is rejected from our study. We want to be sure that the dust is clearly ‘second generation’, i.e. not primordial but released from larger bodies such as asteroids and comets. Four more objects (HII 3163 (catalog ), HD17796 (catalog ), HD184960 (catalog ) and HD27459 (catalog )) where discarded, because the S/N of the claimed excess measurement is lower than 2.As alluded to in the previous section, the fractional luminosity of HII 1132 (catalog ) (Pleiades cluster) and HD72905 (catalog ) (Ursa Major cluster) were adapted to lower values. In total, there were 3 excess detections in both Coma Berenices and Ursa Major, 1 detection in both the Persei and the Pleiades clusters, and no detections in the Hyades. The fraction of excess stars discovered in these clusters is smaller than in the field, probably mainly reflecting the different sensitivity limits of the surveys. The nearby field stars with an IR excess considered by Spangler et al. (2001) amount to seven: HD105 (catalog ), HD35850 (catalog ), HD37484 (catalog ), HD134319 (catalog ), HD151044 (catalog ), HD202917 (catalog ), and HD209253 (catalog ).
Age determinations for cluster objects can be considered to be robust. For HD37484 (catalog ), the age was determined using the abundance of lithium as measured by Favata et al. (1993) in comparison with the lithium abundances of stars in the Taurus, the Hyades and the Pleiades cluster. An extrapolation is however necessary for this star, which makes the age determination very inaccurate. This star may in fact be a pre-main-sequence star (Favata et al., 1993). For all these reasons, this star is omitted from the final sample. As dating technique for the other field stars, Spangler et al. (2001) used literature values of the chromospheric emission as measured in the cores of the Ca II H and K lines. Since significant additional information is available for all 6 stars, we have reconsidered their age determination.
A literature study shows that four of them are members of moving groups or association: HD105 (catalog ) and HD202917 (catalog ) belong to the Local Association (Montes et al., 2001) which is 20-150 Myr old; HD35850 (catalog ) is a member of the Pictoris moving group (Zuckerman et al., 2001), which is 12 Myr old. HD134319 (catalog ) is an element of the Hyades supercluster (600 Myr) (Montes et al., 2001). With respect to the calcium ages, we then find that HD105 (catalog ) and especially HD35850 (catalog ) are much younger, while the difference are smaller for the two other stars.
Following Lachaume et al. (1999), we checked the ages for the two remaining field stars, which have a spectral type between B9 and G5, using isochrones by Claret (Claret, 1995; Claret & Gimenez, 1995) with metallicity (X=0.73, Z=0.01), (X=0.70, Z=0.02) and (X=0.75,Z=0.03). We found that for HD209253 (catalog ), which is in good agreement with the age obtained by Spangler et al. (2001). For HD151044 (catalog ), the age we found is some 4 times larger than that quoted by Spangler et al. (2001).
-
•
Silverstone (2000)
This sample includes four sub-samples. (1) The initial focus was on an unbiased survey of nearby stars, with care taken to span the stellar parameters of mass, age, and multiplicity. The targets were selected from the Gliese catalog (a distance-limited catalog of stars closer than 25 pc). The distance limit was chosen such that the expected range of fractional luminosity, scaled to the apparent brightness of the targets, would be brighter than the anticipated ISO detection limits. Spectral types of the main-sequence targets were chosen to span the mass range of about 0.5 to 2 M⊙. They preferred stars whose ages were known in the literature. (2) In addition to this distance-limited survey, a selection of stars with indication of youth (), but whose distances placed them beyond the distance cutoff described above, was added. (3) Because ISO turned out not to be as sensitive as anticipated, mid-way through the project the unbiased survey was abandoned in favour of observations of Vega phenomenon candidates with good IRAS 60 m measurement, but generally only upper limits at 100 m. These targets were selected from the IRAS Faint Star Catalog (FSC) file and the SAO catalog. (4) Finally, a selection was made consisting of 23 stars from the Bright Star Catalog and with spectral types from A to G, located on the main sequence and occurring in the region of the sky missed by the IRAS all-sky survey.Silverstone (2000) estimated ages from the Ca II H and K line strengths. We have redetermined the ages for the stars with a 2- excess detection and for which the age, as calculated by Silverstone (2000), is higher than 10 Myr. From a literature study, we found that HD25457 (catalog ) is a member of the Local Association (Montes et al., 2001) and that HD164249 (catalog ) belongs to the Pictoris moving group (Zuckerman et al., 2001). HD4614 (catalog ) and HD131156 (catalog ) are components of nearby visual binary stars, which when put on isochrones, were found to have ages of Gyr and Gyr respectively (Fernandes et al., 1998). For the remaining stars with a spectral type between B9 and G5, we have checked the age using the isochrones of Claret (Claret, 1995; Claret & Gimenez, 1995) with metallicity (X=0.73, Z=0.01), (X=0.70, Z=0.02) and (X=0.75,Z=0.03). The ages obtained by this method give on average an age which is 0.39 dex larger in , which we consider to be within the errors of the different age determination methods. For two objects no independent age estimate could be made, namely the K star HD165341 (catalog ) and the F star HD38207 (catalog ) for which no accurate parallax is available.
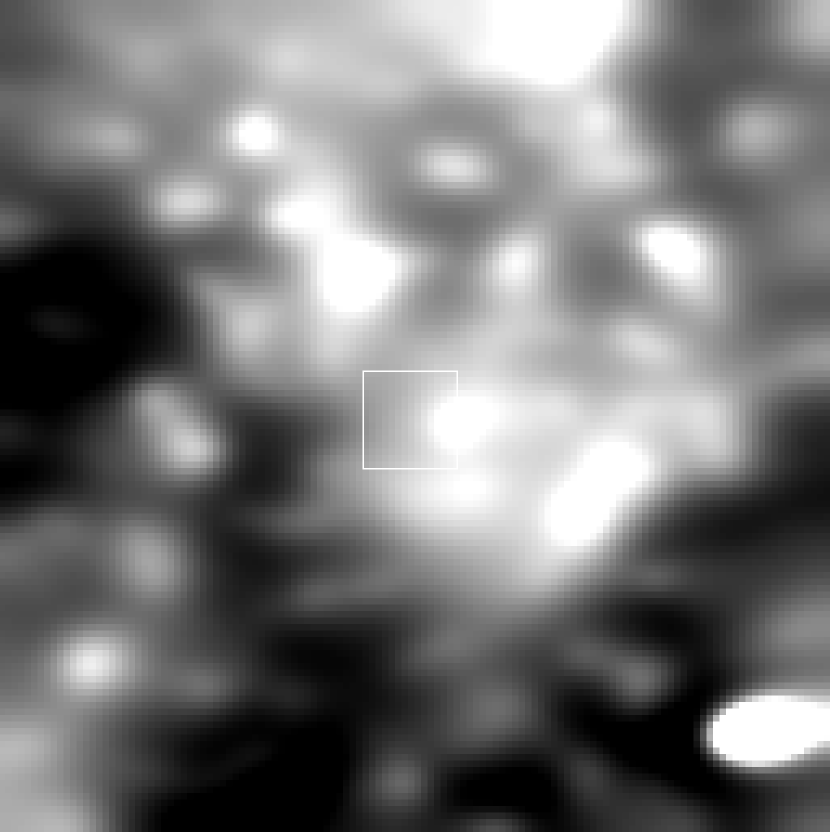
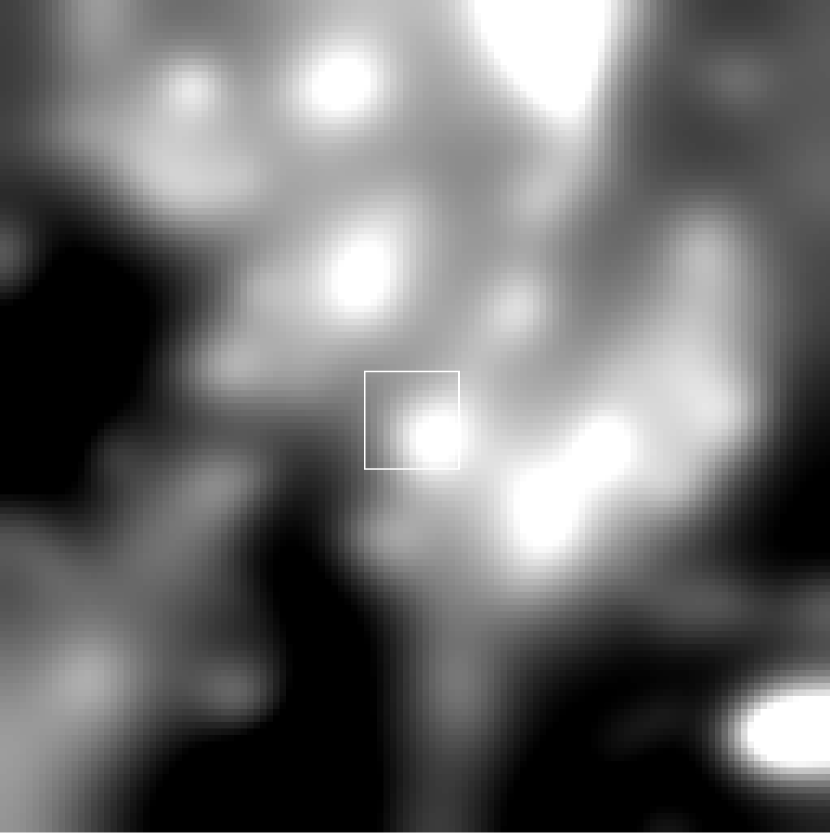
The star HD35850 deserves extra attention: it is the only young star of the whole sample with relatively low fractional luminosity. The young age of this star appears rather secure: not only does it belong to the -Pictoris moving group, but also the high lithium content and the high X-ray flux definitely points towards a genuine youth for this star Wichmann, Schmitt, & Hubrig (2003). On the other hand, we feel that the identification of this star as a Vega-type object may need confirmation. Looking in detail to the ISOPHOT mini-map, the observations show – in contrary to the maps of other Vega-excess stars – for only half of the pixels the highest flux when centred on the star. The HIRAS maps at 60 and 100 m of the region around HD35850 (Fig. 1) show an area of extended cirrus with lot of structure and different equally-bright points. The rectangle, plotted in the middle of these maps, is an indication of the size of the region seen by the ISOPHOT mini-map (not on the true position due to the small mis-pointing of ISO and IRAS). From inspection of these HIRAS maps, the possibility arises that the IR excess of HD35850 is related to the star being located in a zone of extended cirrus.
-
•
The K Giant HD3627 (catalog ), (Decin et al. 2003, in preparation)
HD3627 (catalog ) has a strong IR excess at 60 and 90 m and is an ISOPHOT-C100 point-source (Decin et al. 2003, in preparation). The excess is most probably due to a debris disk and not to cirrus or an extended source. HD3627 (catalog ) is at the moment the only known ISOPHOT C100 point-source K giant and is most probably the successor of an F-type main-sequence star. All K giants with IR excess from the list of Decin et al. (2003, in preparation) and Kim, Zuckerman, & Silverstone (2001) are rejected as debris-disk stars due to the fact that the IR excess is extended.
The parameters for all stars are listed in Table AGE DEPENDENCE OF THE VEGA PHENOMENON: OBSERVATIONS. The first column gives the name of the stellar target. The 2nd, 3th and 5th column tabulate respectively the V magnitude, the B-V colour and the spectral type as listed by Simbad. The parallax, as measured by Hipparcos, can be found in column 4. The logarithm of the published age as determined by the different mentioned authors is given in the 6th, while column 7th gives the fractional luminosity as we determined it. Column 8 contains the revised ages as obtained by the above mentioned strategy and the reference to these ages are tabulated in column 9. In the last column the relative reliability of the revised age determination is indicated on the basis of the following criteria: 4: sure age because star is member of a cluster or moving group; 3: object is member of a binary system for which both components fit on the same isochrone; 2: age of the field star could be determined by two methods (isochrones and chromospherically activity) with a maximal difference of 0.40 dex in (uncertainty for isochrone-fitting is 0.40 dex and for chromospherically activity 0.2 dex (Lachaume et al., 1999)); 1: large uncertainty on the age because the age could only be determined using one method, or two methods give an age difference of more than 0.40 dex in . The only exception on these criteria is HD35850. While the age determination of this star is secure, it is questionable if the IR excess tentatively detected by ISOPHOT is connected to the source. For this reason, the relative reliability of this star is reduced to 1.
3 RELATIONSHIP BETWEEN LIFETIME AND FRACTIONAL LUMINOSITY
The results listed in table AGE DEPENDENCE OF THE VEGA PHENOMENON: OBSERVATIONS are illustrated in Fig 2. In Fig. 2(a) the fractional luminosity is plotted as a function of the published age for all samples mentioned above. In Fig. 2(b), the same data is plotted, but now over the revised ages as described in the current paper. Figures 2(a) and 2(b) also show the power-law found by Spangler et al. (2001). Figure 2(c) repeats the same data, but now the symbol sizes reflect the age weight: large symbols show relatively secure ages, small symbols correspond to large error bars. Finally, in Fig. 2(d) the sample is increased by adding a check-up IRAS sample obtained from Song et al. (2000, 2001). These data have not been re-evaluated as to their accuracy of age and fractional luminosity, but they seem to follow the overall distribution of points derived from ISO observations quite well.
For the following discussion, we will mainly refer to Fig. 2(b), which contains fractional luminosity as obtained by ISO data versus the revised ages. The distribution of points in this diagram has a number of features:
-
1.
There appears to be a clear cut-off at about fd . The sample contains no Vega-like stars with significantly higher fd -values.
-
2.
The same upper cut-off of fd is valid throughout the diagram, and seems to be reached both by young and old stars. In particular, there are several cluster stars with well-determined ages between 300 and 700 Myrs which do have high fd -values, far away from the power-law as determined by Spangler et al. (2001).
-
3.
The lower-left corner of the diagram is almost empty, which means there are few young stars with small Vega-like excesses in the sample. The only example in the current sample is HD35850, which as we have discussed above, might possibly be the result of cirrus confusion. With some optimism, one might see a cut-off line with a slope of -1.3, touching to the lowest fd values in each age bin.
-
4.
The lower cut-off for fd is about , there are only very few stars below this line.
4 DISCUSSION
The different properties for the observed distribution in the age - fd diagram, as mentioned above, need a thorough discussion on their reliability and significance.
4.1 The upper cut-off: a true limit
The first important feature of the observed distribution of stars is the upper cut-off. The conclusion can hardly be escaped that old stars with fairly high fractional excesses do exist. Though it is admittedly difficult to obtain precise ages for individual stars, it is highly unlikely that the fact that the upper right part of the figure is densely populated, is due to uncertainties on the ages.
Apparently, there are no stars which physically could be described as Vega-like stars (following the definition of Lagrange, Backman, & Artymowicz (2000)) with fractional luminosities above this limit. This result appears to be robust in the sense that it can not be ascribed to a selection effect. If Vega-type stars with larger fractional luminosities exist, it is most unlikely that IRAS would not have detected any of them. The absence of large excesses must have a physical reason. We will address this issue in paper II.
4.2 The lower cut-off: the sensitivity limit
The lower cut-off in the diagram around fd is simply the sensitivity limit of the current measurements. The radiation of smaller amounts of dust is no longer stronger than the luminosity of the star at 60 m, and the dust emission cannot be detected with significance. Since the dust emission of Vega-like stars is detected by measuring the difference between the observed 60 m flux and the predicted photospheric flux, this limit is set by two important factors: the absolute calibration of the IR photometer, and the accuracy by which we know the photospheric flux. Therefore, the increased sensitivity of SIRTF alone will not push down this limit significantly. A much better absolute calibration is necessary as well. Also, significant work on understanding the photospheres of the individual stars will be required.
4.3 Few young stars with small amounts of dust?
The lower left corner of the age - fd diagram appears to be empty. Is this feature significant or is it caused by a small sample size or a selection effect? Table AGE DEPENDENCE OF THE VEGA PHENOMENON: OBSERVATIONS contains 10 stars younger than 200 Myrs. Except for HD35850, all those stars have excesses above the line touched to the lowest fractional luminosities in each age bin, with a slope of -1.3. The data are, however, currently not good enough to make a strong statement about the correctness of the slope. We can only claim that there is a decline with a slope between -1 and -2. This result is also supported by the volume-limited sample of Habing et al. (1999, 2001). The youngest 6 stars in this sample all have a Vega-like excess. The youngest stars in this sample without an excess is about 200 Myrs old. So, it is quite possible that stars in this age range and with lower Vega-like excesses are intrinsically rare. However, it can not yet be excluded that their apparent scarcity is due to the small number statistics of searches for such objects as well in the solar neighbourhood and – for stars further out – to the low sensitivity of the observational tools used so far. SIRTF will certainly provide large enough samples which can address this question.
4.4 The age - fd power-law
When we want say something about the evolution of debris disks with time, we have to stress that two effects on this relation have to be treated separately: (1) the dependence of the dust mass, or correlated fd , on age, and (2) the evolution of the fraction of stars displaying the Vega phenomenon.
We see very little evidence for the existence of a power-law describing globally the dependence of fd on age. The errors on the determination of the age and the fractional luminosity can not move all Vega-like stars to one single slope in the diagram. Also, the maximum amount of dust seems to be independent of age. The decline as found by Spangler et al. (2001) relies heavily on the inclusion in his sample of three very young clusters for which the infrared excesses stem from proto-stellar disks; when these clusters are removed, and only genuine Vega-type systems are considered, the resulting relation is much less clear. Moreover, we note that Spangler et al. (2001) also detected three fairly large excess stars. These stars are among others located in Coma Berenices, which is the second oldest cluster in their sample. These stars can surely not be moved to the power-law as found by them.
A power-law can, however, be present for individual stars. The absence of intermediate Vega-like excesses in young stars may be the strongest evidence for a time evolution of the excess in individual sources: since at ages of 200 Myrs and up many stars do have intermediate fd values, the absence of younger stars with similar excesses would mean that stars have evolved from high fd at young ages to low fd at 200 Myrs and beyond. As we will discuss in paper II, this will place interesting conditions on the structure and mass of young debris disks.
One can also expect that the fraction of stars having a debris will decrease in time because the debris disks will once be lost. While clusters should be a good statistical basis to investigate the real time dependence, the incompleteness (small samples for which the photosphere is not always detectable) of the sample today available makes it difficult to address this question. Therefore, we refer to the volume-limited sample of Habing et al. (1999, 2001). In this sample, all stars younger than 200 Myr display an IR excess. The stars which are younger than 400 Myr have 60% chance to have a debris disks, while only 9% of the stars which are older than 400 Myr have a Vega-like IR excess. On average, 16% of the stars from this volume-limited sample occurs with an IR excess. Also Decin et al. (2000) found 5 Vega-like objects in a sample of 30 G dwarfs with no bias with respect to age and the very occurrence of an infrared excess. These fractions are in good agreement with the fraction of main-sequence stars displaying the Vega phenomenon as obtained by IRAS, namely % (Plets & Vynckier, 1999).
We want however to stress that the evolution of debris disks in a cluster can be differ from these around field stars because cluster dynamical interaction between stars may affect circumstellar disks in a way which is unlikely for stars in a field.
5 CONCLUSIONS
In this paper, the time dependence of debris disks is re-investigated from IR studies obtained by ISOPHOT. Our re-evaluation of these data led to some important conclusions: (i) a large spread of fractional luminosity occurs, but (ii) there are few very young stars with intermediate or small IR excesses; (iii) there appears to be a clear maximum for the fractional luminosity at a given age around fd , and (iv) a debris disk is more common around young stars than around old ones. However, it is clear that this field of research is eagerly awaiting the possibilities offered by the SIRTF satellite. The higher sensitivity of this instrument will alow more accurate measurements of statistically relevant samples in clusters and should also enable us to find out whether the scarcity of young stars with real but low excesses is genuine. To reach these goals a good absolute calibration of the instruments and significant work on understanding the photospheres of the individual stars will be required. For studies of the Vega phenomenon in the field, it will remain important to complement SIRTF observations with ground-based studies which allow to constrain the stellar ages to within useful limits.
References
- Aumann et al. (1984) Aumann, H. H., Beichman, C. A., Gillett, F. C., de Jong, T., Houck, J. R., Low, F. J., Neugebauer, G., Walker, R. G., & Wesselius, P. R. 1984, ApJ, 278, L23
- Backman & Gillett (1987) Backman, D. & Gillett, F. C. 1987, in LNP Vol. 291: Cool Stars, Stellar Systems and the Sun, Vol. 5, 340+
- Backman et al. (1987) Backman, D. E., Gillett, F. C., Low, F. J., Neugebauer, G., Witteborn, F. C., & Aumann, H. H. 1987, BAAS, 19, 830
- Barrado y Navascués et al. (1999) Barrado y Navascués, D., Stauffer, J. R., Song, I., & Caillault, J.-P. 1999, ApJ, 520, L123
- Claret (1995) Claret, A. 1995, A&AS, 109, 441
- Claret & Gimenez (1995) Claret, A. & Gimenez, A. 1995, A&AS, 114, 549+
- Decin et al. (2000) Decin, G., Dominik, C., Malfait, K., Mayor, M., & Waelkens, C. 2000, A&A, 357, 533
- Dominik et al. (1998) Dominik, C., Laureijs, R. J., Jourdain de Muizon, M., & Habing, H. J. 1998, A&A, 329, L53
- Favata et al. (1993) Favata, F., Barbera, M., Micela, G., & Sciortino, S. 1993, A&A, 277, 428
- Fernandes et al. (1998) Fernandes, J., Lebreton, Y., Baglin, A., & Morel, P. 1998, A&A, 338, 455
- Greaves et al. (2000) Greaves, J. S., et al. 2000, American Astronomical Society Meeting, 197, 826+
- Habing et al. (1999) Habing, H. J., et al. 1999, Nature, 401, 456
- Habing et al. (2001) Habing, H. J., et al. 2001, A&A, 365, 545
- Holland et al. (1998) Holland, W. S., et al. 1998, Nature, 392, 788
- Jourdain de Muizon et al. (1999) Jourdain de Muizon, M., et al. 1999, A&A, 350, 875
- Kessler et al. (1996) Kessler, M. F., et al. 1996, A&A, 315, L27
- Kim, Zuckerman, & Silverstone (2001) Kim, S. S., Zuckerman, B., & Silverstone, M. 2001, ApJ, 550, 1000
- Klaas et al. (1994) Klaas, U., Krüger, H., Heske, A., & Laureijs, R. J., eds. 1994, ISOPHOT Observer’s Manual (Version 3.1)
- Lachaume et al. (1999) Lachaume, R., Dominik, C., Lanz, T., & Habing, H. J. 1999, A&A, 348, 897
- Lagrange, Backman, & Artymowicz (2000) Lagrange, A.-M., Backman, D. E., & Artymowicz, P. 2000, Protostars and Planets IV, 639+
- Lanz, Heap, & Hubeny (1995) Lanz, T., Heap, S. R., & Hubeny, I. 1995, ApJ, 447, L41+
- Montes et al. (2001) Montes, D., López-Santiago, J., Gálvez, M. C., Fernández-Figueroa, M. J., De Castro, E., & Cornide, M. 2001, MNRAS, 328, 45
- Plets & Vynckier (1999) Plets, H. & Vynckier, C. 1999, A&A, 343, 496
- Silverstone (2000) Silverstone, M. D. 2000, Ph.D. Thesis
- Song et al. (2001) Song, I., Caillault, J.-P., Barrado y Navascués, D., & Stauffer, J. R. 2001, ApJ, 546, 352
- Song et al. (2000) Song, I., Caillault, J.-P., Barrado y Navascués, D., Stauffer, J. R., & Randich, S. 2000, ApJ, 533, L41
- Spangler et al. (2001) Spangler, C., Sargent, A. I., Silverstone, M. D., Becklin, E. E., & Zuckerman, B. 2001, ApJ, 555, 932
- Udry et al. (2000) Udry, S., Mayor, M., Queloz, D., Naef, D., & Santos, N. 2000, in From Extrasolar Planets to Cosmology: The VLT Opening Symposium, Proceedings of the ESO Symposium held at Antofagasta, Chile, 1-4 March 1999. Edited by Jacqueline Bergeron and Alvio Renzini. Berlin: Springer-Verlag, 2000. p. 571., 571+
- Wichmann, Schmitt, & Hubrig (2003) Wichmann, R., Schmitt, J. H. M. M., & Hubrig, S. 2003, A&A, 399, 983
- Woolley (1970) Woolley, R. v. d. R. 1970, Royal Observatory Annals, 5
- Zuckerman et al. (2001) Zuckerman, B., Song, I., Bessell, M. S., & Webb, R. A. 2001, ApJ, 562, L87
- Zuckerman & Webb (2000) Zuckerman, B. & Webb, R. A. 2000, ApJ, 535, 959

| name | V | B-V | plx | Sp Type | Age | Reliability | |||
|---|---|---|---|---|---|---|---|---|---|
| (mag) | (mag) | (mas) | (yr) | (yr) | Reference | Indicator | |||
| HD10647 (catalog )11footnotemark: | 5.52 | 0.551 | 57.63 | F8V | 9.54 | -3.27 | 9.54 | 1 | 1 |
| HD20794 (catalog )11footnotemark: | 4.26 | 0.711 | 165.02 | G8V | 9.86 | -4.70 | 9.86 | 1 | 1 |
| HD22484 (catalog )11footnotemark: | 4.29 | 0.575 | 72.89 | F9V | 9.72 | -4.93 | 9.72 | 1 | 1 |
| HD41700 (catalog )11footnotemark: | 6.35 | 0.517 | 37.46 | G0IV-V | 9.63 | -3.75 | 9.63 | 1 | 1 |
| HD53143 (catalog )11footnotemark: | 6.81 | 0.786 | 54.33 | K0IV-V | 8.99 | -3.25 | 8.99 | 1 | 1 |
| HD10700 (catalog )22footnotemark: | 3.49 | 0.727 | 274.17 | G8V | 9.86 | -4.60 | 9.86 | 2 | 2 |
| HD17925 (catalog )22footnotemark: | 6.05 | 0.862 | 96.33 | K1V | 7.90 | -3.90 | 7.90 | 2 | 2 |
| HD22049 (catalog )22footnotemark: | 3.72 | 0.880 | 311.00 | K2V | 8.51 | -3.54 | 8.51 | 2 | 1 |
| HD30495 (catalog )22footnotemark: | 5.49 | 0.632 | 75.10 | G3V | 8.32 | -4.10 | 8.32 | 2 | 1 |
| HD38678 (catalog )22footnotemark: | 3.55 | 0.104 | 46.47 | A2Vann | 8.57 | -4.70 | 8.57 | 2 | 1 |
| HD95418 (catalog )22footnotemark: | 2.34 | 0.033 | 41.07 | A1V | 8.56 | -5.00 | 8.56 | 2 | 1 |
| HD102647 (catalog )22footnotemark: | 2.14 | 0.090 | 90.16 | A3Vvar | 8.38 | -4.80 | 8.38 | 2 | 1 |
| HD128167 (catalog )22footnotemark: | 4.47 | 0.364 | 64.66 | F3Vwvar | 9.23 | -5.00 | 9.23 | 2 | 1 |
| HD139664 (catalog )22footnotemark: | 4.64 | 0.413 | 57.09 | F5IV-V | 9.05 | -4.00 | 9.05 | 2 | 1 |
| HD172167 (catalog )22footnotemark: | 0.03 | -0.001 | 128.93 | A0Vvar | 8.54 | -4.80 | 8.54 | 2 | 1 |
| HD207129 (catalog )22footnotemark: | 5.57 | 0.601 | 63.95 | G2V | 9.78 | -3.80 | 7.60 | 6 | 4 |
| HD216956 (catalog )22footnotemark: | 1.17 | 0.145 | 130.08 | A3V | 8.34 | -4.30 | 8.34 | 2 | 1 |
| Pic (catalog )22footnotemark: | 3.85 | 0.170 | 51.90 | A3V | 8.45 | -2.82 | 7.08 | 7 | 4 |
| HE 361 (catalog )33footnotemark: | 9.68 | 0.430 | F4V | 7.70 | -3.21 | 7.70 | 3 | 4 | |
| HII 1132 (catalog )33footnotemark: | 9.43 | 0.500 | F5V | 8.07 | -3.371111footnotemark: | 8.07 | 3 | 4 | |
| HD72905 (catalog )33footnotemark: | 5.63 | 0.618 | 70.07 | G1.5Vb | 8.48 | -4.691111footnotemark: | 8.48 | 3 | 4 |
| HD125451 (catalog )33footnotemark: | 5.41 | 0.385 | 38.33 | F5IV | 8.48 | -4.11 | 8.48 | 3 | 4 |
| HD139798 (catalog )33footnotemark: | 5.76 | 0.353 | 27.98 | F2V | 8.48 | -4.48 | 8.48 | 3 | 4 |
| HD107067 (catalog )33footnotemark: | 8.69 | 0.523 | 14.54 | F8 | 8.70 | -2.85 | 8.70 | 3 | 4 |
| HD108102 (catalog )33footnotemark: | 8.12 | 0.534 | 9.34 | F8 | 8.70 | -3.23 | 8.70 | 3 | 4 |
| HD108651 (catalog )33footnotemark: | 6.63 | 0.212 | 12.66 | A0p | 8.70 | -3.89 | 8.70 | 3 | 4 |
| HD105 (catalog )3,43,4footnotemark: | 7.51 | 0.595 | 24.85 | G0V | 8.67 | -3.37 | 7.93 | 8 | 4 |
| HD35850 (catalog )3,43,4footnotemark: | 6.30 | 0.553 | 37.26 | F7V: | 8.37 | -4.52 | 7.08 | 9 | 1 |
| HD134319 (catalog )3,43,4footnotemark: | 8.40 | 0.677 | 22.59 | G5 | 8.70 | -3.48 | 8.78 | 8 | 4 |
| HD151044 (catalog )3,43,4footnotemark: | 6.47 | 0.503 | 34.00 | F8V | 9.10 | -4.17 | 9.68 | 11 | 1 |
| HD202917 (catalog )3,43,4footnotemark: | 8.65 | 0.690 | 21.81 | G5V | 8.20 | -3.33 | 7.93 | 8 | 4 |
| HD209253 (catalog )3,43,4footnotemark: | 6.63 | 0.504 | 33.25 | F6/F7V | 8.60 | -3.82 | 8.65 | 11 | 2 |
| HD4614 (catalog )44footnotemark: | 3.46 | 0.587 | 167.99 | G0V SB | 8.60 | -5.43 | 9.60 | 10 | 3 |
| HD131156 (catalog )44footnotemark: | 4.54 | 0.720 | 149.26 | G8V+K4V | 8.90 | -5.02 | 9.30 | 10 | 3 |
| HD144284 (catalog )44footnotemark: | 4.01 | 0.528 | 47.79 | F8IV-V | 9.10 | -5.57 | 9.49 | 11 | 2 |
| HD152391 (catalog )44footnotemark: | 6.65 | 0.749 | 59.04 | G8V | 9.00 | -4.30 | 9.00 | 4 | 1 |
| HD165341 (catalog )44footnotemark: | 4.03 | 0.860 | 196.62 | K0V SB | 9.20 | -5.00 | 9.20 | 4 | 1 |
| HD8907 (catalog )44footnotemark: | 6.66 | 0.505 | 29.26 | F8 | 8.76 | -3.62 | 9.48 | 11 | 1 |
| HD15115 (catalog )44footnotemark: | 6.79 | 0.399 | 22.33 | F2 | 8.70 | -3.35 | 8.70 | 4 | 1 |
| HD15745 (catalog )44footnotemark: | 7.47 | 0.360 | 15.70 | F0 | 8.90 | -2.89 | 8.90 | 4 | 2 |
| HD22128 (catalog )44footnotemark: | 7.59 | 0.378 | 7.06 | A5 | 8.50 | -3.18 | 9.14 | 11 | 1 |
| HD25457 (catalog )44footnotemark: | 5.38 | 0.516 | 52.00 | F5V | 8.70 | -4.07 | 7.93 | 8 | 4 |
| HD38207 (catalog )44footnotemark: | 8.47 | 0.360 | F2V | 8.60 | -3.00 | 8.60 | 4 | 1 | |
| HD164249 (catalog )44footnotemark: | 7.01 | 0.458 | 21.34 | F5V | -2.89 | 7.08 | 9 | 4 | |
| HD206893 (catalog )44footnotemark: | 6.69 | 0.439 | 25.70 | F5V | 8.90 | -3.66 | 8.90 | 11 | 2 |
| HD221853 (catalog )44footnotemark: | 7.35 | 0.405 | 14.04 | F0 | 8.90 | -3.32 | 9.25 | 11 | 2 |
| HD177817 (catalog )44footnotemark: | 6.00 | -0.025 | 3.65 | B7V | 8.00 | -4.19 | 8.40 | 11 | 2 |
| HD3627 (catalog )55footnotemark: | 3.27 | 1.268 | 32.19 | K3III | 9.50 | -4.46 | 9.50 | 5 | 1 |
References. — (1) Decin et al. (2000); (2) Habing et al. (2001); (3) Spangler et al. (2001); (4) Silverstone (2000); (5) Decin et al. (2003, in preparation); (6) Zuckerman & Webb (2000); (7) Barrado y Navascués et al. (1999); (8) Montes et al. (2001); (9) Zuckerman et al. (2001); (10) Fernandes et al. (1998); (11) this work.