The Eye of the Tornado—an isolated, high mass young stellar object near the Galactic centre
Abstract
We present infrared (AAT, UKIRT) and radio (VLA, SEST) observations of the Eye of the Tornado, a compact source apparently near the head of the Tornado Nebula. The near-infrared Br and He i lines are broad (FWHM and km s-1, respectively) and have a line centre at V205 km s-1. This corresponds to a feature at the same velocity in the J=1–0 line profile. The kinematic velocity derived from Galactic rotation places the Eye at the distance of the Galactic Centre (i.e. 8.5 kpc) and separated (probably foreground) from the Tornado Nebula. Four knots of emission are seen in the Br line and at 6 and 20 cm. Together with the flat radio spectral index, we confirm that the Eye contains ionized gas, but that this is embedded within a dense molecular core. The spectral energy distribution can be modelled as a two-component blackbody + greybody, peaking at far–IR wavelengths. The knots are UC H ii regions, and the core contains a luminous ( ), embedded, massive young stellar source. We also propose a geometrical model for the Eye to account for both its spectral energy distribution and its morphology.
keywords:
stars: formation – H ii regions – ISM: individual: Tornado Nebula, Eye of Tornado, G357.63-0.06, G357.7-0.1 – ISM: molecules – supernova remnants1 Introduction
The Tornado Nebula (G357.7-0.1) is an unusual non-thermal radio source located close, in projection, to the Galactic centre. It has been classified as a supernova remnant on the basis of its filamentary structure, steep radio spectrum and linear polarization (Milne, 1979; Clark & Caswell, 1976; Caswell et al., 1980; Shaver et al., 1985a). Its unique structure has, however, prompted other interpretations, such as an extra-galactic head-tail source (Weiler & Panagia, 1980; Caswell et al., 1989), an accretion powered nebula (Helfand & Becker, 1985; Becker & Helfand, 1985) or a precessing twin-jet system (Stewart et al., 1994). The nebula has an axially symmetric structure, with multiple components. The bright western part (the ‘Head’) is connected to a larger filamentary arc in the centre, which in turn is connected to an extended ‘Tail’ to the east containing regularly spaced loops (see Stewart et al., 1994). The entire structure extends over 10 arcmin. X–ray emission from a thermal plasma is associated with the Head, as well as from regions of the Tornado’s Tail, and led Gaensler et al. (2003) to suggest that the Tornado is a ‘mixed morphology’ supernova remnant.
A compact radio source, the ‘Eye’ (G357.63-0.06), is located about 30 arcsec west of the Head. Its nature is the subject of this paper. The apparent proximity to the Tornado, and location along its axis of symmetry, suggests a connection between the two. For instance, the Eye has been interpreted as an accreting binary system responsible for the formation of the Tornado Nebula (Becker & Helfand, 1985). It has also been suggested that it may be a high proper motion pulsar with the Tornado as its associated SNR (Shull, Fesen, & Saken, 1989). However, the flat radio spectrum of the Eye, together with the IRAS flux densities, strongly suggest that it is an H ii region, rather than a non-thermal source (Shaver et al., 1985b) and is possibly quite unrelated to the Tornado. The X–ray emission from the Head is also clearly not associated with the Eye (Gaensler et al., 2003).
An understanding of both the Tornado and the Eye has been hampered by the debate regarding whether the two objects are related. In this paper we present infrared recombination and molecular line data for the Eye that allows its kinematic distance to be determined. It places the Eye at the same distance as the Galactic centre, and in front of the Tornado Nebula. The Eye and the Tornado are therefore separate sources. In a related paper Brogan & Goss (2003), making use of our near–IR recombination line data to guide their observations with the VLA, obtained radio recombination line data to reach the same conclusion. We then proceed to interpret other infrared and radio data for the Eye in terms of a massive young stellar object in the core of a compact, dense molecular cloud. We describe the observations in the next section, present the results in §3, and discuss them in §4, before drawing conclusions in §5.
2 Observations
This paper presents observations, taken at infrared, millimetre and radio wavelengths, of the Eye (G357.63-0.06), a thermal radio source at the Head of the Tornado Nebula (G357.7-0.1). The Eye is centred at , (B1950). The data described here was obtained using a number of different facilities: the Anglo Australian Telescope (AAT) and UK Infrared Telescope (UKIRT) for the near-infrared, the Swedish–ESO Submillimetre Telescope (SEST) for the millimetre and the Very Large Array (VLA) for the radio data. We also make use of archived data from the Midcourse Space Explorer111http://irsa.ipac.caltech.edu/ipac/msx/msx.html (MSX) and Infrared Astronomy Satellite222http://www.ipac.caltech.edu/ipac/iras/iras.html (IRAS) space missions. We describe how these data were obtained and processed in the following sub-sections.
2.1 AAT Observations
The 3.9 m Anglo Australian Telescope333The Anglo Australian Telescope is a bi-national facility operated by the Anglo Australian Observatory. was used with the IRIS near-infrared camera (Allen et al., 1993) on 14–15 July 1994 to obtain , and (i.e. 1.25, 1.65 and 2.15 m respectively) broad-band continuum images, and line images through narrow-band (1% width) filters centred at the wavelengths of the hydrogen Br (2.167 m) recombination line, and the H2 2.122 m line. The images included both the Eye and portions of the Tornado Nebula. Only some of these data are presented here, showing the Eye, and were obtained with 0.61 arcsec pixel scale and 80 arcsec field of view. The final images were created by combining 9 overlapping frames, each with 60 s integration time, to cover an area roughly square arcmin in size. ‘Standard’ reduction methods were used, involving linearisation, flat-fielding with a dome flat, sky-subtraction using the median of the 9 frames, and cleaning of bad pixels. The separate frames were then combined using appropriately determined pixel offsets, to produce a single image. A coordinate frame was applied by registering the image with a (lower sensitivity) 2.2 m band image obtained from the Two Micron All Sky Survey444http://www.ipac.caltech.edu/2mass/ (2MASS) data base. The images were flux calibrated through measurements made of the standard star HD 159402 (with a –band magnitude of 8.140) taken through the same filters as the source data.
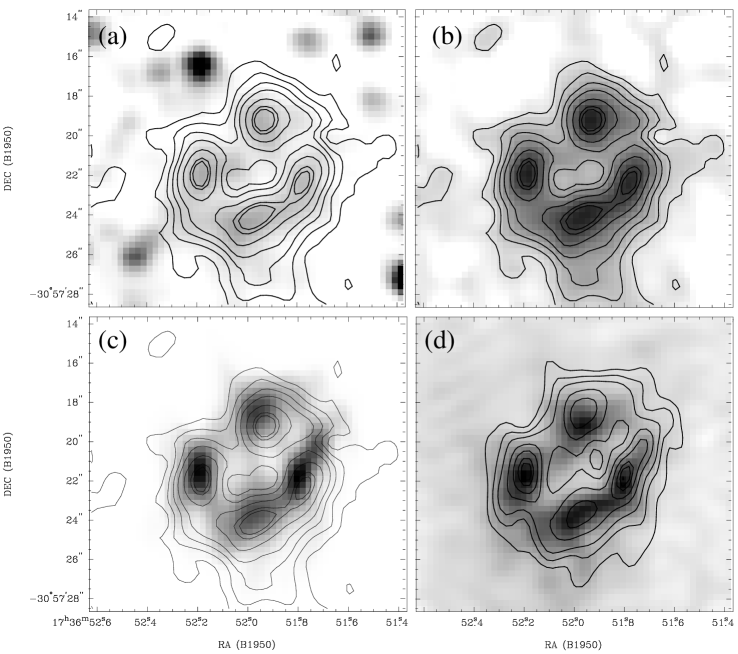
Figure 1a shows the continuum image obtained in the 2.17 m filter in the field around the Eye. Aside from the small region of nebulosity associated with Eye, all that the infrared images show are the crowded star fields apparent in any view directed towards the central regions of the Galaxy. Optical images of the same fields, for instance the Digital Sky Survey555http://archive.stsci.edu/dss/ (DSS), show only a small fraction of the stars seen at 2 m, the result of extinction from foreground dust. While we do not show the results here, an analysis of the photometry of the field (Hoang, 1995) shows that the stars are typically 1.5 magnitudes fainter at , and 3 magnitudes fainter at , than they are at –band. Plotting their positions on an infrared colour-colour diagram indicates a typical visual extinction of A mag. for the stars in the field.
Morphologically, the images of the Eye at 2.12 m and 2.17 m, as well as in the broad-band filter, are very similar. A 1.5–2.5 m spectrum, also obtained with IRIS (not shown), shows that the emission in this band is dominated by the Br line and the He i 2.058 m recombination line, with a weak continuum. Therefore, the emission seen through the 2.12 m filter image can be attributed to continuum (and not to H2 line emission), and may be used to subtract the continuum from the 2.17 m data to yield a pure Br line image. This was done by first registering the two images, and lightly smoothing to ensure the effective seeing was equivalent in both. A scaling factor was determined that minimised the residuals for the stars when the two images were subtracted. The Br line image is shown in Figure 1b, overlaid with contours of the line intensity. The Eye is not seen in either the or band images obtained with IRIS, which yields an upper limit on the intensity of any source to 19 and 18 magnitudes in these bands, respectively.
2.2 UKIRT Observations
The 3.8 m UK Infrared Telescope was used with the CGS4 spectrometer (Mountain et al., 1990) on 13 August 1997 to measure the line profile of Br 2.167 m and the He i 21P–21S 2.058 m recombination lines. The echelle mode of the spectrometer was used, providing a spectral resolution of 16 km s-1 and bandpass of 1,800 km s-1. A long slit, of width 1.2 arcsec, was placed through the southern and the western knots of the Eye (i.e. orientated 57° W of N), and the telescope nodded 30 arcsec along the slit direction. 1600 s of integration time was obtained on both lines. Data reduction consisted of extracting the data from the rows of the array where the source appeared, subtracting the sky emission, and wavelength calibrating the spectrum using both an argon arc lamp and OH airglow lines in the data. Dividing by the result of equivalent steps made on measurements of the standard star (BS 6522) both corrected for sensitivity variations with wavelength, and provided a flux calibration.
The profiles of the two lines are shown in Figure 2, with the velocity scale set to the local standard of rest (LSR). The total flux measured for the Br line is about half that determined through imaging the line, but this discrepancy is not surprising since the slit only measures emission from two of the knots. Not apparent in this figure are several additional emission features with VLSR velocities from 300 km s-1 to 900 km s-1 in the Br line spectrum, that are 5–10% of its strength. These are not, however, high velocity features associated with the Br line, but are He i (n=7–4) transitions (see Najarro et al., 1994).
2.3 SEST Observations
The 15 m Swedish–ESO Submillimetre Telescope (SEST666The Swedish–ESO Submillimetre Telescope is operated by the Swedish National Facility for Radio Astronomy, the Onsala Space Observatory, and by the European Southern Observatory.) was used on 6 June 2000 to obtain a profile of the 12CO J=1–0 line emission at 2.6 mm from the Eye. The angular resolution of these data is 45 arcsec, with 1.5 km s-1 spectral resolution (after smoothing), as part of a larger investigation associated with a study of OH(1720 MHz) maser emission from the Tornado (Lazendic et al., 2003a, b). Data analysis consisted of baseline subtraction and Hanning smoothing. The data were corrected for atmospheric absorption by measurements of a blackbody calibration source, and had a main beam efficiency of 0.74 applied, to provide the brightness temperature on the flux scale. The line profile is shown in Figure 3. The feature at 210 km s-1 seems to be confined to a region within arcsec around the Eye, but this conclusion is drawn from the data sampled with 60 arcsec spacing (see Lazendic et al., 2003b). Therefore, observations with better sampling and angular resolution are needed to map the distribution of the molecular cloud associated with the Eye.
Observations of the 1.2 mm continuum emission were also obtained with the 37-channel SIMBA bolometer array on 4 June 2002. The FWHM of each element is with the separation between each . A fast scanning mode was used (80 arcsec s-1) to obtain a map of size (az elev). The map is comprised of 51 sub-scans, each separated by , and took approximately 15 minutes to complete. Three separate maps were obtained and coadded to produce the final image. Pointing and sub-reflector focussing were checked prior to the observations and sky-dip calibrations performed to obtain the atmospheric optical depth. The planet Uranus was used for flux calibration, with an assumed flux density of 40.3 Jy. No detection of the Eye was made at 1.2 mm, with a upper limit of 39 mJy.
2.4 VLA Observations
Radio continuum observations of the Eye of the Tornado were carried out at 6 and 20 cm on 28 April 1985 and 19 July 1991 with the Very Large Array of the National Radio Astronomy Observatory777The National Radio Astronomy Observatory is a facility of the National Science Foundation, operated under a cooperative agreement by Associated Universities, Inc. in its BnA and A array configurations, respectively. We obtained the data from the VLA archives. The phase centre for both observations are at (B1950). Standard calibration used 1748–253 and 3C286 as the phase and amplitude calibrators, respectively. Standard self-calibration procedure was also applied to each data set. The CLEANed beams in the final images are (FWHM) at 20 cm, and (FWHM) at 6 cm, with the respective rms noise being 0.2 and 0.13 mJy beam-1. The fluxes at 6 and 20 cm are listed in Table 1. Figure 1c and 1d show an overlay of the Br contours on the 20 cm radio continuum, and the 20 cm contours on the 6 cm image, respectively. While there appears to be a small offset in this Figure between the 20 cm image and both the 6 cm and the Br images, of order 0.5 arcsec, we do not believe this is real as it is much less than the spatial resolution of the data at 20 cm.
2.5 MSX and IRAS Data
Infrared continuum fluxes from 8 to 21 m and from 12 to 100 m have been obtained from the MSX and IRAS sky surveys. The IRAS fluxes were obtained from the point source catalogue, whereas the MSX fluxes were determined from the calibrated survey images (and not from the published point source catalogue, which can be in error). The source is unresolved in both the MSX and IRAS images, the former limiting the source size to less than 20 arcsec in extent. Examination of the MSX and SIMBA images fails to show any sources which could contribute significantly to the far–IR fluxes within the IRAS beam, so we have attributed all the flux measured by IRAS as originating from the Eye. We also note that no source is seen associated with the Eye in the 2MASS near–IR sky survey. The infrared fluxes are listed in Table 1.
3 Results
The Eye is resolved by the near–IR and radio measurements as a compact H ii region (see Fig. 1), and therefore must be undergoing massive star formation. It consists of four knots of emission, each about 1.5 arcsec across and of similar brightness, symmetrically placed about the perimeter of a circle 6 arcsec across. There are faint extensions extending 2 arcsec to the south and to the west in the Br image, but no emission from its centre.
The emission velocity of the Br and CO lines is 205 km s-1. It is also close to the emission velocity for the H92 line that has recently been measured by Brogan & Goss (2003). This velocity allows a kinematic distance to be determined for the source, despite the proximity of the sight line to the Galactic centre. The source is found to be at the same distance as the Galactic centre, and separated (probably foreground–see §3.1.2) from the Tornado. The IR continuum fluxes can then be used to derive a luminosity for the Eye. Modelling its spectrum shows that it is a heavily embedded massive young stellar object. The radio and Br fluxes can then be used to derive an emission measure and an extinction to the Eye, and to derive the density of the ionized gas in the source. The knots are found to be ionized cavities within a dense molecular core which appears to have only a single massive star forming within it. The analysis that has led to these conclusions is discussed in the following sub-sections.
3.1 Distance
3.1.1 The Eye
Several features are apparent in the CO profile (Figure 3), with a number of features extending from 60 km s-1 to 20 km s-1, with a peak at 2 km s-1. These undoubtedly arise from distinct molecular clouds at different distances along the sight line towards the central part of the Galaxy. Particularly notable, however, is a 10 km s-1 wide feature at VLSR of 205 km s-1. This velocity is the same as the peak emission velocities in the hydrogen and helium infrared recombination lines (Figure 2), allowing us to identify these three lines as arising from the same source along this sight line. Determining a kinematic distance along such a sight line, within a few degrees of the Galactic centre (=3576, =01), generally cannot be done since the source’s motion will usually largely be tangential to the sight line. Non-circular orbital motions then lead to large uncertainties in the derivation of the distance. However, for a source whose galactic orbital motion is mostly directed towards the Earth this uncertainty is greatly diminished. Correspondingly, the source must be close to the Galactic centre, and near to the tangential point of its Galactic orbit, in order for this to apply. We derive a kinematic distance of 8.50.1 kpc for the Eye. The angular separation from the Galactic centre places it pc away from it.
While a kinematic velocity this large is unusual, it is not unique. In the CO J=1–0 line survey of the inner galaxy (Bania, 1980) two high velocity molecular features, at =3575, =0° with VLSR of 210 km s-1 and 190 km s-1 are seen. The line of sight velocity of the Galactic rotation curve peaks at 240 km s-1 at the same galactic longitude (Burton & Gordon, 1978). Several H ii regions have also been identified in the Sgr E region (=3587, =0°), about 200 pc from the Galactic centre, from the Molonglo Observatory Synthesis Telescope (MOST) 843 MHz radio continuum survey (Gray et al., 1993). Radio recombination lines were later measured from many of these sources, and found to have velocities ranging from 200 km s-1 to 215 km s-1 (Cram et al., 1996). Lockman, Pisano, & Howard (1996) have also measured radio recombination lines from two compact sources in the same region and find similar line of sight velocities (at =358797, =+0058, VLSR=207 km s-1 and =358974, =0021, VLSR=193 km s-1). Caswell & Haynes (1987), in a tabulation of the H109 and H110 recombination lines, measured 212 km s-1 for the H ii region G358.623–0.066. Therefore, the identification of the Eye as an H ii region situated at the distance of the Galactic centre, whose line of sight velocity is largely determined by Galactic rotation, seems to be a reasonable one.
3.1.2 The Tornado
The distance to the Tornado Nebula is not so well determined, but the evidence suggests that it is further away than the Eye. H i 21 cm absorption measurements against the Tornado (Radhakrishnan et al., 1972), show a feature at 61 km s-1 associated with the 3 kpc spiral arm (as well as features at 100, 27, 10, +7 and +18 km s-1). This places it further than 5 kpc away. OH(1720 MHz) maser emission has been detected next to one edge of the Tornado (Frail et al., 1996; Yusef-Zadeh et al., 1999), with the interpretation being that this arises from the interaction of a SNR with a molecular cloud. This identification of the Tornado with an OH maser means that the emission velocity, 12.4 km s-1, which is the same as that of one of the CO features along this sight line, can be used to derive a kinematic distance, assuming Galactic rotation. This is 11.8 kpc, taking the far distance, since the near-distance would place it only a few hundred pc away. While the accuracy of this assignment is in some doubt given the proximity of the sight line to the Galactic centre, the emission velocity is very different to that associated with the Eye.
Brogan & Goss (2003) also detected a weak H i absorption feature at 210 km s-1 towards the Head, a similar velocity to the molecular cloud associated with the Eye. The conclusion, therefore, from all these pieces of evidence is that the Eye is most likely foreground of the Tornado Nebula, and that they are unrelated objects. Its striking appearance at the head of the Tornado is simply a chance projection along the line of sight. We therefore consider the Eye and the Tornado to be unrelated objects, and in the rest of this paper we use the data gathered on the Eye to interpret this source.
3.2 Spectral Energy Distribution
Table 1 lists the infrared continuum fluxes for the Eye. These data can be used to estimate the physical conditions of the source, such as it temperature, size and luminosity. We have fitted the mid–IR, far–IR and mm data with a two-component blackbody + greybody of the form888We have not included the near–IR data in the fit because, since the 2 m continuum is morphologically similar to the recombination line data, it most likely arises from scattered flux in, or at the edge of, the ionized cavity and is not re-processed stellar radiation from the dust.
| (1) |
and represent two temperature components to the dust emission, with , being the angular size associated with each component. The dust emissivity for the colder component, (which dominates the flux at sub–mm and longer wavelengths), is given by (), where the optical depth is , with set to 1. Here is the frequency at which the optical depth is unity. is the dust emissivity index, which is uncertain, but thought by most authors to be in the range 1.5 to 2 (see e.g. Chini, Kruegel, & Kreysa, 1986; Dent, Matthews, & Ward-Thompson, 1998). The parameters for the best fit (minimum ) model, after making some plausible estimates on the absolute errors of the MSX and IRAS data, are listed in Table 2. The values, though, should only be regarded as representative, due to both the simplicity of the model and the uncertainties inherent the data. The data are consistent with the luminosity of the Eye being produced by a warm (180 K), unresolved (0.05 arcsec diameter AU @ 8,500 pc) blackbody source, at the core of an extended (2.7 arcsec AU pc), cold (45 K), greybody. The emission is optically thick for wavelengths shorter than 168 m. The spectral energy distribution (SED) for the best fit is shown in Figure 4. We also note that the best fit value determined for the angular size is reasonably close to that measured in the Br and radio images. Since the fit was made to the (unresolved) MSX and IRAS data, this gives some confidence that the model is indeed providing a realistic parameterization of the source. Integrating under the best fit SED gives a total flux of 8.9 W m-2, which, at a distance of 8.5 kpc, implies a source luminosity of 2.0. The cold component dominates the luminosity, providing an order of magnitude more flux than the warmer component. This luminosity is similar to that expected from a B0–B0.5 main sequence star (Panagia, 1973), whose mass is 13 .
The dust emissivity index, , is poorly constrained by the data, with a formal fitted value of 3.6. The lack of detection of the Eye at 1.2 mm, however, implies a particularly steep index, considerably in excess of the typically assumed for grains in dense cores at sub–mm and longer wavelengths (e.g. Ossenkopf & Henning, 1994). However values for of have recently been reported for the Galactic centre region (Pierce-Price et al., 2000) and of in Orion (Lis et al., 1998), so a larger value than 2 is not unexpected. Such high values are generally interpreted as indicating the presence of thick ice mantles around the grains. Whether the emissivity index is as high as 3.6 or not, however, awaits further data at sub–mm and mm wavelengths. It would be premature to use the current data to attempt to constrain the nature of the dust grains in the Eye further.
The SED also allows a crude calculation of the total gas mass to be made. The fit at 185 m, just longward of where the dust becomes optically thin, yields 90 Jy. At this wavelength Ossenkopf & Henning (1994) calculate a dust opacity for grains with thick ice mantles in dense gas, which implies a gas mass (note that we have not used the opacity at 1.2 mm, although this is more normally used to calculate dust masses, because of the uncertainty in the value for the emissivity index, discussed above). This mass is significantly in excess of the stellar mass derived from the luminosity of the source. Furthermore, assuming that the angular size derived for the source (2.7 arcsec) also provides an appropriate scale length for the Eye, then it implies an average density for the gas of 2 cm-3. The column density through the core would then be mags. The Eye contains a dense molecular core, within which lies an embedded, massive young stellar object.
3.3 Recombination Lines
The morphology of the Eye is remarkably similar in the near–IR Br line at 2.17 m and in the radio continuum at 6 cm and 20 cm. There are four knots, of roughly equal brightness, with emission extending between them to form the arc of a circle, 6 arcsec in diameter. Table 3 lists the fluxes from each of the knots. There is no emission detected from the centre of the circle. The nearly equal fluxes at 6 and 20 cm signify a flat-spectrum source, and thus optically thin thermal bremsstrahlung emission from an H ii region (see e.g. Rohlfs & Wilson, 2000). Shaver et al. (1985b) have previously reached the same conclusion from lower resolution data. The radio emission can thus be used to determine the emission measure for the source, and the ratio of the radio to the Br line yields the extinction to it. The similarity between these wavelengths indicates that differential extinction within the source is not significant in determining the H ii region morphology.
The 20 cm flux of 62 mJy determines the emission measure to be 1.1 cm-6 pc, for an assumed H ii region temperature of 10,000 K. This implies an electron density cm-3, assuming the scale length of the emitting region corresponds to the 6 arcsec size of the Eye (i.e. 0.2 pc). If, however, a scale size of 1 arcsec is used, as appropriate to the size of the individual knots, this increases the electron density to cm-3. Nevertheless, this is still very much less than the cm-3 density estimated in §3.2 for the molecular gas. The four emission knots are ionized cavities within the molecular core.
The emission measure determined from the Br line flux, 1.2 cm-6 pc, is an order of magnitude lower than that derived from the radio. Assuming this is the result of extinction, as discussed above, it implies that (i.e. A mag). This value is similar to the average extinction derived for stars in the field based on their near–IR colours (see §2.1). Its level is consistent with that expected towards the central regions of the Galaxy. The bulk of this is not likely to arise from internal extinction within the source.
Correcting for this extinction yields the number of Lyman continuum photons, N s-1, equivalent to a B0 star (Panagia, 1973). This is consistent with the spectral type derived by Brogan & Goss (2003) from their their measurement at 8.3 GHz, as well as from the IR luminosity. If each of the Br knots were separately produced by an ionizing star, they would only be slightly less massive, each still being in the range B0–0.5.
While we have not imaged the He i 2.058 m recombination line, its profile is similar to the Br line. Both lines peak at VLSR= 205 km s-1, and are broad; the Br line has a 40 km s-1 FWHM and the He i line has a 30 km s-1 FWHM. This is also consistent with the measurements of Brogan & Goss (2003) for the 8.3 GHz H92 line ( km s-1, km s-1). The thermal line width for hydrogen at 10,000 K is 21 km s-1 and for helium it is 10 km s-1. This would suggest that there are non-thermal velocities of order 30 km s-1 in the gas in order to produce the observed line widths, possibly the result of turbulent flows within the H ii region. Such line widths are commonly observed in compact H ii regions (Garay & Lizano, 1999), the line width decreasing as the size of the H ii region increases. For sizes of order 0.2 pc turbulent contributions of km s-1 are quite typical for compact H ii regions, numbers which these measurements of the Eye are consistent with. The virial mass derived for the core from these line widths, (with V in km/s and R in pc; Garay & Lizano (1999)) is considerably in excess of the estimated core mass from the dust emission. However, given these turbulent velocities, virial equilibrium cannot be expected to hold and so this value does not provide an estimate for the mass of the core.
The He i/Br intensity ratio is 0.7. In principle, this ratio can be used to estimate the effective temperature of the ionizing star, since it related to the size of the inner He+ zone compared to the H+ zone within the H ii region (e.g. Doyon, Puxley, & Joseph, 1992), which is directly related to the hardness of the UV spectrum of the star. Model calculations show that for a B0 star this ratio would typically be expected to be 0.1; i.e. much smaller than the observed value. However, in high density H ii regions ( cm-3) the 21P level of He i is not just populated by recombination reactions of electrons with He+, but can also be collisionally populated from the 23S triplet state, invalidating simple recombination-based calculations of its line strength (see e.g. Lumsden, Puxley, & Hoare, 2001). The He i/Br line ratio increases sharply once collisional excitation to the 21P level of He occurs. While the line ratio cannot, therefore, be used to quantitatively constrain the stellar temperature, the measured ratio of 0.7 is consistent with excitation of the lines in dense gas ( cm-3), as has been inferred from its emission measure.
4 Discussion
The Eye is a dense molecular core within which a massive star is forming. Its IRAS far–IR colours are log(F100/F60)=0.3, log(F60/F25)=1.3 and log(F25/F12)=0.6. These values place are typical of ultra-compact (UC) H ii regions (e.g. Wood & Churchwell, 1989). The MSX mid–IR colours (, , ) also places the source in the region associated with massive young stellar objects on the criteria developed by Lumsden et al. (2002), with the colours most similar to those of compact HII regions in these authors’ sample. The Eye harbours a compact H ii region, whose ionizing source is also sufficient to account for the IR luminosity. The SED is consistent with a massive embedded source, of luminosity 2 . The CO line-width (10 km s-1) and inferred size (0.1 pc diameter) for the Eye also are quite typical of hot ammonia cores associated with compact H ii regions, and significantly different from what is observed inside dense cores of giant molecular clouds (see Garay & Lizano, 1999). These parameters for the Eye are characteristic of a hot molecular core, containing a massive young stellar object at its centre, and harbouring a developing UC H ii region.
Since no central source is visible at 2 m it must be asked whether each of the four H ii knots in fact contains its own central source, or whether there is a single source powering them all? It would appear that the latter is more likely. Each of the knots has similar Br and radio continuum fluxes, and they would need to have similar ionizing fluxes as well as be at much the same evolutionary stage, if they were to be separate sources. Four coeval B0.5 stars, one in each knot, would seem to be rather less likely than a single B0 star, sited at the centre of the four knots. The knots must represent lower density cavities within the molecular core into which the ionizing flux can penetrate without being quenched. It presumably must be a short-lived phase, as the knots will expand rapidly and eventually merge.
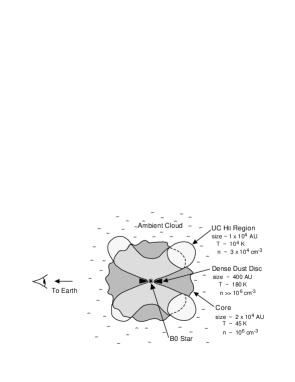
The fit to the SED implies that the warm core ( K) intercepts only around 10% the flux of the central object. This suggests that it either (i) is displaced from the core; (ii) is clumpy with approximately a 10% surface filling factor; or (iii) that it has a non-spherical geometry. We suggest the latter is the most likely scenario. Taking the inferred size from the SED fit, AU, the warm core emission may arise from a flattened, disk-like structure, blocking our direct view to the central source, but allowing that source to illuminate the surrounding gas. The source heats this gas to K. This produces the far–IR thermal emission, coming from a cold core, extending out to AU from the central source. The core is surrounded by a lower density molecular cloud, seen in CO line emission. The four nebulae seen in the Br and radio continuum are ionized cavities, lying between the disk structure and the inside edge of the molecular cloud, and are beginning to break out of the cloud. These cavities have presumably been created by the expansion of the UC H ii region into the cloud core. Figure 5 provides a sketch of this proposed geometry for the Eye.
The Eye may also be an example of an isolated core where massive star formation is occurring. Aside from the measurement of the H92 line (Brogan & Goss, 2003), there is no other evidence for star formation associated with this region. For instance, neither H2O nor CH3OH maser emission has been reported. All the activity appears to be concentrated within a pc diameter region, harbouring a single B0 star, whose mass comprises around 10% that of the gas in its core. Of course, there may also be lower mass stars forming within the core, stars which would still be too faint to be detected. If so, they would comprise a dense stellar cluster, and are not part of an extended star forming region. The Eye appears to represent an example of an isolated massive star formation, which will lead to either a single massive star, or a tight stellar cluster whose luminosity is dominated by a single massive star.
A B0 main sequence star at 8.5 kpc would have a -band magnitude of 11.4, which is more than 5 magnitudes brighter than the upper limit obtained for the flux of any source at the centre of the Eye. This implies that A mag, a figure consistent with the column density derived for the core in §3.2.
5 Conclusions
The Eye and the Tornado are two separate sources, with the Eye being located at the same distance as the Galactic centre, and the Tornado perhaps 12 kpc away from the Sun. Their apparent connection is simply a chance alignment along our line of sight. The Eye’s infrared luminosity, 2, suggests it harbours a massive protostellar source, perhaps a B0 star (13 ). It is deeply embedded within a dense, compact, cold molecular core, whose emission is dominated by greybody emission from gas at 45 K. The core is 0.1 pc in diameter, and there is no evidence for star formation outside it. A hotter ( K), disk-like structure, AU in diameter, may enclose the central source, blocking it from our direct view. We cannot tell whether lower mass stars are forming within the core, but nevertheless the Eye appears to represent an example of isolated massive star formation, with just a single massive star in the process of formation.
There are several observations that could examine the suggestion of an isolated massive star formation made here in more detail. Observations of the sub–mm and mm-wavelength continuum could be used to verify, or otherwise, the validity of the greybody fit to the infrared data, and then be used to provide direct constraints on the mass, of the core. In particular, they could be used to investigate whether the steep dust emissivity index inferred here is indeed correct. Diffraction-limited mid–IR observations with current 8 m-class telescopes could be used to investigate the nature of the central source. Yielding spatial resolution, this would determine whether there is one or more powering sources for the Eye, and provide better constraints on its SED and evolutionary state. The dense molecular core may represent a cold core, soon after it has started warming up, and in the process of turning into a hot molecular core (e.g. Kurtz et al., 2000). Such cores display a rich chemistry, and it would be worth targeting the Eye with millimetre and sub-millimetre spectrometers in order to determine the chemical state and degree of excitation of its gas.
Acknowledgments
We thank Ngoc-Thu Hoang and Ron Stewart for contributing to the early part of this work, Tom Geballe for explaining what the high-velocity ‘features’ in the Br profile were, Miller Goss for pointing us to references which proved invaluable in the interpretation of our data, and Guido Garay for some insightful discussions about H ii regions. Sandy Leggett also obtained the UKIRT data for us, as part of service observations with that facility.
References
- Allen et al. (1993) Allen, D. A. et al. 1993, Proceedings of the Astronomical Society of Australia, 10, 298
- Bania (1980) Bania, T. M. 1980, ApJ, 242, 95
- Becker & Helfand (1985) Becker, R. H. & Helfand, D. J. 1985, Nature, 313, 115
- Brogan & Goss (2003) Brogan, C. L. & Goss, W. M. 2003, AJ, 125, 272
- Burton & Gordon (1978) Burton, W. B. & Gordon, M. A. 1978, A&A, 63, 7
- Caswell & Haynes (1987) Caswell, J. L. & Haynes, R. F. 1987, A&A, 171, 261
- Caswell et al. (1980) Caswell, J. L., Haynes, R. F., Milne, D. K., & Wellington, K. J. 1980, MNRAS, 190, 881
- Caswell et al. (1989) Caswell, J. L., Kesteven, M. J., Bedding, T. R., & Turtle, A. J. 1989, Proceedings of the Astronomical Society of Australia, 8, 184
- Chini, Kruegel, & Kreysa (1986) Chini, R., Kruegel, E., & Kreysa, E. 1986, A&A, 167, 315
- Clark & Caswell (1976) Clark, D. H. & Caswell, J. L. 1976, MNRAS, 174, 267
- Cram et al. (1996) Cram, L. E., Claussen, M. J., Beasley, A. J., Gray, A. D., & Goss, W. M. 1996, MNRAS, 280, 1110
- Dent, Matthews, & Ward-Thompson (1998) Dent, W. R. F., Matthews, H. E., & Ward-Thompson, D. 1998, MNRAS, 301, 1049
- Doyon, Puxley, & Joseph (1992) Doyon, R., Puxley, P. J., & Joseph, R. D. 1992, ApJ, 397, 117
- Frail et al. (1996) Frail, D. A., Goss, W. M., Reynoso, E. M., Giacani, E. B., Green, A. J., & Otrupcek, R. 1996, AJ, 111, 1651
- Gaensler et al. (2003) Gaensler, B. M., Fogel, J. K. J., Slane, P. O., Miller, J. M., Wijnands, R., Eikenberry, S. S., & Lewin, W. H. G., 2003 ApJ, submitted
- Garay & Lizano (1999) Garay, G. & Lizano, S. 1999, PASP, 111, 1049
- Gray et al. (1993) Gray, A. D., Whiteoak, J. B. Z., Cram, L. E., & Goss, W. M. 1993, MNRAS, 264, 678
- Helfand & Becker (1985) Helfand, D. J. & Becker, R. H. 1985, Nature, 313, 118
- Hoang (1995) Hoang, N.-T., 1995 Honours Thesis, University of New South Wales
- Kurtz et al. (2000) Kurtz, S., Cesaroni, R., Churchwell, E., Hofner, P., & Walmsley, C. M. 2000, Protostars and Planets IV, 299
- Lazendic et al. (2003a) Lazendic, J., Burton, M., Yusef-Zadeh, F., Wardle, M., Green, A., Whiteoak, J., 2003a, to be published in Conference Proceedings of the Galactic Center Workshop 2002, November 3-8, 2002, Kailua-Kona, Hawaii, Astron. Nachr., Vol. 324, No. S1 (2003), Special Supplement “The central 300 parsecs of the Milky Way”, Eds. A. Cotera, H. Falcke, T. R. Geballe, S. Markoff (astro-ph/0304329)
- Lazendic et al. (2003b) Lazendic, J. S., Wardle, M., Burton, M., Yusef-Zadeh, F., Green, A. J., Whiteoak, J. B., 2003b, to be submitted to MNRAS
- Lis et al. (1998) Lis, D. C., Serabyn, E., Keene, J., Dowell, C. D., Benford, D. J., Phillips, T. G., Hunter, T. R. & Wang, N., 1998, ApJ, 509, 299
- Lockman, Pisano, & Howard (1996) Lockman, F. J., Pisano, D. J., & Howard, G. J. 1996, ApJ, 472, 173
- Lumsden et al. (2002) Lumsden, S. L., Hoare, P. J., Oudmaijer, R. D. & Richards, D. 2002, MNRAS, 336, 621
- Lumsden, Puxley, & Hoare (2001) Lumsden, S. L., Puxley, P. J., & Hoare, M. G. 2001, MNRAS, 328, 419
- Milne (1979) Milne, D. K. 1979, Australian Journal of Physics, 32, 83
- Mountain et al. (1990) Mountain, C. M., Robertson, D. J., Lee, T. J., & Wade, R. 1990, in Crawford D. L., ed., Proc. SPIE Vol. 1235, Instruments in Astronomy VII. SPIE, Bellingham, p.25
- Najarro et al. (1994) Najarro, F., Hillier, D. J., Kudritzki, R. P., Krabbe, A., Genzel, R., Lutz, D., Drapatz, S., & Geballe, T. R. 1994, A&A, 285, 573
- Ossenkopf & Henning (1994) Ossenkopf, V. & Henning, Th., 1994, A&A, 291, 943
- Panagia (1973) Panagia, N., 1973, AJ, 78, 9
- Pierce-Price et al. (2000) Pierce-Price, D., Richer, J. D., Greaves, J. S., Holland, W. S., Jenness, T., Lasenby, A. N., White, G. J., Matthews, H. E., Ward-Thompson, D., Dent, W. R. F., Zylka, R., Mezger, P., Hasegawa, T., Oka, T., Omont, A. & Gilmore, G., ApJL, 545, L121
- Radhakrishnan et al. (1972) Radhakrishnan, V., Goss, W. M., Murray, J. D., & Brooks, J. W. 1972, ApJS, 24, 49
- Rohlfs & Wilson (2000) Rohlfs, K. & Wilson, T.L., 2000, in Tools of Radioastronomy, Springer (Berlin)
- Shaver et al. (1985a) Shaver, P. A., Salter, C. J., Patnaik, A. R., van Gorkom, J. H., & Hunt, G. C. 1985a, Nature, 313, 113
- Shaver et al. (1985b) Shaver, P. A., Pottasch, S. R., Salter, C. J., Patnaik, A. R., van Gorkom, J. H. , & Hunt, G. C. 1985b, A&A, 147, L23
- Shull, Fesen, & Saken (1989) Shull, J. M., Fesen, R. A., & Saken, J. M. 1989, ApJ, 346, 860
- Stewart et al. (1994) Stewart, R. T., Haynes, R. F., Gray, A. D., & Reich, W. 1994, ApJL, 432, L39
- Weiler & Panagia (1980) Weiler, K. W. & Panagia, N. 1980, A&A, 90, 269
- Wood & Churchwell (1989) Wood, D. O. S. & Churchwell, E. 1989, ApJS, 69, 831
- Yusef-Zadeh et al. (1999) Yusef-Zadeh, F., Goss, W. M., Roberts, D. A., Robinson, B., & Frail, D. A. 1999, ApJ, 527, 172
| Wavelength | Flux | Source |
|---|---|---|
| 1.25 m | 1.2 Jy | This work, IRIS ( limit) |
| 1.65 m | 1.8 Jy | This work, IRIS ( limit) |
| 2.12 m | 4 Jy | This work, IRIS |
| Br (2.17 m) | 6.3 W m-2 | This work, IRIS |
| 8.3 m | 0.7 Jy | MSX |
| 12 m | 1.7 Jy | IRAS |
| 12.1 m | 0.8 Jy | MSX |
| 14.6 m | 3.9 Jy | MSX |
| 21.3 m | 3.5 Jy | MSX |
| 25 m | 6.1 Jy | IRAS |
| 60 m | 119 Jy | IRAS |
| 100 m | 233 Jy | IRAS |
| 1.2mm | 3.9 Jy | This work, SIMBA ( limit) |
| 6 cm | 7.6 Jy | This work, VLA |
| 20 cm | 6.2 Jy | This work, VLA |
All fluxes are for the continuum, except for the Br line. Note that the 2.12 m continuum flux, as well as the Br line and radio continuum fluxes listed, are associated with the H ii region and not with the re-processed stellar radiation from the dust.
| Parameter | Description | Best Fit Value | Range |
|---|---|---|---|
| Hot component | 181 K | 175 to 187 K | |
| Angular diameter | 0047 | 0039 to 0055 | |
| Cold Component | 44.5 K | 43.6 K to 46.2 K | |
| Angular diameter | 27 | 24 to 32 | |
| Frequency where | 1.8 Hz ( 168 m) | 1.3 to 2.4 Hz | |
| Dust emissivity index | 3.6 | 3.0 to |
Results of fit to the mid–IR, far-IR and mm data, of the form with , where is set to 1. and are determined in steradians, but in the table are quoted with the equivalent value of their angular diameter for a circular beam. The best fit gives the values for the parameters that minimises the difference between the model and the data. The range gives the variation that can be made in each parameter, for which the change in from its minimum value is equivalent to a 1 variation, while holding all the other parameters at their best fit values. At a distance of 8.5 kpc, 1 arcsec is equivalent to 0.04 pc.
| Knot | Br | 6 cm | 20 cm |
|---|---|---|---|
| (W m-2) | (mJy) | (mJy) | |
| South | 1.4 | 19 | 15 |
| West | 1.1 | 13 | 15 |
| North | 1.2 | 15 | 15 |
| East | 1.2 | 20 | 14 |
| Integrated | 6.3 | 76 | 62 |