An XMM-Newton observation of the galaxy group MKW 4
Abstract
We present an X–ray study of the galaxy group or poor cluster MKW 4. Working with XMM-Newton data we examine the distribution and properties of the hot gas which makes up the group halo. The inner halo shows some signs of structure, with circular or elliptical models providing a poor fit to the surface brightness profile. This may be evidence of large scale motion in the inner halo, but we do not find evidence of sharp fronts or edges in the emission. The temperature of the halo declines in the core, with deprojected spectral fits showing a central temperature of 1.3 keV compared to 3 keV at 100 kpc. In the central 30 kpc of the group multi-temperature spectral models are required to fit the data, but they indicate a lack of gas at low temperatures. Steady state cooling flow models provide poor fits to the inner regions of the group and the estimated cooling time of the gas is long except within the central dominant galaxy, NGC 4073. Abundance profiles show a sharp increase in the core of the group, with mean abundance rising by a factor of two in the centre of NGC 4073. Fitting individual elements shows the same trend, with high values of Fe, Si and S in the core. We estimate that 50% of the Fe in the central 40 kpc was injected by SNIa, in agreement with previous ASCA studies. Using our best fitting surface brightness and temperature models, we calculate the mass, gas fraction, entropy and mass-to-light ratio of the group. At 100 kpc (0.1 virial radii) the total mass and gas entropy of the system (21013 and 300 keV cm2) are quite comparable to those of other systems of similar temperature, but the gas fraction is rather low (1%). We conclude that MKW 4 is a fairly relaxed group, which has developed a strong central temperature gradient but not a large–scale cooling flow.
keywords:
galaxies: clusters: individual: MKW4 – galaxies: individual: NGC 4073 – X-rays: galaxies: clusters – X-rays: galaxies1 Introduction
MKW 4 is a poor cluster or rich group first identified by Morgan et al. (1975) as part of their sample of cD galaxies in poor clusters. It contains 50 galaxies, and is dominated by the cD/E galaxy NGC 4073. Kinematic studies of the galaxy population shows the galaxies to be fairly evenly distributed about their mean redshift of =0.02, with no sign of substructure (Koranyi & Geller, 2002). There is some sign of spectral segregation, with absorption line galaxies more commonly found toward the centre of the group.
NGC 4073 has an extensive globular cluster population, and shows some signs of having undergone an interaction of some sort in the relatively recent past. It has a counter-rotating stellar core with a significantly lower velocity dispersion. This suggests that the core originated in a lower mass progenitor galaxy (Fisher et al., 1995). The rotation velocity of the galaxy outside the core is low. The luminosity-weighted mean spectroscopic age of the galaxy is 7.5 Gyr (Terlevich & Forbes, 2002). There is no central radio or X–ray source associated with the galaxy, suggesting that any AGN is either dormant or weak.
MKW 4 has been the subject of X–ray studies using Einstein, ASCA and ROSAT, all of which have shown it to be a fairly relaxed system (dell’Antonio et al., 1995; Jones & Forman, 1999), reasonably well modeled by at most two Beta models (Helsdon & Ponman, 2000). The group X–ray halo has a mean temperature of 1.7 keV, placing it at the upper end of the group : relation. Radial temperature profiles show that the temperature increases from 1.3 keV in the core, to a peak above 2.5 keV at 115 kpc and then drops back to a fairly constant temperature of 1.5 keV at higher radii. The ASCA data have been used to produce radial abundance profiles (Finoguenov et al., 2000), which show Fe, Si and S abundances which fall from central values of 0.4-0.7 to 0-0.2 at a radius of 500 kpc. The [Si/Fe] ratio increases with radius, suggesting that in the centre of the group SNIa are the main source of enrichment, while at higher radii only SNII are required. Estimates based on modeling of the ROSAT data give the group a virial radius of 1 Mpc (Helsdon 2002, private communication), assuming isothermality, and =75 . From the galaxy kinematics, the mass within this radius is estimated to be 1-1.51014 (Koranyi & Geller, 2002).
| R.A. (J2000) | 12 03 57.7 |
|---|---|
| Dec. (J2000) | +01 53 18 |
| Redshift | 0.02 km s-1 |
| Distance (=75) | 79.945 Mpc |
| 1 arcmin = | 23.255 kpc |
| NGC 4073 radius | 32.790 kpc |
Until recently, galaxy groups and poor clusters have received relatively little attention. From a practical viewpoint, higher mass clusters are more easily identified in both optical and X–ray surveys, and have relatively high X-ray luminosities which make them more rewarding targets for X-ray observations. However, the majority of galaxies in the Universe are found in galaxy groups (Tully, 1987), and it is likely that a large fraction of the total baryonic mass of the Universe is contained in such systems (Fukugita et al., 1998). Comparisons of the X–ray properties of groups with more massive clusters show that groups cannot be treated as scaled versions of larger systems (Helsdon & Ponman, 2000), and that the change in properties occurs at 2 keV, a typical temperature for rich groups or poor clusters such as MKW 4. Recent studies of low mass systems with XMM-Newton and Chandra have also focussed on the role of feedback and metal enrichment in their evolution (Mushotzky et al., 2003; Buote et al., 2003a; Xu et al., 2002). The low velocity dispersions of less massive systems makes galaxy mergers more likely, and the associated bursts of star formation, galaxy winds and AGN activity are thought to be responsible for much of the enrichment of the intergalactic medium in groups and (through the merger of groups to form larger systems) more massive clusters. Despite these indications of the importance of these systems, the relatively small number of groups and poor clusters which have been studied in detail means that many of the processes which affect them are only now being addressed. Our intention is to present an in-depth analysis of one such system in order to understand its current state and the factors which have affected its development.
In this work we use XMM-Newton data to examine the X-ray structure of the group and its central galaxy. Section 2 describes the observation and data reduction techniques used. Section 3 covers our analysis of the surface brightness distribution of the group halo, while Sections 4 and 5 detail our spectral analysis of the data from the EPIC and RGS instruments respectively. In Section 6 we discuss our results and conclusions. Throughout this work we assume =75 , =0.3 and =0.7. Abundances are quoted relative to the solar ratios given in Anders & Grevesse (1989). This makes comparison with previous studies simple, but we note that more recent abundance ratios are likely to be more accurate. In particular, the Fe/H ratio given by Grevesse & Sauval (1998) is somewhat lower (Fe/H=3.210-5 compared to 4.710-5) than the older value used by Anders & Grevesse (1989), which indicates that our Fe abundances are underestimated by a factor of 1.4 compared to those calculated using the more recent ratios. It is important to note this difference when comparing our results with those of other authors.
2 Observation and Data Reduction
MKW 4 was observed with XMM-Newton during orbit 373 (2001 December 21) in two exposures of 16000 and 4500 seconds. The EPIC MOS and PN instruments were operated in full frame and extended full frame modes respectively, with the medium filter. A detailed summary of the XMM-Newton mission and instrumentation can be found in Jansen et al. (2001, and references therein). The raw data from the EPIC instruments for the longer of the two exposures were processed with the publicly released version of the XMM-Newton Science Analysis System (sas v.5.3.3), using the epchain and emchain tasks. After filtering for bad pixels and columns, X–ray events corresponding to patterns 0-12 for the two MOS cameras and patterns 0-4 for the PN camera were accepted. Investigation of the total count rate for the field revealed a short flare at the beginning of the observation. Times when the total count rate deviated above the mean by more than 3 were therefore excluded. The effective exposure times for the MOS and PN cameras were 14.1 and 10.5 ksec, respectively. Images and spectra were extracted from the cleaned events lists with the sas task evselect.
The reduction of the RGS data was performed using rgsproc-1.3.3 and the sub-tasks within, with the position of the centre of MKW4 implicitly defined as the target of the analysis. A significant amount of background flaring is seen in the RGS datasets, with quite a high general rate seen in the earlier exposures (S001/S002) and a very bright, short-duration flare seen in the later exposures (S004/S005). The event sets were filtered via GTI files to remove these high-background times. This was performed within the ‘filter’ stage of rgsproc. The remaining good times amounted to approximately 17.0 and 16.9 ks for the RGS1 and RGS2 instruments respectively.
3 EPIC Imaging Analysis
We initially prepared an exposure and vignetting corrected mosaiced image of the group, combining data from the PN and both MOS cameras. We adaptively smoothed this image using the sas task asmooth, with a signal-to-noise ratio of 10. The resulting image, overlaid with optical contours, can be seen in Fig 1.
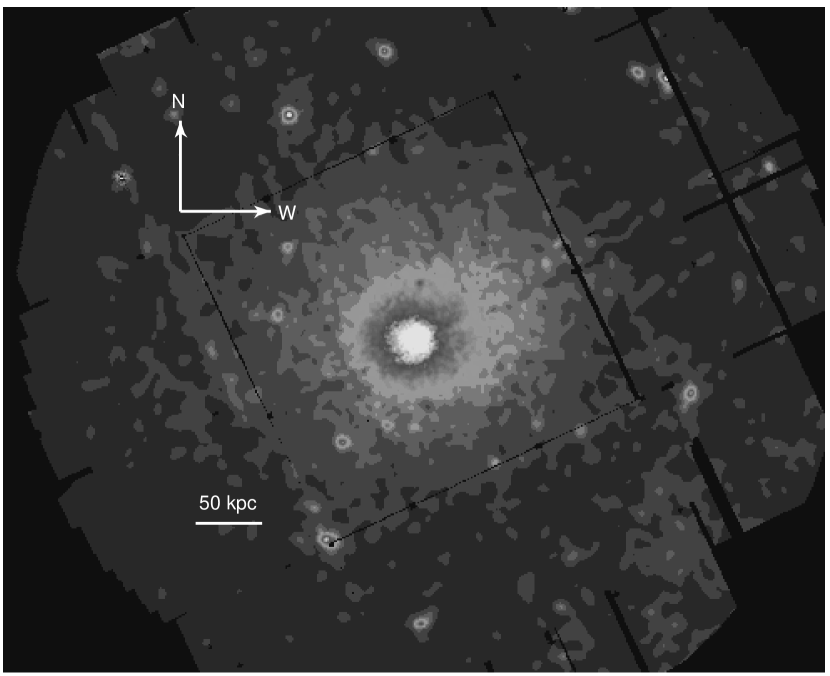
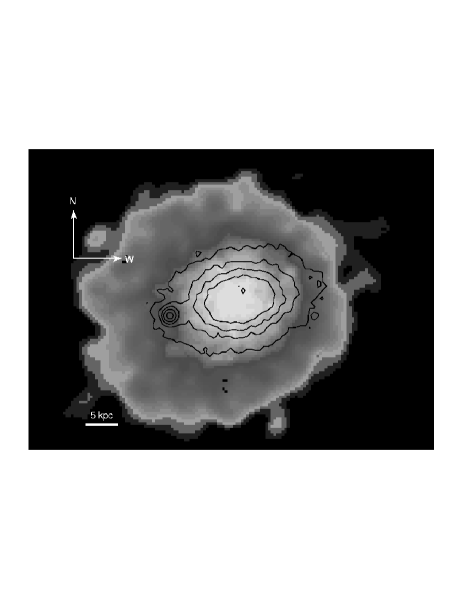
From this image, it is clear that the group emission is extended and relatively smooth, with no major structures evident. The dominant galaxy of the system, NGC 4073, lies at the peak of the X–ray emission, and is aligned roughly along the longer axis of the X–ray emission. At small scales, we do see some features in the X–ray emission in and around NGC 4073. Figure 2 is an adaptively smoothed MOS 1+MOS 2 image of the central part of the group, with optical contours of NGC 4073 superimposed. A number of small linear or arcing structures can be seen, and examination of an unsmoothed image suggests that these features are statistically significant and likely to be real. Further investigation of these features with Chandra (which observed MKW 4 with ACIS-S on 2002-11-24) might provide some clue to their nature. We do not see any evidence of an AGN, such as a central point source, in the galaxy.
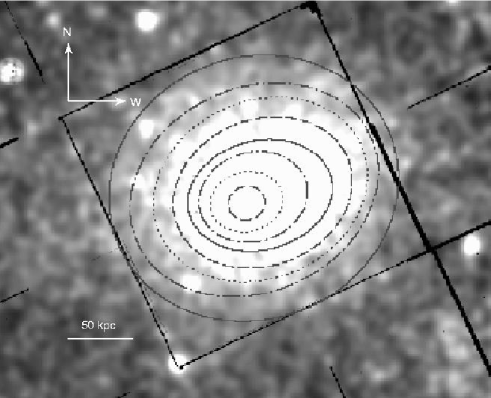
On larger scales, the group X–ray halo does not appear to follow a simple elliptical form. The emission is clearly more extended to the north-west than it is to the south-east. In order to parameterize this difference, we decided to use the iraf task ellipse to fit isophotal ellipses to the halo emission. To prevent the fitting being influenced by regions of lower surface brightness caused by chip gaps on the detectors, we used a mosaiced image containing data from the two MOS cameras only, again adaptively smoothed to a signal-to-noise ratio of 10. The results of this fitting can be seen in Fig 3.
The ellipses fit by the task have ellipticities, position angles and centroids which vary with radius. The group halo is clearly not well described by any simple elliptical model. Subtraction of a model based on the fitted ellipses left no significant residuals with the exception of those caused by point sources in the field.
In order to model the surface brightness distribution, we produced images for use in the ciao sherpa fitting software. Data from each camera were used to generate images in five energy bands (0.2-0.5, 0.5-2.0, 2.0-4.5, 4.5-7.5 and 7.5-12.0 keV). These were then searched for point sources using the sas sliding-cell detection task eboxdetect. The source lists for each band were compared and combined to produce a final source list for the field. Circular regions of 17′′ radius were defined at each source position (except the centre of the group halo) and excluded from all further analysis. We then prepared images for each camera in a 0.5-3.0 keV band, chosen to maximize signal-to-noise, binned to give 4.4′′ pixels. Images were trimmed to include only a circular region of radius 465′′ centred on the peak emission. This is the maximum radius at which we estimate that we can detect emission at more than 3 significance above the background. We also used the sas task calview to produce on-axis PSF images for this energy band for each camera, and binned these to the same pixel size.
We produced background images for use with this data based on the blank-sky datasets provided by Lumb (2002) and the CLOSED datasets provided by Marty et al. (2002). The overall background for any EPIC observation depends on a number of factors, including the particle flux, the position of the region of interest on the detector and the pointing of the telescope (owing to the possibility of soft galactic emission in the field of view). We therefore use the blank-sky and CLOSED datasets to perform a “double-subtraction” of the background (Arnaud et al., 2002; Pratt et al., 2001). This involves identifying three main background components. The first, the particle background, can be subtracted using the CLOSED data, scaled to match the other datasets by comparing events recorded outside the field of view of the cameras. Once this component is accounted for, a “non-particle” background can be found by subtracting the scaled particle background from the blank-sky data and scaling the result to match the exposure of the source observation. A final component is associated with soft galactic emission. As the blank-sky data is unlikely to have the same contribution from this source as the observation, comparison of source-free regions in the two datasets should show a difference in count rates at low energies, sometimes referred to as a “soft excess”. A combination of the three components produces background images for all three cameras, binned to match the pixel scale of our source images.
As our images of MKW 4 have low numbers of counts in many pixels, and further binning would affect the accuracy of our determination of core radius, we used the Cash statistic (Cash, 1979) to measure the (relative) accuracy of our surface brightness models. This requires us to model the background, and we use flat models, with the normalisation free to vary independently for each camera. This will introduce some inaccuracies, as the background is not flat. However, the variation relative to the source is small, and using a background model allows us to effectively ignore small variations in the background data sets.
We initially attempted to simultaneously fit these images with a variety of model combinations (e.g. single beta model, beta+beta, beta+point source, etc. ), using sherpa. The Cash statistic gives no absolute measure of the goodness of the fit. However, examination of residual images and azimuthally averaged radial profiles showed that the fits were poor. Specifically, we were unable to fit the halo with a model of the form used by Helsdon & Ponman (2000), an extended elliptical beta model with an inner circular beta model representing a central cooling region. We conclude that this difficulty is a product of the surface-brightness distribution of the X–ray halo, and that the halo is not well described by any of the models we used.
As the halo is not well modeled as a whole, we decided instead to model sectors of the halo individually. We selected four sectors, covering the major and minor axes of the halo. The SE sector was chosen to be narrower than the other regions (50∘ rather than 90∘) so as to avoid two bright point sources which lie in the quadrant. The quadrants are defined in Table 2.
The NW and SE sectors are those in which we expected to find strong deviations from a simple Beta model fit, as these lie along the axis on which the group is most elongated. We used a mosaiced image constructed from 0.5-3.0 keV images from the two MOS cameras to produce 1-dimensional surface brightness profiles for each sector. Each quadrant was split into 28 annular bins of width 11′′, and the resulting profiles fitted with beta models. Our intention at this stage was to test whether each quadrant could be fitted by models with reasonable parameters, not to produce accurate models of the halo. The fits do not take account of the effects of the PSF, and a constant background level of 0.038 counts/arcsecond2 (0.5-3.0 keV) was used in each case. Single component fits to the SE and NW sectors produced poor results, and we added a second Beta model in each case. However, the SW and NE sectors are well fit by a single Beta model, and have similar values of core radius and . Figure 4 shows the fits to the four quadrants, and Table 2 lists the best fit parameters.
| Quadrant | Angle | Rc,1 | Rc,2 | ||
|---|---|---|---|---|---|
| (∘) | (kpc) | (kpc) | |||
| NE | 340-70 | 4.42 | 0.45 | - | - |
| SE | 90-140 | 3.76 | 0.43 | 127.86 | 8.43 |
| SW | 160-250 | 5.17 | 0.47 | - | - |
| NW | 250-340 | 6.77 | 0.56 | 102.31 | 0.74 |
In order to model the emission accurately in the NE & SW quadrants, taking into account the effect of the PSF, we again performed a 2-dimensional fit, as described above, this time excluding all data outside the NE and SW sectors. A single Beta model produced an adequate fit to the data, with a core radius of 11.49′′ (equivalent to 4.44kpc) and =0.4470.001 (1 errors). Note that the very small errors on these parameters are purely formal, and do not take of account of systematic errors arising from (for example) our use of a flat model to describe the background. However, the 2-dimensional fit parameters are very similar to those found in the separate 1-dimensional fits to the NE and SW quadrants, leading us to believe that these fits are stable and accurate.


4 Spectroscopy with EPIC
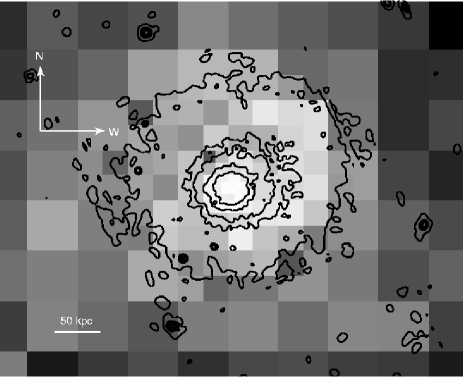
In order to examine the large scale structure of the group, we produced combined MOS and PN images in the 0.2-1.7 keV and 2.0-7.0 keV bands. We then used these images to produce an adaptively binned hardness image (Figure 5), using the publicly released software of Sanders & Fabian (2001). As expected, this showed an increase in spectral hardness with radius, with a distribution similar to the group surface brightness. No major deviations from this distribution were apparent, except in areas likely to be affected by the PN chip gaps. We conclude from this result that the temperature structure of the group is fairly simple, and move on to spectral fitting.
The events lists used in creating the source and background spectra were filtered using the sas command evselect with the expression ‘(FLAG == 0)’ to remove all events potentially contaminated by bad pixels and columns. All data within 17′′ of point sources were also removed, excluding the false source detection for the core of NGC 4073. We allowed the use of both single and double events in the PN spectra, and single, double, triple and quadruple events in the MOS spectra. The background spectra were created by a method analogous to that used for the spatial background files, described in the Section 3. The same region used to extract the source spectrum was used to extract a spectrum from the blank sky background data and scaled to match the exposure time of the source spectrum. A ’soft excess’ spectrum was then produced based on a large radius source-free region of the source dataset, and added to the background after appropriate scaling for area. Response files for each spectrum were generated using the arfgen and rmfgen commands in sas. The data from each camera were binned to a minimum of 20 counts per bin, and simultaneous fitting of all three cameras was carried out in xspec.
We extracted spectra from a circular region of 2′ (46.5 kpc) radius, centred on the point of highest surface brightness. This region was chosen to maximize the signal-to-noise ratio of the spectra, and to include the high surface brightness core of the group. We ignored data below 0.2 keV and above 8.0 keV so as to minimise the use of data where the calibration is uncertain. We then fit a series of models to the data, starting with simple single temperature MEKAL (Liedahl et al., 1995; Kaastra & Mewe, 1993) and APEC (Smith et al., 2001) models and moving on to multi-temperature and cooling flow models. Table 3 shows the results of the spectral fits. Single temperature fits did not successfully model the spectra, as the continuum above 3 keV was significantly underestimated. Two-temperature fits do not constrain the temperature of the hotter component well, and have poorly constrained metallicities unless the metallicity is equal in the two components, as is the case in the APEC+APEC model shown in the table. The hot component is more successfully modeled using a powerlaw or high temperature bremsstrahlung component, although these may also be poorly constrained. The best fit was attained using an APEC+Powerlaw model in which O, Si, S and Fe were allowed to vary independently and all other metals varied collectively. The MKCFLOW cooling flow model was a very poor fit to the data, and allowing individual elemental abundances to vary (VMCFLOW) did not lead to a satisfactory fit. The CEMEKL (and CEVMKL) model, which models a multi-temperature gas where the variation of emission with temperature follows a powerlaw, provided a much better “cooling gas” fit. We note that the APEC model gave a slightly better fit in most cases than an equivalent MEKAL model, but that the difference in fit statistic and parameters was generally fairly small. Replacing the APEC model in the fits shown by a MEKAL model generally did not affect the results significantly. We also note that although the fits shown have hydrogen column free to vary; holding it fixed at the galactic column (1.891020 cm-2) generally affected the results by only a few percent.
| Model | Parameters | red. | d.o.f | |||
|---|---|---|---|---|---|---|
| MEKAL | 4.040.34 | kT=1.730.03 | Z=0.76 | 1.554 | 802 | |
| APEC | 4.03 | kT=1.780.03 | Z=0.81 | 1.543 | 802 | |
| APEC+Powerlaw | 3.87 | kT=1.600.02 | Z=0.680.06 | =0.85 | 1.141 | 800 |
| APEC+APEC | 3.21 | kT=1.580.02 | Z=0.83 | kT=64 | 1.157 | 800 |
| VAPEC+Powerlaw | 3.65 | kT=1.600.02 | Zavg=0.70 | =0.52 | 1.074 | 796 |
| Fe=0.560.05 | ||||||
| Si=0.780.12 | ||||||
| S=0.69 | ||||||
| O=0.290.11 | ||||||
| MKCFLOW | 2.12 | Tmax=3.71 | Ṁ=12.12 | Tmin=0.35 | 3.103 | 801 |
| Z=2.76 | ||||||
| VMCFLOW | 1.61 | Tmax=3.72 | Ṁ=12.50 | Tmin=0.45 | 2.342 | 797 |
| Zavg=4.00 | ||||||
| Fe=2.557 | ||||||
| Si=4.57 | ||||||
| S=3.23 | ||||||
| O=1.25 | ||||||
| CEMEKL | 2.92 | Tmax=2.240.07 | Z=1.13 | =4.23 | 1.300 | 801 |
| CEVMKL | 2.29 | Tmax=2.310.07 | Zavg=1.37 | =3.96 | 1.190 | 797 |
| Fe=1.26 | ||||||
| Si=1.66 | ||||||
| S=1.28 | ||||||
| O=0.58 | ||||||
We also carried out similar fits to a smaller region of radius 75′′, again centred on the peak in surface brightness. These fits produced similar results to those for the large region, with single-temperature models providing poor fits and two- or multi-temperature models favoured. We again found that the best fit was produced by an APEC+Powerlaw model, with somewhat higher abundance and lower temperature, as expected. Cooling flow models were poorer fits in this region, and the difference in fit quality between the CEVMKL model and the best fitting model was more marked. This suggests that even in the central regions, a cooling flow model may not be the best description of the state of the gas.
4.1 Radial profiles
Figure 6 shows projected temperature, metal abundance and absorption profiles for the group. Spectra were extracted in circular annuli of varying width, and fit using an absorbed MEKAL model in a 0.4-4.0 keV energy band. We initially fit with hydrogen column frozen at the mean galactic value, and then refit with the column free to vary. Annuli were chosen to have a minimum width of 30′′, so as to avoid under-sampling the PSF (at least in the core), and to have at least 6000 counts per annulus.
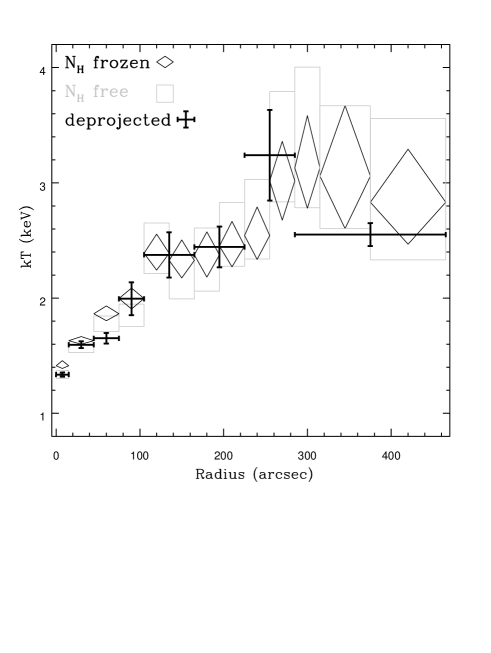
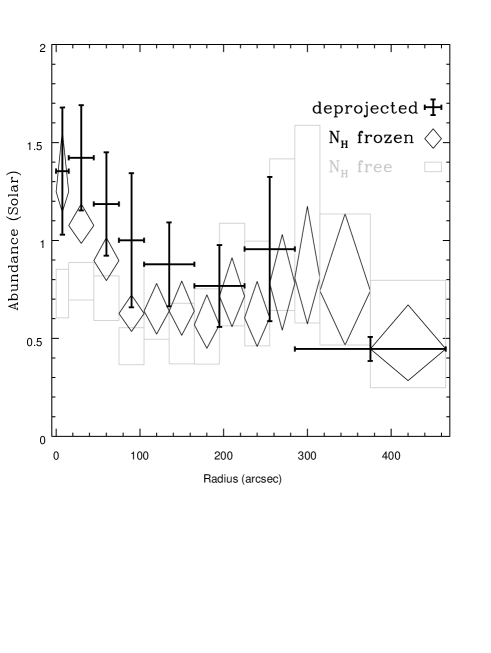
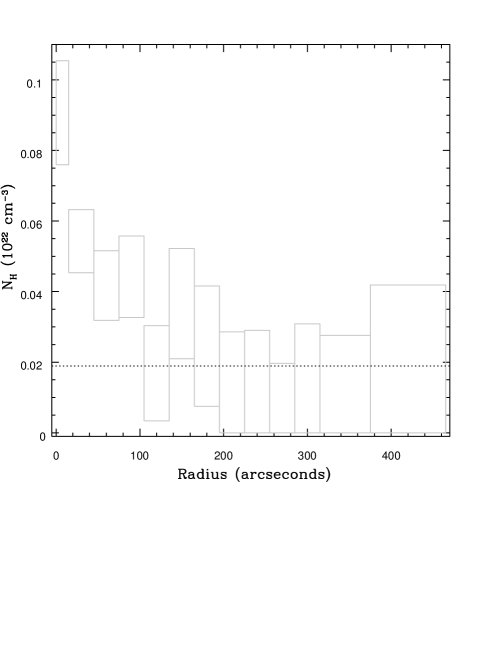
The temperature profile shows a fairly smooth increase in temperature with radius, with a possible peak at 300′′, and either a falling or constant temperature outside this radius. This is consistent with ROSAT results which show the same peak, and fall to a temperature of 1-2 keV at larger radii (Helsdon & Ponman, 2000). The temperature profile is not significantly affected by freeing , except in the two central bins, where kT drops slightly. Metal abundance, on the other hand, is strongly affected by hydrogen column. If is frozen at the galactic value, the abundance is fairly constant (within errors) outside 75′′, but shows a sharp rise to 1.25 in the central bins. If is allowed to vary, the central metal abundance is comparable to the values measured at higher radii, but the central absorption column rises to 4.5 times the galactic value. Although the calibration of the EPIC instruments is imperfect at low energies, and could in principle affect the fitted value of , we note that our lower cutoff energy of 0.4 keV should allow us to avoid major calibration uncertainties. We therefore assume that the high values of do not arise from poor calibration.
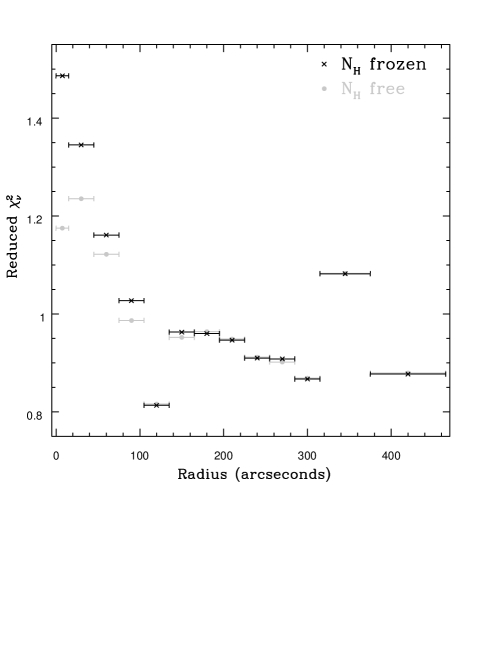
The quality of the fit is acceptable in all but four of the bins. In Bin 12 the poor fit seems to arise from a poorer than expected signal-to-noise ratio for the PN spectrum. The reason for this is unclear, as there are 4400 source counts in the PN spectrum (compared to 4100 for the combined MOS1+2 spectra), and inspection of region from which the spectrum is extracted suggests that we have thoroughly removed all point sources. Fitting data from the two MOS cameras without the PN results in fits which agree reasonably well with those for all three cameras, but with somewhat larger errors (T=3.06, Z=0.57). The reduced for the fit is 1.016, with 98 degrees of freedom. The central three bins are also rather poorly modeled by the single-temperature model, though there is a significant improvement when hydrogen column is allowed to vary. The poor fits in these bins seem to be an indication of the complex nature of the emission. To test the accuracy of the single temperature fits we tried fitting more complex models in each of the three bins. In each case we tried MKCFLOW, CEVMKL, MEKAL+Powerlaw and MEKAL+MEKAL fits, in the last case tying the metal abundances of the two components together and holding the higher temperature at 2.3 keV. This temperature was chosen to match that in the bins between 100-200′′. We used the F-statistic to test for significant improvements over the single temperature model. In all cases the CEVMKL model was a better fit that the single temperature model, while the MKCFLOW was always a poor fit. The powerlaw slope of the emission measure used in the CEVMKL model was very steep in all three bins ( in the range 4.5-6.0, with 90% upper limits as high as 9.4), indicating the lack of gas at very cool temperatures. Fits in bins 1 and 3 were also improved by using a 2-T MEKAL model, while the MEKAL+Powerlaw was poorly constrained in all cases, providing no superior fits. The low temperature components of the 2-T models had temperatures of 1.17 keV, 1.43 keV and 1.22 keV for bins 1, 2 and 3 respectively (90% errors). These temperatures again argue for a lack of gas at low temperatures. We also note that the abundances derived, while more poorly constrained, agree well with those found for the single temperature models.
Previous work using ASCA has shown that the relative abundances of Fe and Si change with radius in MKW4 (Finoguenov et al., 2000). Although our data do not extend to as large a radius as the ASCA study considers, it is ideally suited to examining the variation of individual metals near the core of the group, and within NGC 4073. Using the VMEKAL model in xspec we are able to fit Fe, Si and S individually, as well as the abundance of remaining metals and the temperature in each bin. We use larger annular bins to increase the signal-to-noise ratio. Figure 7 shows abundance profiles for Fe, Si and S, shown with reference to the profile for all other metals combined. The hydrogen column was held at the galactic value for these fits. It is clear that the individual metals are consistent with the general fit at large radii, but that Fe and Si have higher abundances in the central two bins. The S abundance is higher than the norm in the innermost bin. It should be noted that the two inner bins cover the region in which NGC 4073 lies, and are therefore likely to contain the most complex emission. We are modeling this with only a single temperature plasma, and fitted parameters are likely to be affected by this over-simplification.

As the temperature profile is fairly smooth, with no major discontinuities, we have also attempted to model the deprojected temperature profile of the group. We again model the emission (in xspec) as an absorbed MEKAL plasma, but use the projct mixing model to take into account the superposition of multi-temperature gas along the line of sight. We assume the halo is spherical. The process of deprojection effectively lowers the numbers of counts in the central bins, so we extract our spectra from slightly wider annuli to increase the signal-to-noise ratio. We again fit each spectrum in the 0.4-4 keV band, and hold the absorption column at the galactic value. We fit each annulus separately, starting with the outermost. Once the temperature and abundance of this annulus are fit, we freeze those parameters and move in to the next annulus. In this manner we fit all eight annuli, with results shown in the upper panels of Figure 6.
The deprojected abundance profile is consistent with the projected profile in all bins except the outermost. This bin is very wide, and while it is consistent with the projected abundance value from 375′′ outward, it is significantly lower than the projected abundance from 285′′ to 375′′. However, the trend for abundance to decrease with radius is clear in both projected and deprojected data. The deprojected temperature profile is also generally consistent with the projected profile, but shows significant differences in two of its eight bins. Although the difference in the 8th (outermost) bin is likely to be caused by the lack of counts available at higher radii and the width of the bin, the difference in the 3rd bin, though small, is likely real. This may be a product of the structure in the halo and our use of circular annuli, as this bin covers the radii at which the surface brightness profiles of the northeast and southwest sectors deviate from a standard beta model. However, in general the consistency between projected and deprojected profiles suggests that the group has a strong peak in surface brightness towards the core, so that emission at any 2-dimensional radius is dominated by the gas within that 3-dimensional radius, not by the outer parts of the halo along the line of sight.
5 Spectroscopy with RGS
The nuclear region of MKW4 is quite bright and, though quite extended, is not too extended to allow a study of the emission with the high spectral resolution RGS instruments (den Herder & et. al., 2001) on board XMM-Newton. The spectral range of the RGS instruments is in fact well suited to the study of the thermodynamic properties of the hot gas within cool clusters and groups. The default RGS pipeline assumes that the target source is point-like. In our analysis, as MKW4 is extended, we assumed a value of 96% for the fraction of the cross-dispersion PSF sampled in the spectral extraction (as opposed to the default value of 90%). Indeed the low surface brightness emission from MKW4 covers the RGS detector to such an extent that the extraction of any reasonably representative non-cluster background spectra was severely hampered. The background spectra were extracted from areas beyond 98% of the cross-dispersion PSF (any larger resulted in background spectra with unreasonably low signal-to-noise statistics).
First- and second-order spectra for RGS1 and RGS2 were extracted from the early (S001/S002) and later (S004/S005) exposures (i.e. 8 spectra in total). It is possible, before attempting any detailed spectral fitting, to combine the spectra, together with the spectral response matrices, into a single spectrum (this is useful for non-analysis purposes to increase the signal-to-noise and to detect faint spectral features). A single fluxed spectrum, in units of photons cm-2 s-1Å-1, was produced from the eight RGS spectra and is shown in Figure 8.

Though we are not able to perform quantitative spectral fits to the fluxed spectrum shown in Figure 8, some conclusions can be drawn directly from the figure.
Ly emission lines of hydrogenic charge states of a number of the abundant low Z elements, particularly O and Ne (though some contribution from Fe is likely here), are seen in the RGS spectrum, as are helium-like charge states of a number of elements. Also present are neon-like and fluorine-like charge states of iron (FeXII-XIII) and it appears that emission from much of the FeL series is present (especially around 12Å[1 keV], where Ne may also contribute). The fact that lines such as MgXII exist together with lines from much of the FeL series points strongly towards emission from gas over a range of temperatures, rather than emission from a single temperature gas. The presence of the OVII line suggests that some fraction of the gas has a temperature as low as 0.5 keV, but our data do not permit the determination of the amount of gas involved. From the EPIC results, in particular the CEVMKL fit which shows a sharp decline in emission at low temperatures, we assume that the amount must be small.
It was expected, given the fact that the MKW4 emission covers nearly all the RGS detector (hampering the extraction of reasonable background spectra), and that the source is not especially bright, that any detailed spectral modeling of the RGS data would be difficult.
In order to perform detailed spectral analysis, separate response files for each instrument and order (i.e. for each separate spectrum created) were generated using rgsrmfgen-0.50.2 (within rgsproc), using, as is recommended, a large number (4000) of energy bins. These responses were then attached to their relevant spectra and the spectra were individually grouped into xspec-usable spectra with a minimum of 20 counts per bin, a bin typically spanning Å.
The eight spectra (two observations, RGS 1 & 2, orders 1 & 2) were fitted simultaneously using a number of spectral models. In each model a redshift for MKW4 of was used. It is very useful to combine the data in this manner as gaps in the data due to non-functioning CCDs (specifically RGS1 CCD 7 and RGS2 CCD 4) can be filled with data from the other instrument and order(s).
Though a number of the ionization states of the FeL series appear to exist, indicating that the gas may be non-isothermal, we were only able to justify the use a one-component mekal model. Freezing the hydrogen column at the Galactic value yielded a best fit temperature of 1.041.41 keV (1 confidence interval), and a best fit metallicity of 0.270.62 solar. Letting the column free gave a best fit value of (9.819.3) cm-2, with a temperature of 1.021.33 keV and metallicity of 0.190.49 solar.
For comparison with the EPIC fits we tested more complex models, but it should be noted that these produced no significant improvement in the quality of the fit, and often had poorly constrained parameters. Allowing individual elemental abundances to vary did not significantly improve the fits, and the abundances were essentially unconstrained. Fitting a two-temperature MEKAL model with abundances tied resulted in fits very similar to the single-temperature model, with the harder component making little contribution. A CEVMKL model fit gave a similar power-law slope to that seen in the EPIC fits, but with unphysically high abundances. The MKCFLOW model was more successful in fitting the RGS data than the EPIC, but the parameters were effectively unconstrained, and error limits could not be calculated. The minimum temperature found was 0.35 keV with the hydrogen column frozen at the galactic value, and 0.1 keV with allowed to vary. The best fit metal abundance was approximately solar. However, we stress that these fits are only included for comparison, as a the statistics are such that we cannot justify the use of models more complex than a single-temperature plasma model.
6 Three-dimensional halo properties

Using software provided by S. Helsdon, we used the surface brightness fit derived in Section 3 and the projected radial temperature profile shown in Figure 6 to calculate quantities such as gas mass, total mass, gas cooling time and gas entropy for the inner region of the group. In principle we would wish to use a deprojected temperature profile, but in this case the deprojected and projected temperature profiles are similar in the core and the projected profile has more stable fits at large radius. The software we use infers the gas density profile based on the fitted surface brightness profile and a model description of the temperature profile. In this case we model the temperature profile using a quadratic, which is not physically meaningful but gives an accurate estimate of the shape of the distribution. The density profile is normalised by comparison with the X–ray luminosity of the region in question, and scaled appropriately. Given this density profile we can use the well known equation for hydrostatic equilibrium, to calculate the total mass at any given radius.
| (1) |
Entropy is simply defined as S = T/n, where T is the temperature in keV and ne is the electron density of the gas. Figure 9 shows radial profiles for these parameters, as well as gas fraction.
From the cooling time and temperature, we can estimate the rate of cooling at a given radius. This can be used to estimate the timescale on which an isothermal halo, allowed to cool, would assume the temperature profile which we observe. The profile of shows the result of this calculation, where
| (2) |
is temperature and is time. In this case we chose to set =3 keV, the approximate mean temperature in the outer bins of our temperature profile. We note that at all radii is considerably less than 7.5 Gyr, the approximate time since the last major merger of the dominant galaxy.
Using the optical surface brightness profile of NGC 4073 measured by Morbey & Morris (1983), we have estimated the mass-to-light profile of the inner part of MKW 4, and the stellar mass contribution. The mass-to-light ratio is 50 / at the limit of the optical measurements. To determine the mass of stars in NGC 4073 we must assume a stellar mass-to-light ratio. We use a value of 5 /, but also show a profile for a value of 8 /. In either case, the mass in stars clearly dominates over the mass in gas to large radii. Within the central 10 kpc, we note that the mass-to-light profile of the group falls below the ratio we have assumed for stars. At this scale the temperature and surface brightness structure of the group is resolved, so the problem is real, and suggests that we are underestimating the mass in the core. One possible reason for this is that the gas in the core may not be in hydrostatic equilibrium, rendering our assumptions invalid. The relatively poor spectral fits achieved in the core may also provide an explanation, if our measured temperatures do not accurately represent the multi-phase gas in this region.
7 Discussion
7.1 Imaging analysis
The halo of MKW 4 is not well described by an elliptical -model within the region we have studied. The emission shows signs of structure along a NW-SE axis, with a bulge in the emission profile to the SE and excess extended emission to the NW. This does not seem to be an “edge”, such as the structures associated with cold fronts in more massive clusters (e.g., Markevitch & et. al., 2000). In this case the decrease in emission is not sharp, with the bulge occuring between 35′′ and 80′′, suggesting that we are not looking at an unresolved sharp-edged feature. It does not correspond to any rapid change in hardness or fitted temperature, at least at the resolution we can achieve with these data. If there were large scale motions in the gas, we might expect to see sharp features at the boundary of the region in motion, and the lack of such features suggests that any motion is relatively minor, and that the halo is likely to be close to hydrostatic equilibrium. One possible cause of large scale gas movement would be the merger of a small subgroup, but this would have to have taken place some time ago for the effects to have died down to the current level. The kinematic data and morphology segregation of the galaxy population also argue against any recent merger, suggesting instead that this system has not been disturbed for a significant period of time.
The surface brightness profile of the NE and SW quadrants is similar and can be modeled with a single -model. We find that a model with 0.45 is a good fit to the data. This value of is fairly typical for galaxy groups of the mass and temperature range in which MKW 4 lies (Sanderson et al., 2003), and compares well with a fit of the inner 6′ of the group using ROSAT data (O’Sullivan et al., 2003). Helsdon & Ponman (2000), again using the ROSAT data but with a much larger region of interest (radius 18′), find that the best fit to the surface brightness distribution is a two component model. The more compact component has =0.730.06, while the extended component has =0.460.01. There is an offset between the two components, leading to the classification of the halo as bimodal. Our region of interest is much smaller than theirs (7.75′ compared to 18′), so we would not necessarily expect to accurately model the extended component of their fit. The difference between their central component and our fit may well be caused to some extent by the halo structure which we have observed and excluded. If the compact component of their fit is required to partially model the halo structure, this would suggest that we should compare our model only to the more extended component of theirs. In this case the two models agree reasonably well. A single beta model fit to the ROSAT data gave =0.43, even closer to our best fit. We conclude that our fit is a reasonable model of the structure-free portion of the inner halo, but note that the ROSAT fit is likely to be more accurate at large radii, owing to the larger field of view.
7.2 Spectral analysis
The spectral fits to the PN and MOS data for the group halo show strong signs that the gas is not well described by a single temperature model within 40 kpc. The existence of low and high energy line emission in the RGS spectra supports this. We do not obtain a statistically acceptable fit to the EPIC spectra with any of the models we have used. Some degree of error is to be expected, arising from inaccuracies or incompleteness in the spectral modeling codes and instrumental responses. There is also the question of background subtraction. The technique we have used to generate our background spectra should provide us with the most accurate estimate of the background available. However, as the process involves scaling and combining a number of spectra from different sources, it is possible that errors could occur and that these could affect our fits. The relatively low level of the background suggests that this is most likely to be a problem in the outer regions of the halo. In the central regions, we tested the effect of varying the background normalisation is various of our fits, and found that it generally has little effect. For example, best fit parameters were not found to change by more than 1% for fits to the five inner bins of our projected radial profile when the then background was varied by 20%. It therefore seems unlikely that errors in the background are a significant source of inaccuracy in the spectra fits. We conclude that our models provide a reasonable approximation of the state of the gas, but the multi-phase structure of the inner halo and (to some extent) the errors associated with the calibration of instruments and spectral models prevents us from truly modelling the the gas accurately.
The RGS instruments are sensitive mainly to the emission from the central bright core of MKW 4. Although there will always be some emission from large radii in the spectrum, we estimate that 90% of the counts in our extraction region are from the central 2′ of MKW 4. The RGS spectral fitting results in terms of gas temperature and metallicity are approximately consistent (to within 1) with the EPIC results from the innermost regions (as would have been expected), the fact that the RGS data yield a slightly lower temperature and metallicity than the EPIC data is very suggestive of problems with the extraction of reasonably representative background RGS spectra. Even at the edge of the RGS chips, it appears that there is sufficient very low-surface brightness emission from MKW4 to contaminate the extracted background spectra significantly. The background spectra have a component of hot (and metal-rich) cluster emission within them, such that the temperatures and metallicities obtained from the spectral fitting of the bright source, using these cluster-contaminated background spectra, are lower than for EPIC. Indeed, experimenting with different values of the percentage of the PSF excluded to create the background spectra showed that, as the background extraction region moved closer to the edges of the detector (and into regions of less cluster-contaminated background), the spectral fitting results tended to and matched those obtained with EPIC for the innermost annuli. As a downside, of course, such a procedure led to background spectra with progressively smaller signal-to-noise ratios, such that the errors on the spectral fitting results became unreasonably large. The results presented here lie somewhere in between, and use a background extraction where the background spectra statistics are still reasonable.
The most successful fits to the EPIC spectra of the central 2′ region region are the ’two-temperature’ APEC+Powerlaw and multi-temperature CEVMKL models. Again, neither of these models is formally statistically acceptable, but this may be caused by calibration and model inaccuracies rather than indicating that the models are not good descriptions of the emission. The difference in abundance between the two demonstrates the difficulty of accurately modelling the system using a single spectrum. Clearly the radial spectral profiles are more reliable in this regard. Of the two, the APEC+Powerlaw appears to be the less likely from a physical perspective. The index of the powerlaw is not particularly well constrained, and seems more likely to be representing some high temperature gas component than to be a product of an AGN or population of discrete sources. The surface brightness models do not require a central point source and there is no detection of AGN activity at other wavelengths. As a further test we have looked for variability in the emission within the central 25′′ of NGC 4073, using light curves for each camera with a bin size of 100s. The PN and MOS 1 cameras show no evidence of variations in count rate larger than 3 from the mean. The MOS 2 camera has 3 bins with count rates greater than the 3 limit, but in general emission from the central region is fairly constant. If we force a MEKAL+powerlaw fit to the two central bins of the temperature profile (see Fig. 6) we find a flux of 2.5810-13 erg s-1 cm-2 (0.2-8.0 keV) for the powerlaw component. This can be considered as an upper limit on the luminosity of any AGN of log 41.29 . For reference, the flux [log ] contribution from the thermal component in the same region is 2.9010-12 erg s-1 cm-2 [42.35 erg s-1] (0.2-8.0 keV). The contribution from X-ray binaries can be estimated by comparison with Chandra results from other early-type galaxies. The : ratios for NGC 720, NGC 4697 and NGC 1553 are 8.1, 7.5 and 7.2 erg s-1 -1 respectively (Jeltema et al., 2003), leading us to derive an X-ray binary contribution of Log = 40.93-40.98 for NGC 4073. A more conservative upper limit on the luminosity of any central source would therefore be Log 41.0 . As a further check on the existence of a central AGN, we tried fitting a surface brightness model to the data including a central point source with this luminosity. Such a fit is poor, with strong residuals in the core. The fit can be improved if the point source normalisation is allowed to fall by 30%, but the residual map suggests that the fit is still worse than that produced by a single beta model.
The CEVMKL model seems a more reasonable choice, suggesting that the halo contains gas at a range of temperatures. However, it is a poorer fit to the data, and the metal abundances required are high compared to the other models and to previous studies with other instruments. The high value of found for this model suggests that there is very little emission at low temperatures. Some confirmation of this can be drawn from the MKCFLOW and VMCFLOW models, which although they are poor fits to the data, do not find emission from gas cooling out of the X–ray regime. The poor results achieved with these models strongly suggest that although the halo contains gas at a range of temperatures, it is not well modeled as a steady state constant pressure cooling flow.
7.3 Abundances profiles and metal masses
The profiles shown in Figure 6 suggest a strong variation in either abundance or hydrogen column near the core of the group. NGC 4073 has a radius of 1.41′, or 32.5 kpc at our assumed distance. This means that the central three bins include emission from NGC 4073. The increase in hydrogen column is a factor of 2 or 3 times the measured galactic value, except in the central bin, where it rises to 4 or 5 times galactic. Such a large increase in arouses some suspicion, given that we necessarily use overly simplistic models to fit gas which is likely multiphase, with gradients in both temperature and abundance. The excess above the galactic column in the four central bins of our projected profile translates to 1.31010 of hydrogen in the central 40 kpc of the system. NGC 4073 has no detected 21 cm emission (Huchtmeier & Richter, 1989), and the upper limit on the mass of neutral hydrogen in the system is 3.55109 (Roberts et al., 1991). This is relatively similar to our result, but even taking the 90% lower limits on our measured we find a mass three times higher than the radio-based upper limit. This strongly suggests our measurements are overestimating the true intrinsic absorption. The fact that the galactic value provides a good fit at higher radii supports this conclusion. Holding the hydrogen column fixed at the galactic level, we find a strong increase in metal abundance in the core. This increase is also quite dramatic, with average abundance rising by a factor of 2. Previous work using ASCA has shown this increase in abundance in the core (Finoguenov et al., 2000). Comparison between our radial fits to individual elements, and those derived from the ASCA data shows good agreement at all radii, except possibly in the central bin, where we find Si and S abundances somewhat in excess of those found using ASCA. If we use finer binning than that shown in Figure 7, we find that the Iron abundance within 15′′ also significantly exceeds the central value derived from the ASCA data. The poor spatial resolution of ASCA necessitated larger radial bins than we have used, so that the two central bins used in Figure 7 are equivalent to the central bin of the ASCA study. It seems clear that the high central abundances we see in the XMM-Newton data were effectively smoothed out by the poorer ASCA spatial resolution.
In each radial bin we can use the gas mass and the abundances of Fe, Si and S to calculate metal masses for each element. For the two innermost bins in Figure 7 we find the masses given in Table 4. These values can be used to calculate the relative contributions to enrichment of the ISM by SNIa and SNII. We assume yields of Si and Fe for type II supernovae of yFe=0.07 and ySi=0.133 (Finoguenov et al., 2000), and from type Ia supernovae yFe=0.744 and ySi=0.158 (Thielemann et al., 1993). We estimate that 49% and 50% of the iron within these regions is injected by SNIa, in fairly good agreement with the peak values calculated based on the ASCA data.
Bin Mass () Fe Si S 1 6.4105 7.2105 3.42105 2 3.43106 3.64106 1.02106
7.4 Comparison with other systems
Several other groups and clusters of comparable temperature have been observed with the XMM-Newton RGS, in general with considerably higher statistics. The best examples are NGC 4636 (Xu et al., 2002), NGC 5044 (Tamura et al., 2003) and M 87 in Virgo (Sakelliou et al., 2002). These objects all show evidence of multi-phase gas in their central regions, but in each case there is a lower limit to the observed temperature range. Gas below this limit is either nonexistent, or present only in very small quantities. The minimum (and maximum) temperatures observed for these objects are 0.6 (1.1), 0.6 (1.8) and 0.53 (0.71) keV for NGC 5044, M 87 and NGC 4636 respectively. The minimum temperatures in each case are quite similar to each other, and to the minimum temperature of 0.5 keV which we infer from the presence of the OVII line in our RGS spectra. The variation in maximum temperatures is larger, but NGC 5044 has a similar maximum temperature to that which we derive from our RGS data (1.2 keV). While the maximum temperature seems likely to be related to the temperature of the large scale halos surrounding each galaxy, and therefore to the mass of each group or cluster, the similarity in minimum temperatures is intriguing. Clearly any models intending to explain the apparent absence of traditional cooling flows in these objects must be able to reproduce this limiting temperature.
XMM-Newton observations of similar systems also show abundance gradients, which are in some ways similar to those in MKW 4. A detailed analysis of the EPIC data for M87 reveals a strong decline in the abundances of Fe, Si, S, Ca and Ar with radius (Matsushita et al., 2003), with abundances falling from 1.5 in the core to 0.5 at a radius of 10′. Only oxygen is relatively constant at all radii. The high central abundances of Si and S are quite comparable to those we observe in MKW 4, but it is notable that in M87 Si, S and Fe share similar radial abundance profiles and have similar abundances at all radii.
An observation of NGC 5044 with the RGS (Tamura et al., 2003) shows some evidence of Si abundance in excess of Fe, though it is consistent with a solar ratio when the estimated systematic errors are accounted for. Buote et al. (2003a), using spectra from the EPIC instruments and the Chandra ACIS-S3 find similar results. Single temperature fits show Si and S to be marginally more abundant than Fe in the core, but 2-temperature fits give significantly increased abundances of Fe and Si, with Fe the most abundant of the three (Buote et al., 2003b). The 2-temperature models provide a significantly better fit in the central 30 kpc of the group, and the resulting abundances lead to the conclusion that 70-80% of the Fe mass in the central 100 kpc of NGC 5044 has been produced by SNIa. However, this analysis assumes the abundance ratios of Grevesse & Sauval (1998), which give rather higher Fe abundances than the ratios we use (Anders & Grevesse, 1989). If we assume that the effect of this difference is a factor of 1.4 in Fe abundance, then our results are fairly consistent with those found for both M87 and NGC 5044.
7.5 Mass, cooling time and entropy
We use an estimate of (the radius at which the system has a density of 200 times the critical density of the universe, approximately equal to the virial radius) based on fits to ROSAT data (Helsdon & Ponman, 2000). This estimate, =973 -1 kpc using our chosen , assumes the temperature profile to be isothermal, which we know to be inaccurate. This value compares well with the value we would derive from the work of Navarro et al. (1995) (=935 -1 kpc). However, Sanderson et al. (2003) point out that Navarro et al. (1995) do not include preheating in their models, and that estimates based on ROSAT and ASCA data suggest that their models overestimate for low mass systems such as MKW 4. Sanderson et al. (2003) estimate =786 -1 kpc for this system. Unfortunately we cannot estimate from our fits since they only model the data well in the inner part of the group. We therefore assume the value of Helsdon & Ponman (2000), which means that our profiles extend to 19% of the virial radius, but note that the Sanderson et al. (2003) estimate would mean that they extend slightly further, to 23%.
The total mass within this radius seems quite comparable to that found for systems of similar X–ray temperature (Nevalainen et al., 2000), but the gas mass appears at first glance somewhat low, with the gas fraction of the group only reaching 1%. However, comparison with other cool systems (Sanderson et al., 2003) suggests that this value may not be unrealistic, given the low fraction of the virial radius to which we can measure. The flattening of the gas fraction profile at large radii is caused by the flattening and turnover of the temperature profile at these radii. Although we cannot measure the temperature profile to larger radii, the ROSAT analysis of Helsdon & Ponman (2000) extends it to 420 kpc. The turnover of the temperature profile is observed in the ROSAT data, but at larger radii the profile flattens again, apparently becoming roughly isothermal with a temperature similar to that we observe in the core. Our model of the temperature profile clearly cannot be extrapolated, but the ROSAT profile suggests that gas fraction should begin rising again just outside our region of interest. We find that the gas entropy at 0.1 is in good agreement with previous studies of groups and clusters (Lloyd-Davies et al., 2000), when corrected for differences in assumed .
As has been observed in other galaxy groups (Ponman et al., 2003; Mushotzky et al., 2003), there is no central isentropic core. Some models of entropy injection in galaxy groups and clusters predict a flattening of the entropy profile in the cores of the systems (e.g., Muanwong et al., 2001; Tozzi & Norman, 2001), and while this is observed in some higher mass systems (e.g., David et al., 2001), it is clearly not the case here. The cooling time is fairly short in the core of NGC 4073, but rises to 109 yr at the radius (the radius at which the average B-band surface brightness has dropped to 25 mag/arcsecond2), and is longer than a Hubble time at the outer edge of our measurements. The short cooling time in the core, and short timescale required for the halo to have cooled to its current state suggests we are not observing a long-established cooling flow. It seems more likely that the gas is cooling, but that a large scale flow has not yet had sufficient time to develop. However, the relatively short timescale on which the gas is able to cool to its current state, , suggests that some other source of energy is required to prevent the gas cooling further, a source which was active in the more recent past. The value of in the core indicates that this energy source must have been active 2108 yr ago. This timescale is similar to that estimated for AGN driven by cooling flows (Binney & Tabor, 1995). We note that at the minimum radius for which we calculate , 2 kpc (equivalent to the mid-point of our innermost surface brightness bin), it is 1.17108 yr, very similar to the minimum value of . The profiles in Figure 9 have a minimum radius equal to the midpoint of our innermost temperature bin, within which we cannot be certain our profiles match the true temperature structure.
7.6 Halo evolution models
The most obvious reason for the observed level of enrichment by SNIa in the core of the group is that the gas has been there for some time, allowing the metal abundance to build up. One possibility is that instead of a group with a steady decrease in temperature towards the core, we are viewing an essentially isothermal group halo with a cooler galaxy halo embedded within it. The cooler region is certainly centred on NGC 4073, and such a sizable galaxy might be expected to be capable of producing a large gaseous halo through stellar mass loss and accretion. The temperature in the core, 1.4 keV, would be quite high for an elliptical galaxy, but not impossibly so, particularly when contamination by group emission is taken into account. The high metallicity of the core, and suggestion of increased SNIa enrichment within the galaxy is a strong argument for a galaxy halo on some scale. The strongest argument against this explanation is that spectral fits using two temperature models do not seem as good as we might expect if this were the case. The relatively poor constraints on the hotter component in the APEC+APEC and APEC+powerlaw fits, the moderate success of the CEVMKL fit and the existence of low and high energy lines as well as lines from the Fe-L series in the RGS data all argue for multi-temperature gas, rather than two separate components.
An alternative is that there is a cooling flow operating in the core of the group, in which there are small scale inhomogeneities in the distribution of metals (Morris & Fabian, 2002). This scenario could lead to apparent high metallicities in the core while reducing the emission from gas at low temperatures, as the high metallicity components would cool very rapidly at low temperatures via line emission. This model would predict a silicon abundance in the inner core 1.5-2 times that of iron, and we observe a ratio of 1.75. The model also predicts a central decrease in abundance, as metal rich gas clumps in the core cool completely out of the X-ray regime. Such abundance dips are seen in M87 (Matsushita et al., 2003), the Centaurus cluster (Sanders & Fabian, 2002) and the NGC 5044 group (Buote et al., 2003b), with scales of up to 15 kpc. The limits of resolution for our abundance profiles are 6 kpc, and we do not see a definite central dip. The two inner most bins of the deprojected abundance profile are quite similar however, and the degree of error on each makes it difficult to rule out such a dip. If there is a cooling flow in MKW 4 it seems likely that it is small, affecting a region only a few tens of kpc across, and this model may be a good description of it.
A third option is that the MKW 4 is a truly multi-temperature system, which is prevented from developing into a cooling flow by some heating mechanism. The lack of AGN activity in NGC 4073 (or clear indications of past activity) is interesting, in that AGN outbursts have been suggested as a method of reheating cooling gas (e.g. Böhringer et al., 2002). Modeling of AGN outbursts as a means of controlling cooling in Hydra A (Kaiser & Binney, 2003) suggests that large scale cooling can be prevented if the AGN produces bubbles in the gas involving 1% of the halo. The models also predict a duty cycle for a central AGN powered by infall of cooling gas, of 200 Myr, very similar to the cooling time in the central regions of the cluster. MKW 4 is somewhat less dense and considerably cooler than Hydra A, leading us to expect a shorter cooling time and AGN duty cycle. We would also expect a similar fraction (of order 1%) of the gas halo to be involved in the bubbles produced by the AGN heating. The lack of a detected AGN does not rule out this model for MKW 4, nor does the fact that we do not see evidence of cavities in the X–ray halo caused by old radio lobes. If the AGN has been dormant for some time, our field of view may be too small to detect any cavities, or our observation may be too shallow. However, as the galaxy population is relaxed and morphologically segregated, with no significant substructure, arguing strongly against any large merger event in the recent history of the group, AGN activity would seem to be a promising candidate as a means of preventing cooling in the core.
8 Summary and Conclusions
We have carried out an analysis of an XMM-Newton observation of MKW 4, studying the surface brightness, temperature and abundance structure of the system, and using these results to infer the properties of the cluster potential well and X–ray halo. The main results of the analysis can be summarized as follows;
-
1.
The surface brightness structure of the group suggests that it is not completely relaxed, but is nearly so. There is some structure in the halo along a NW-SE axis, which may indicate movement of gas in the halo, but no sharp edges or fronts. We conclude that any movement must therefore by weak, and that the group is near hydrostatic equilibrium.
-
2.
The RGS spectra show that in the group core gas exists at a range of temperatures. The lowest temperature feature observed in these spectra is the OVII line. This suggests that there is a component of the gas in the core with a temperature of 0.5 keV, but no significant quantities of gas cooler than this.
-
3.
Spectral imaging with the EPIC cameras shows that the group has a temperature profile which declines toward the core, and an abundance profile with a fairly strong central peak, in agreement with previous results from ROSAT and ASCA (Helsdon & Ponman, 2000; Finoguenov et al., 2001). In the central 40 kpc the halo is not well modeled by a single temperature plasma, suggesting either that we are not resolving the temperature structure in the core or that the gas is multi-phase.
-
4.
From the abundances we measure we can estimate the numbers of SNII and SNIa required to enrich the intra-group medium to its current state. We estimate that 50% of the Fe in the central 40 kpc was produced in SNIa. Our abundances compare well with those found in other objects of similar mass observed by XMM-Newton and Chandra.
-
5.
An analysis of the 3-dimensional properties of the system shows that it has a total mass similar to other systems of comparable temperature, and a gas entropy which agrees well with other systems. The gas fraction of the cluster is at rather low (1%), but still within the range expected for a system of this temperature. The cooling time in the group core is relatively short (2108 yr), and is similar to the time we estimate the system would have taken to cool to its present state if the halo was once at a uniform temperature of 3 keV, equal to the peak temperature now observed.
From these results we conclude that the group halo is a multi-temperature system, but does not contain a large cooling flow, as indicated by the lack of gas at temperatures below 0.5 keV. The high abundances observed in the core suggest that the gas in the centre of the group has occupied its current position for a reasonably long time, allowing enrichment by supernovae. Although there is no direct evidence of AGN activity in the dominant galaxy of the group, or of past activity, we consider it likely that the group is periodically heated by a central AGN, probably fueled by gas cooling out of the halo. At present the AGN is dormant, as the halo has not cooled sufficiently to provide fuel for an outburst. Alternative sources of heating, such as star formation or the merger of a smaller group are ruled out by the optical data, which suggest that both group and dominant galaxy are old and undisturbed. We therefore conclude that MKW 4 is most likely to be a system governed by feedback between cooling in the group halo and heating by an AGN in its dominant galaxy.
Acknowledgments
The Authors would like to thank B. Maughan for the use of his software
and advice on XMM analysis, and S. Helsdon for providing his 3-d
properties script. We would also like to thank G. Mamon, J. Kempner and
A. Sanderson for useful discussions and suggestions. Lastly we would like
to thank the referee, A. Lewis, for a thorough reading of the paper and
numerous suggestions which have significantly improved it. This work made
use of the Digitized Sky Survey, the NASA/IPAC Extragalactic Database,
and Starlink facilities at the University of Birmingham. This research
was supported in part by NASA grants NASA NAG5-10071 and NASA GO2-3186X.
References
- Anders & Grevesse (1989) Anders E., Grevesse N., 1989, Geo. et Cosmo. Acta, 53, 197
- Arnaud et al. (2002) Arnaud M., Majerowicz S., Lumb D., Neumann D. M., Aghanim N., Blanchard A., Boer M., Burke D. J., Collins C. A., Giard M., Nevalainen J., Nichol R. C., Romer A. K., Sadat R., 2002, A&A, 390, 27
- Böhringer et al. (2002) Böhringer H., Matsushita K., Churazov E., Ikebe Y., Chen Y., 2002, A&A, 382, 804
- Binney & Tabor (1995) Binney J., Tabor G., 1995, MNRAS, 276, 663
- Buote et al. (2003a) Buote D. A., Lewis A. D., Brighenti F., Mathews W. G., 2003a, ApJ, in press
- Buote et al. (2003b) Buote D. A., Lewis A. D., Brighenti F., Mathews W. G., 2003b, ApJ, in press
- Cash (1979) Cash W., 1979, ApJ, 228, 939
- David et al. (2001) David L. P., Nulsen P. E. J., McNamara B. R., Forman W., Jones C., Ponman T., Robertson B., Wise M., 2001, ApJ, 557, 546
- dell’Antonio et al. (1995) dell’Antonio I. P., Geller M. J., Fabricant D. G., 1995, AJ, 110, 502
- den Herder & et. al. (2001) den Herder J. W., et. al. 2001, A&A, 365, L7
- Dickey & Lockman (1990) Dickey J. M., Lockman F. J., 1990, ARA&A, 28, 215
- Finoguenov et al. (2001) Finoguenov A., Arnaud M., David L. P., 2001, ApJ, 555, 191
- Finoguenov et al. (2000) Finoguenov A., David L. P., Ponman T. J., 2000, ApJ, 544, 188
- Fisher et al. (1995) Fisher D., Illingworth G., Franx M., 1995, ApJ, 438, 539
- Fukugita et al. (1998) Fukugita M., Hogan C. J., Peebles P. J. E., 1998, ApJ, 503, 518
- Grevesse & Sauval (1998) Grevesse N., Sauval A. J., 1998, Space Sci. Rev., 85, 161
- Helsdon & Ponman (2000) Helsdon S. F., Ponman T. J., 2000, MNRAS, 315, 356
- Huchtmeier & Richter (1989) Huchtmeier W. K., Richter O.-G., 1989, A General Catalog of HI Observations of Galaxies. The Reference Catalog.. A General Catalog of HI Observations of Galaxies. The Reference Catalog, XIX, 350 pp. 8 figs.. Springer-Verlag Berlin Heidelberg New York
- Jansen et al. (2001) Jansen F., Lumb D., Altieri B., Clavel J., Ehle M., Erd C., Gabriel C., Guainazzi M., Gondoin P., Much R., Munoz R., Santos M., Schartel N., Texier D., Vacanti G., 2001, A&A, 365, L1
- Jeltema et al. (2003) Jeltema T. E., Canizares C. R., Buote D. A., Garmire G. P., 2003, ApJ, 585, 756
- Jones & Forman (1999) Jones C., Forman W., 1999, ApJ, 511, 65
- Kaastra & Mewe (1993) Kaastra J., Mewe R., 1993, A&AS, 97, 443
- Kaiser & Binney (2003) Kaiser C. R., Binney J., 2003, MNRAS, 338, 837
- Koranyi & Geller (2002) Koranyi D. M., Geller M. J., 2002, AJ, 123, 100
- Liedahl et al. (1995) Liedahl D. A., Osterheld A. L., Goldstein W. H., 1995, ApJ, 438, L115
- Lloyd-Davies et al. (2000) Lloyd-Davies E. J., Ponman T. J., Cannon D. B., 2000, MNRAS, 315, 689
- Lumb (2002) Lumb D., 2002, EPIC background files, http://xmm.vilspa.esa.es/docs/documents/CAL-TN-0016-2-0.ps.gz
- Markevitch & et. al. (2000) Markevitch M., et. al. 2000, ApJ, 541, 542
- Marty et al. (2002) Marty P. B., Kneib J. P., Sadat R., Ebeling H., Smail I., 2002, proc. SPIE, 4851, 208
- Matsushita et al. (2003) Matsushita K., Finoguenov A., Böhringer H., 2003, A&A, 401, 443
- Morbey & Morris (1983) Morbey C., Morris S., 1983, ApJ, 274, 502
- Morgan et al. (1975) Morgan W. W., Kayser S., White R. A., 1975, ApJ, 199, 545
- Morris & Fabian (2002) Morris R. G., Fabian A. C., 2002, preprint, astro-ph/0209559
- Morrison & McCammon (1983) Morrison R., McCammon D., 1983, ApJ, 270, 119
- Muanwong et al. (2001) Muanwong O., Thomas P. A., Kay S. T., Pearce F. R., Couchman H. M. P., 2001, ApJ, 552, L27
- Mushotzky et al. (2003) Mushotzky R., Figueroa-Feliciano E., Loewenstein M., Snowden S. L., 2003, in Mulchaey J. S., Dressler A., Oemler A., eds, Carnegie Observatories Astrophysics Series, Vol. 3: Clusters of Galaxies: Probes of Cosmological Structure and Galaxy Evolution Groups and the Entropy Floor- XMM-Newton Observations of Two Groups. Cambridge: Cambridge Univ. Press
- Navarro et al. (1995) Navarro J. F., Frenk C. S., White S. D. M., 1995, MNRAS, 275, 720
- Nevalainen et al. (2000) Nevalainen J., Markevitch M., Forman W., 2000, ApJ, 532, 694
- O’Sullivan et al. (2003) O’Sullivan E., Ponman T. J., Collins R. S., 2003, preprint, astro-ph/0301153
- Ponman et al. (2003) Ponman T. J., Sanderson A. J. R., Finoguenov A., 2003, MNRAS, accepted
- Pratt et al. (2001) Pratt G. W., Arnaud M., Aghanim N., 2001, in Neumann D. M., Tranh Thanh Van J., eds, Clusters of Galaxies and the High Redshift Universe Observed in X-rays: XMM-Newton observations of galaxy clusters; the radial temperature profile of A2163. p. in press
- Roberts et al. (1991) Roberts M. S., Hogg D. E., Bregman J. N., Forman W. R., Jones C., 1991, ApJS, 75, 751
- Sakelliou et al. (2002) Sakelliou I., Peterson J. R., Tamura T., Paerels F. B. S., Kaastra J. S., Belsole E., Böhringer H., Branduardi-Raymont G., Ferrigno C., den Herder J. W., Kennea J., Mushotzky R. F., Vestrand W. T., Worrall D. M., 2002, A&A, 391, 903
- Sanders & Fabian (2001) Sanders J. S., Fabian A. C., 2001, MNRAS, 325, 178
- Sanders & Fabian (2002) Sanders J. S., Fabian A. C., 2002, MNRAS, 331, 273
- Sanderson et al. (2003) Sanderson A. J. R., Ponman T. J., Finoguenov A., Lloyd-Davies E. J., Markevitch M., 2003, MNRAS, accepted
- Smith et al. (2001) Smith R. K., Brickhouse N. S., Liedahl D. A., Raymond J. C., 2001, ApJ, 556, L91
- Tamura et al. (2003) Tamura T., Kaastra J. S., Makishima K., Takahashi I., 2003, A&A, 399, 497
- Terlevich & Forbes (2002) Terlevich A. I., Forbes D. A., 2002, MNRAS, 330, 547
- Thielemann et al. (1993) Thielemann F.-K., Nomoto K., Hashimoto M., 1993, in Prantzos N., Vangioni-Flam E., Casse M., eds, , Origin and Evolution of the Elements. Cambridge Univ. Press
- Tozzi & Norman (2001) Tozzi P., Norman C., 2001, ApJ, 546, 63
- Tully (1987) Tully R. B., 1987, ApJ, 321, 280
- Xu et al. (2002) Xu H., Kahn S. M., Peterson J. R., Behar E., Paerels F. S. B., Mushotzky R. F., Jernigan J. G., Makishsima K., 2002, ApJ, 579, 600