Galaxy threshing and the origin of ultra-compact dwarf galaxies in the Fornax cluster
Abstract
A recent all-object spectroscopic survey centred on the Fornax cluster of galaxies, has discovered a population of sub-luminous and extremely compact members, called “ultra-compact dwarf” (UCD) galaxies. In order to clarify the origin of these objects, we have used self-consistent numerical simulations to study the dynamical evolution a nucleated dwarf galaxy would undergo if orbiting the center of the Fornax cluster and suffering from its strong tidal gravitational field. We find that the outer stellar components of a nucleated dwarf are removed by the strong tidal field of the cluster, whereas the nucleus manages to survive as a result of its initially compact nature. The developed naked nucleus is found to have physical properties (e.g., size and mass) similar to those observed for UCDs. We also find that although this formation process does not have a strong dependence on the initial total luminosity of the nucleated dwarf, it does depend on the radial density profile of the dark halo in the sense that UCDs are less likely to be formed from dwarfs embedded in dark matter halos with central ‘cuspy’ density profiles. Our simulations also suggest that very massive and compact stellar systems can be rapidly and efficiently formed in the central regions of dwarfs through the merging of smaller star clusters. We provide some theoretical predictions on the total number and radial number density profile of UCDs in a cluster and their dependences on cluster masses.
keywords:
dwarf — galaxies: clusters: general — galaxies: elliptical and lenticular, cD – galaxies: formation – galaxies: interactions1 Introduction
The population of low-luminosity, low surface brightness dwarf elliptical and irregular galaxies are thought to have a key role in the context of galaxy formation and evolution. This is not only because in the hierarchical clustering scenario these small galaxies merge to form more massive galaxies, but also because their observed physical properties place strong constraints on theoretical models of galaxy formation and evolution (e.g., Ferguson & Binggeli 1994; Mateo 1998; Grebel 1998). Examples of the latter include the scaling relation (Kormendy 1977; Ferguson & Binggeli 1994), the luminosity function (Binggeli, Sandage, & Tammann 1985; Sandage, Binggeli, & Tammann 1985), the presence of nuclear structures (Binggeli & Cameron 1991), and rotation-curve profiles (Moore 1994), all of which have been extensively discussed for assessing the viability of any theory of galaxy formation and evolution.
In contrast to this ubiquitous dwarf galaxy population, the red compact elliptical galaxies (cE) such as M32 are very rarely observed and are preferentially located in close proximity to giant galaxies (e.g., Nieto & Prugniel 1987). Only recently, Forbes et al. (2002) have discovered another clear example of an M32-like compact spheroidal system very close to an M31-like spiral galaxy, in the image of UGC 10214 taken by Advanced Camera for Surveys () on board the Hubble Space Telescope (). The origin of the high surface brightness and radially-limited luminosity profiles of such objects has been discussed by several authors mostly in the context of the tidal effects of the massive galaxies they lie close to (King 1962; Faber 1973; Nieto & Prugniel 1987; Burkert 1994; Bekki et al. 2001a). It is, however, still controversial how such compact density profiles are formed via the tidal gravitational forces of massive galaxies.
A new type of sub-luminous and extremely compact “dwarf galaxy” has recently been discovered in an “all-object” spectroscopic survey centred on the Fornax cluster of galaxies (Drinkwater et al. 2000a, b). While objects with this type of morphology have been observed before – the bright compact objects discovered by Hilker et al. 1999 – and the very luminous globular clusters around cD galaxies (Harris, Pritchet, & McClure 1995) – in this particular case they have been found to be members of the Fornax cluster, have intrinsic sizes of only 100 pc, and have absolute band magnitudes ranging from to mag. Hence Drinkwater et al. have named them “ultra-compact dwarf” (UCD) galaxies. Importantly, the luminosities of UCDs are intermediate between those of globular clusters and small dwarf galaxies and are similar to those of the bright end of the luminosity function of the nuclei of nucleated dwarf ellipticals (e.g., Lotz et al. 2001). Moreover, they are observed to be within 30 arcmin of the central dominant galaxy in Fornax, NGC 1399, and are distributed as large radii as this galaxy’s globular cluster system (extending out to a radius of 100 kpc at least; Dirsch et al. 2003). Owing to the lack of ultra high-resolution imaging and high-dispersion spectroscopy of the UCDs, it was highly uncertain at the time of their discovery whether they are super-massive star clusters (intracluster globular clusters or tidally stripped nuclei of dwarf galaxies) or really a new type of low-luminosity compact elliptical dwarf (“M32-type”) galaxy (Drinkwater et al. 2000b).
However, Drinkwater et al. (2003; hereafter D03) recently obtained high-resolution imaging of the UCDs in Fornax with the Space Telescope Imaging Spectrograph (STIS) on and found that their radial density profiles (with one exception) can be well fitted by both King model and de Vaucouleurs profiles. The effective radii measured for the UCDs were in the pc range, which is larger than the typical core radius of a globular cluster ( 6 pc) and smaller than the scale length of the most compact normal dwarf galaxy in the Virgo cluster ( 160 pc). D03 also obtained high-resolution spectra of UCDs using the Very Large Telescope UV Echelle Spectrograph and the Keck Telescope Echelle Spectrograph. These were used to measure internal velocity dispersions and, in turn, mass-to-light () ratios for the UCDs. These ranged from 24 to 37 km s-1 and 2 to 4 , respectively. These observations suggest that UCDs are different from normal dwarf galaxies in size and from GCs in velocity dispersion and : UCDs are thus observed to be really a new class of galactic object!
The importance of the tidal field of more massive galaxies in forming globular clusters (and even objects that are an order of magnitude brighter than globular clusters) from nucleated dwarf galaxies has already been discussed by several authors (e.g., Zinnecker et al. 1988; Freeman 1993; Bassino et al. 1994). Bassino et al. (1994) first demonstrated that very massive globular clusters can originate from nuclei of nucleated dwarf galaxies around more massive galaxies owing to the tidal stripping of the stellar envelope of the dwarfs. Using more realistic numerical simulations, Bekki et al. (2001b) proposed the “galaxy threshing scenario” in which the global tidal field of the Fornax cluster efficiently strips the outer stellar envelopes of the more massive nucleated dwarf galaxies (Md M⊙) as they orbit NGC 1399. This was shown to transform them into compact systems whose luminosity was consistent with that of the UCDs. This previous study, however, did not discuss structural and kinematical properties (e.g., radial density profile, velocity dispersion, and mass-to-light-ratio) of which there are now measurements from and the large ground-based telescopes (D03).
The purpose of this paper is to numerically investigate the threshing scenario in a more comprehensive and self-consistent manner and to specifically address and compare these structural and kinematical properties. Based on a fully self-consistent dynamical model of dE,Ns embedded in massive dark matter halos, we investigate the following issues: (i) how the global tidal field of the Fornax cluster strips the dark matter halos, the stellar envelopes, and the nuclei of dE,Ns with different luminosites, (ii) whether the structural properties of the dark matter halos of dE’Ns are important for the effectiveness of the threshing process, (iii) whether galaxy threshing can transform nucelated dwarf spirals into UCDs, (iv) whether the galaxy threshing scenario can explain the relationship between velocity dispersion and absolute magnitude observed for UCDs, and (v) what the threshing scenario predicts for the total number and the radial number distribution of UCDs in a cluster and their dependence on cluster mass. We also discuss a possible physical relationship between UCDs, the globular cluster Cen, and the compact elliptical galaxy M32 and a formation mechanism for the nuclei of dE,Ns.
The plan of the paper is as follows: In the next section, we describe our numerical model for the dynamical evolution of dE,Ns in the Fornax cluster. In §3, we present our numerical results on the structural and kinematical properties of UCDs formed by galaxy threshing and compare these with recent observational results. In §4, we discuss the environmental dependences of UCD properties, the possible formation of the giant globular cluster Cen via threshing, and the formation of galactic nuclei in dwarfs via merging of globular clusters. We summarise our conclusions in §5.
2 Model Details
2.1 Cluster mass profile
In order to model, numerically, the dynamical evolution of nucleated dwarf galaxies as they orbit the centre of the Fornax cluster, we consider them to be collisionless stellar systems with a mass and size similar to that observed for the dE,N types. We assume that the gravitational field of the cluster’s dark matter halo has the strongest influence on the dynamical evolution of dE,Ns. Accordingly, we model only the cluster tidal field and do not include any tidal effects from other cluster member galaxies in the present simulations. Also cluster potential is assumed to be time-indepedent, which is not so consistent with recent high-resolution numerical simulations of cluster galxies formation within the CDM models (e.g., Ghigna et al. 1998). Although our simulations are thus idealized in some aspects, we believe that our model still contains the essential ingredients that govern the dynamical evolution of dE,Ns in the Fornax cluster.
To give our model a realistic radial density profile for the dark matter halo of the cluster, we base it on both the X-ray observations of Jones et al. (1997) and the predictions from the standard cold dark matter cosmogony (Navarro, Frenk, & White 1996, hereafter NFW). The NFW profile is described as:
| (1) |
where , , and are the distance from the center of the cluster, the central density, and the scale-length of the dark halo, respectively. The adopted NFW model has a total mass of (within the virial radius) and of 83 kpc. This model is based on the NFW model with a “c” parameter of 12.8. The adopted set of parameters is consistent with the X-ray observations of Jones et al. (1997) and the mass estimation of the Fornax cluster derived from kinematics of the cluster galaxies by Drinkwater et al. (2001). This cluster model is referred to as “the Fornax profile” and labeled as “FO”.
To determine the dependences of the galaxy threshing processes on cluster mass and size, we have also investigated the dynamical evolution of dE,Ns for other model clusters. In particular, we present the results for models with = and = 226 kpc, as well as = and = 83 kpc. The more massive model corresponds to the Virgo cluster, and accordingly it is referred to as “VO” model; the less massive model corresponds to the Local Group and is referred to as the “LG” model. All of the parameters for these are chosen from the values listed in Table of NFW (e.g, model 3 and 15).
2.2 Nucleated dwarf ellipticals
A dE,N is modelled as a fully self-gravitating system and assumed to consist of a dark matter halo, a stellar component, and a nucleus. We accordingly do not include any gaseous components in the present models. For convenience, the stellar component (i.e., the main baryonic component) is referred to as either the “envelope” or the “stellar envelope” so that we can distinguish this component from the stellar nucleus. The density profile of the dark matter halo of the dE,N is represented by that proposed by Salucci & Burkert (2000):
| (2) |
where and are the central dark matter density and the core (scale) radius, respectively. For convenience, we hereafter call this profile the “SB” profile (or model). The main difference between the SB profile and the NFW profile is that the former has a large dark matter core. We choose the SB profile rather than the NFW profile, because the observed kinematics of dwarf galaxies are inconsistent with the cuspy dark matter profiles predicted by the CDM model (e.g., Moore 1994; Burkert 1995). For the SB profile, the dark matter core parameters, , , and (where is the total dark matter mass within ) are not free parameters, and clear correlations are observed between them (Burkert 1995):
| (3) |
All dark matter particles are distributed within 5.
Equations (2) and (3) predict that is 3.5 times larger than the typical scale length ( 800 pc) observed for dE,Ns, with = mag and = 10 (Ferguson & Binggeli 1994). This large core radius is a favorable condition for galaxy threshing to act on dE,Ns, as is described later. Since the dE,N model with = mag is the most extensively investigated, the of this model is hereafter referred to as . In order to clarify the importance of the dark matter halo profiles of dE,Ns in the galaxy threshing process, we also investigate models with NFW dark matter profiles with a scale radius of . For the scale radius of a cluster’s dark matter halo to be distinguished from that of a galactic dark matter halo, we here use rather than the original definition of . Since there are no results on the scale radius for dark matter halos of typical dwarfs (with ) in NFW, direct comparison between and for a given total mass of a dark matter halo is not possible. If we assume that the central density of the dark matter halo with = 4 (corresponding to the above = mag dE,N model) is the same as that of the halo with = 3.2 (corresponding to model 1 in Table of NFW), is estimated to be . The CDM model predicts that dark matter halos with lower masses can show higher central densities (NFW), and can be smaller than 1 for a given dE,N dark matter halo mass. Guided by this simple estimation, we investigate the models with = , 0.5, and 0.25.
The mass (luminosity) and the scale length of the stellar envelope in a dE,N is modelled according to the observed scaling relation of Ferguson & Binggeli (1994):
| (4) |
for bright dwarfs ( ) and
| (5) |
for faint dwarfs ( ), where and are the scale length of the exponential profile and the absolute band magnitude, respectively. The projected density of the envelope with and the total mass of is represented by an exponential profile with a scale length that is exactly the same as in the above equation for the value of . The ratio of the total mass of the envelope to the total luminosity of the envelope is set to be 2. The projected density profile of the nucleus with mass is represented by a King model (King 1964) with a core radius of and a central concentration parameter of 1.0.
We estimate the velocities of both the dark matter halo particles and the stellar envelope particles from the gravitational potential at the positions where they are located. In detail, we first calculate the one-dimensional isotropic dispersion according to the (local) virial theorem:
| (6) |
where is the gravitational potential at the position . We then allocate a velocity to each collisionless particle (dark matter halo and stellar particles) so that the distribution of velocities of these particles have a Gaussian form with a dispersion equal to . We consider that the nucleus is strongly self-gravitating and thus the one-dimensional isotropic dispersion at a given radius in the nucleus is determined solely by the gravitational potential of the nucleus (i.e., the outer dark matter halo and the envelope do not contribute significantly to the potential at the very center of the dE,N). This is consistent with recent simulation results (Oh & Lin 2000), which suggest that the relatively low central velocity dispersion of a dE,N can be due to the self-gravitating nucleus formed by the merging of nuclear star clusters. The method of determining the value of the velocity dispersion from the gravitational potential at a given radius for the nucleus is the same as that for the dark matter and the stellar envelope.
For all dE,N models, the mass-to-light-ratio in the band () is set to be 10 (thus = 5). Therefore, if we choose for a dE,N model, then its values of , , and are automatically determined from equations (3) and (4). The remaining parameters of the dE,N model are and . These range from 0.02 to 0.2 for and from 0.02 to 0.2 for , and we show the results of the models that have particularly important implications for UCD formation via galaxy threshing. The adopted parameter values are all consistent with those observed in dE,Ns (e.g., Binggeli & Cameron 1991; Ferguson & Binggeli 1994).
The adopted value of 10 for is consistent with observational results of dEs with well know kinematical properties. Mateo et al. (1991) estimated as 124 for the Fornax dwarf galaxy based on the precisely determined radial velocities of 44 individual stars of the dwarf. The estimated from radial velocity dispersion in dwarf spheroidal galaxies in the Local group is summarized in van den Bergh (2000): for the Leo I, 23 for the Carina dwarf, for the Sculptor, 90 for the Draco, 12 for the Leo II, and 50 for the Sextans. Accordingly, the adopted value of 10 in the present simulations is reasonably consistent with observations of the Local group dwarfs except the Draco and the Sextans with the unusually large .
2.3 High– and low-surface brightness spirals
We also investigate the threshing processes for nucleated low-luminosity spiral galaxies ( = mag) dominated by dark matter halos in order to investigate whether UCD formation processes depend on the morphological properties of their hosts. Such galaxies are modelled by assuming they have an exponential stellar disk (with a radial scale length of and a vertical scale length of 0.2) which is embedded in a dark matter halo. The latter is represented by an SB profile with a core radius , and a total mass 10 times larger than the stellar disk. The value of is set to be 6.0 for the models, which ensures that the model galaxies’ rotation curves are of similar shape to that of the Galaxy. In addition to the rotational velocity due to the gravitational field of the disk and halo components, initial radial and azimuthal velocity dispersions are assigned to the disk component according to the epicyclic theory of Binney & Tremaine (1987) with a Toomre parameter value of = 1.5. The vertical velocity dispersion at a given radius is set to be half the radial velocity dispersion at that point, consistent with that observed in the Milky Way (e.g., Wielen 1977).
We present the results for models with = and central surface brightnesses of mag arcsec-2 in band (hereafter referred to as the “HSB” model), 24 (“LSBI”) and 26 mag arcsec-2 (“LSBII”). For all spiral models with = , the physical parameters of the nuclei are the same as those adopted in the fiducial dE,N (FO1) model described later. The adopted value of 10 for the mass-to-light-ratio is reasonable for simulations of LSBs (e.g., Mihos et al. 1997). The gaseous component is not included in the HSB and LSB models, because we consider that low density gas in these galaxies can be quickly stripped from them because of ram pressure stripping in cluster environments.
2.4 Orbits
The orbit of our model dE,N (and a dwarf spiral) is assumed to be influenced only by the gravitational potential resulting from the dark halo component of the Fornax cluster. Since the adopted cluster potential is spherically symmetric (not triaxial), the orbit of the dE,N forms a rosette within a plane. This orbital plane defines the - plane in all our models.
The center of the cluster is always set to be (,,) = (0,0,0) whereas the initial position of the dE,N is set to be (,,) = (, 0, 0). The initial velocity of the dE,N (,,) is set to be (0, , 0), where and are the parameters controlling the orbital eccentricity (i.e, the larger is, the more circular the orbit becomes) and the circular velocity of the cluster at = , respectively.
We investigate three representative values of : 0.25, 0.5, and 1, the corresponding orbital eccentricities, , of which are 0.77, 0.52, and 0.0 (circular), for the dE,N with kpc in the FO model. Instead of and , the orbital eccentricity (), the apocenter (), and the pericenter () of the orbit of a dE,N are used for describing the parameter set of the model, because these quantities are more informative.
The adopted value of 200 kpc for () in the fiducial model corresponds roughly to the projected distance of the observed most distant UCD from the center of the Fornax cluster (Drinkwater et al. 2000a, b). It takes Gyr for dE,Ns with = 200 kpc to be transformed into UCDs, as is described later. The time scale for morphological transformation from dE,Ns into UCDs is longer for larger values of (Bekki et al. 2001). Therefore, we investigate 4.5 Gyr evolution of a dE,N for models in order to draw robust conclusions as to whether the strong tidal field of the Fornax cluster can be responsible for UCD formation. Since UCDs can not be disintegrated after their formation for a reasonable set of parameters for galactic nuclei in dE,Ns (Bekki et al. 2001), we do not intend to investigate long-term ( 10 Gyr) evolution of dE,Ns.
2.5 Choice of parameters
and are the most important parameters in determining whether a dE,N can be morphologically transformed into a UCD by galaxy threshing (Bekki et al. 2001); we therefore focus in most detail on the dependences our results have on these two parameters. The model that shows the typical behaviour of the galaxy threshing process, and is thus the most important in this study, is referred to as “the fiducial model” (FO1). This model has -16 mag, , , an SB dark matter profile with , kpc, and the FO profile. By changing cluster mass profiles, host morphological types, dE,N luminosities, the dark matter profiles of the dE,Ns (as parameterised by , , , and ), we investigate the parameter dependences of the galaxy threshing processes.
The parameter values and final morphologies for each model are summarized in the Table 1. In the first column, FO, VI, and LG represent the models with the Fornax cluster, Virgo cluster and Local Group mass profiles, respectively. Column 8 describes the final morphological properties of the dE,Ns and dwarf spirals after 4.5 Gyr orbital evolution. Here, “UCD” indicates a remnant whose envelope has been nearly completely stripped and yet whose nucleus remains largely unaffected (at most 20 % of the mass is stripped away); “dE,N” indicates the case where both the envelope and nucleus survive; “no remnant” indicates the case where both components are tidally stripped; and “UCD+LSB env” indicates a remnant that is dominated by the central compact nucleus yet has a non-negligible fraction (more than 5% of the total remnant mass) of the stellar envelope surrounding the nucleus.
Even if the envelopes of dE,Ns are nearly completely removed by galaxy threshing, not all of the threshed remnants can be identified as UCDs. The most extreme case is the F07 model where both the envelope and the nucleus of the dE,N are completely destroyed (and hence the “no remnant” classification in Table 1). In this model, is rather large (0.2) and the nucleus is initially less compact and more susceptible to tidal destruction by a cluster tidal field. The dE,Ns with larger ( 0.2) are less likely to be transformed into UCDs because of the lower degree of self-gravitation of the nuclei. Although such complete destruction of dE,Ns is very important in the context of the origin of the intracluster stellar light, we do not present here a detailed description of such “no remnant’ models.
Finally, all the simulations have been carried out using GRAPE boards (Sugimoto et al. 1990) in the GRAPE 3 systems at Tohoku University and the GRAPE 5 systems at the National Astronomical Observatory in Japan. The total number of particles used for each model are 20,000 for the dark matter, 20,000 for the stellar envelope, and 10,000 for the nucleus. Multiple softening lengths are used for investigating the dynamical evolution of the three collisionless components with different size and mass. For each component (e.g., nucleus), the gravitational softening length is chosen such that the length is the same as the mean particle separation at the half-mass radius of the component. The time integration of the equation of motion is performed by using a second-order, leap-frog method. Most of the calculations are set to be stopped at = 4.5 Gyr (corresponding to 20,000 time steps), where represents the time that has elapsed since the simulation starts.

3 Results
3.1 Fiducial model
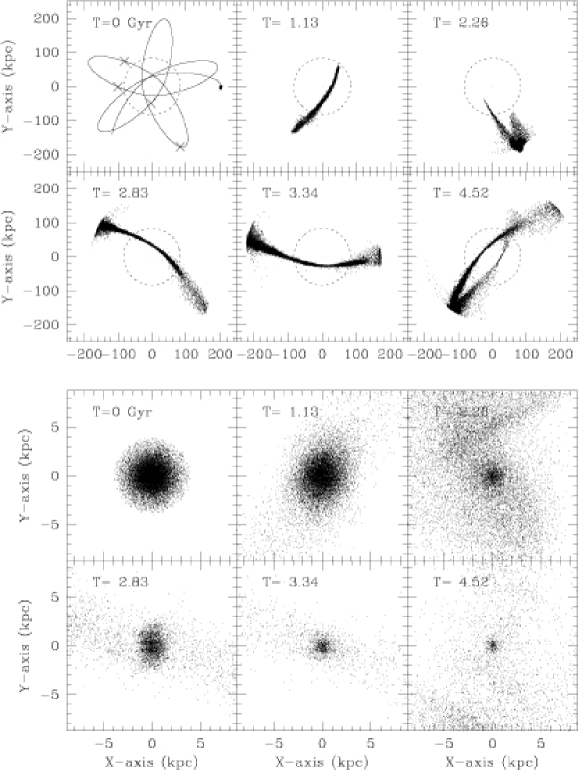
Figures 1 and 2 summarise the dynamical evolution of the fiducial model and the morphological properties of the remnant in the model, respectively. As the dE,N approaches the pericenter of its orbit, the strong global tidal field of the Fornax cluster stretches the envelope of the dE’N along the direction of the dwarf’s orbit and consequently tidally strips the stars of the envelope ( Gyr). The dark matter halo, which is more widely distributed than the envelope due to its larger core radius, is also efficiently removed from the dE,N during the pericenter passage. Since the envelope (and the dark matter halo) loses a significant fraction of its mass during the passage of the pericenter, the envelope becomes more susceptible to the tidal effects of the Fornax cluster after the pericenter passage. Therefore, each subsequent time the dwarf approaches the pericenter, it loses an increasingly larger fraction of its stellar envelope through tidal stripping (compare, for example, the and Gyr time points). Consequently, both the envelope and the dark matter halo become smaller, less massive, and more diffuse after five passages of the pericenter ( Gyr).


The stripped stars form a long tidal stream along the “rosette” orbit within the orbital plane ( Gyr). The length and shape of the stream depend not only on the time (the time that has elapsed since the simulation starts) but also on where the dE,N is located with respect to the center of the Fornax cluster. After a few pericenter passages, the stream comes to have the outer sharp edge at the apocenter of the dE’s orbit (, 3.34, and 4.52 Gyr). Due to the longer time scale for the dynamical relaxation of stars in the tidal stream, the stars cannot be randomly dispersed into the intracluster region. Consequently, the finer stream can still be clearly seen after 4.5 Gyrs evolution of the dE,N. The developed stream is one of the observable predictions from the galaxy threshing model of UCD formation, and thus the existence or non-existence of such a stream extending from an UCD should be investigated observationally. Furthermore, the shape of the stream might well enable us to infer the orbit of the dE,N.
The central nucleus, on the other hand, is just weakly influenced by the tidal force as a result of its compact configuration. Because of its strongly self-gravitating nature, the nucleus loses only a small amount (%) of its mass and thus maintains its compact morphology during its tidal interaction with the Fornax cluster. As a result, a very compact stellar system with a negligible amount of dark matter is formed from the dE,N by Gyr (see Fig. 2). The total mass and size of the remnant are 3.8 and 100 pc (five times the core or scale radius), consistent with the observed properties of a UCD. Hence this new study, based on fully self-consistent numerical models of dE,Ns, confirms the earlier results of Bekki et al. (2001b) based on a more simplistic model.
Figure 3 shows that the mass-to-light ratio, , decreases dramatically from 4.2 to 2.3 for . This result clearly explains why the UCDs are observed to have mass-to-light ratios that are much smaller (–4; D03) than those observed for dE,Ns ( 10) for some of the Local group dwarf (van den Bergh 2000): galaxy threshing is the most efficient in the outer regions of a dE,N where the dark matter halo dominates gravitationally. About 95% of the envelope initially within , and 20% of the nucleus initially within are removed from the dE,N. Figure 3 also suggests that a dE,N whose envelope has been partially removed (i.e., at time Gyr) has a smaller and a larger compared with the initial values. This implies that if dE,Ns in a cluster are suffering from galaxy threshing, dE,Ns with smaller are likely to show larger . This possible correlation may well be observed thus providing a further test of the threshing scenario.
Figure 4 describes the final projected density profile of a UCD formed by galaxy threshing. Both the surface density of the dark matter and that of the envelope drop by more than an order of magnitude within 4.5 Gyr. If the initial central surface brightness of the dE,N is mag arcsec-2, then the final surface brightness of the dE,N at is about mag arcsec-2. Such a faint, low surface brightness envelope will be hard to detect, even by existing large ground-based telescopes. Thus the UCD formed by galaxy threshing shows a very steep density profile with an extremely low density outer “halo” ( pc) dominated by the original envelope component of the progenitor dE,N. This “halo” component surrounding a UCD is another important prediction of the threshing model. Furthermore, the total mass (or luminosity) and the surface brightness of this faint outer “halo” component are continually reduced as the threshing process proceeds to completion.
Figure 5 shows the location of the remnant of the fiducial model on the [, ]–plane. In estimating from the total mass of the remnant and the dE,N’s initial values of and , we assume that the - color of the remnant is 0.9 (also 0.5) mag, which is the same as the color D03 observed for their sample of UCDs. We estimate the central velocity dispersion from stars within 100 pc of the remnant of the threshed dE,N in each model. As is shown in this Figure, the remnant of the fiducial model has mag (and ), which is mag fainter than the initial dE,N, and , so that the location on the [, ]–plane is fairly close to that observed for UCDs. Figure 5 also demonstrates that: (i) only luminous dE,Ns ( mag) can become UCDs with mag and 20 km s-2 after being threshed, (ii) the remnants of dE,Ns with the more massive (or bluer) nuclei lie closest to the location of the observed UCDs, and (iii) dE,Ns which overall are more luminous, are likely to become more luminous UCDs (if nuclear mass fraction is constant for dE,N populations) . The results shown in Figures 3, 4, and 5 thus confirm that galaxy threshing can transform bright dE,Ns (with the initial mag) into compact stellar remnants with the structure and the kinematics similar to those observed in UCDs.
Figure 5 also implies that the UCDs observed by Drinkwater et al. (2000a, b), which have , must have had bright dE,N progenitors (with mag) if they were transformed into UCDs by galaxy threshing. It also demonstrates that there can exist very compact objects with mag (thus with of the host dwarfs mag) that do not lie on the GC scaling relation However, in the absence of kinematical information, such objects could easily be misidentified as GCs. Thus future central velocity dispersion measurements of the GC populations (identified around cluster galaxies via recession velocity measurements alone) may well uncover such a population of lower luminosity UCDs, distinguishable by their displacement from the GC scaling relation.

3.2 Parameter dependence
The physical properties of the threshed remnants depend strongly on the initial parameters of the progenitor galaxies and their orbits; these can be seen graphically in Figure 6. We find the following:
(i) UCDs can be formed by threshing only if the orbits of the progenitor dE,Ns are highly eccentric (e.g., 0.7 for kpc and the FO profile). UCDs are more likely to be formed for dE,Ns orbiting the inner region of a cluster for a given . These rather restrictive conditions would imply that UCD formation via galaxy threshing is expected to be a relatively rare event in clusters.
(ii) If the dark matter halos of dE,Ns have the central ‘cuspy’ cores that recent high-resolution simulations based on CDM models predict (e.g., NFW), these dE,Ns are less likely to be transformed into UCDs owing to the high central dark matter density. Conversely, if the observed UCDs really are threshed dE,Ns, the dark matter halos of the progenitor dE,Ns must have a ‘softer’ SB-like profile rather than an NFW-like profile. Final objects of dE,Ns with more compact dark matter halos have larger because of a less amount of the stripped envelopes and the dark matter halos. These results suggest that dE,Ns observed in the central regions of the present-day clusters should have more compact dark matter halos to survive from galaxy threshing.
(iii) Galaxy threshing can transform nucleated dwarf spirals into UCDs, provided their central surface brightness () is rather low ( mag arcsec-2). If the tidal field of a cluster is not strong enough to transform nucleated dwarf spirals into UCDs, it can transform them into nucleated S0-like objects due to the tidal heating of the stellar disks. High surface brightness nucleated spirals are very hard to be transformed into UCDs, even if the pericenter of the orbits is kpc.
(iv) UCD formation via dE,N galaxy threshing is more highly favoured in more massive clusters as a result of the stronger tidal field at a given radius from the cluster center. For UCDs to be formed in a small group like the Local Group while orbiting say our Galaxy, the pericenter of the dE,N’s orbit should be kpc for kpc (11 kpc for kpc). This result implies that if UCDs exist around a luminous galaxy (like the Galaxy and M31), the pericenter of the orbits is likely to be within the optical radius of the galaxy ( kpc). This result provides some clue as to the origin of giant globular clusters such as Cen and G1, which are located in the Local Group and could belong to the same class of compact object as UCDs.


4 Discussion
4.1 Predictions on total numbers and radial distributions of UCDs in clusters
Photometric and spectroscopic observations to search for UCDs in other nearby clusters (e.g., Virgo and Coma) are now ongoing (D03). The goal of these observational studies is to provide detailed information on (i) the physical properties of UCDs (e.g., total number, radial distribution, and luminosity function) in clusters, and (ii) the environmental dependence of these physical properties (e.g., Gregg et al. 2003). If these observations can be compared with the corresponding theoretical predictions of the galaxy threshing model, the plausibility of the model can be checked in a more self-consistent way. To aid this process, we use our models to generate predictions of the total number of UCDs and their radial distribution as a function of cluster mass.
First we derive the “threshing radius”, , within which the stellar envelope of a nucleated dwarf can almost entirely be removed by the strong tidal field of a cluster. is different for dwarfs with different in a given cluster gravitational potential because of the observed mass-dependent density profiles of dark matter halos (Salucci & Burkert 2000). We estimate for a dwarf orbiting a cluster by assuming that is the distance from the cluster centre at which the tidal force of the cluster is equivalent to the self-gravitational force of the dwarf at the core radius of its dark matter halo. To be more specific, for a dwarf with satisfies the following relationship:
| (7) |
where , , and are the dark matter core radius, the total mass of the cluster within , and the total mass of the dark matter in the dwarf, respectively. Assuming the constant (=10) adopted in the present study, we can estimate numerically for dwarfs with a given .
By assuming a cluster has a particular (i) mass-to-light-ratio (), (ii) luminosity function, and (iii)a radial profile (for its galaxies and dark matter halo), we can also derive the spatial distribution and kinematics of galaxies in the cluster. We investigate here two cluster models: The “Fornax cluster model” with total mass () of and , and the “Virgo cluster model” with and . For comparison, we also investigate for “the Local Group model” with and . We adopt the Schechter function:
| (8) |
where , , and are the number density, faint-end slope, and characteristic absolute magnitude quantities. We adopt the most recent observationally-determined values for these quantities: For and these are -1.07 and -19.7, respectively, as measured in the -band by Efstathiou et al. (1988). The value of is chosen according to the values of and adopted for our model cluster. For the radial galaxy number distribution of galaxies in a cluster, we adopt a King profile with a core radius times smaller than the cluster scale radius, , in each cluster model (Adami et al. 1998). The value of for each cluster model is chosen according to the simulated values of in Table (e.g., model 15) of NFW.
Finally, we calculate, numerically, the orbit of each galaxy (represented by a test collisionless particle) moving within the cluster’s gravitational potential, tracking it for 8.5 Gyr and thereby checking whether the galaxy comes within the threshing radius . In this calculation, we assume that the mean orbital eccentricity of galaxies in a cluster is 0.6, which is consistent with recent high-resolution cosmological simulations (Ghigna et al. 1998). We choose 8.5 Gyr rather than 4.5 Gyr in order to track evolution of dwarfs in clusters/group, because we need to check whether or not the dE,Ns with the apocenter distances larger than 200 kpc (corresponding to the distance of the most distant UCD from the center of the Fornax cluster) can be transformed into UCDs. Since we have found that should be as large as 0.7 for outer dE,Ns to be transformed into UCDs, the predicted mean value of 0.6 in the CDM simulations (Ghigna et al. 1998) implies that UCD formation is not so common in clusters.
The host dwarfs of UCDs should be more luminous, because the observed mass fraction of nuclei in dE,Ns is less than 0.2 (typically 0.02) and the UCDs are brighter than mag. By adopting the observationally estimated stellar masses (an order of ) by D03, the stellar masses of UCD progenitor dE,Ns should be , which corresponds to = mag for a reasonable mass-to-light-ratio of their stellar components. Given the absolute magnitude range observed for UCDs (), we take dwarf galaxies with and a pericenter distance less than to be the progenitors of UCDs. We thus investigate the total number and the radial distribution of UCDs in the two cluster models, based on our orbital calculations for galaxies of different absolute magnitude. Figure 7 describes the dependence of on for the two cluster models (as well as the Local Group). Irrespective of the cluster masses, is smaller for less luminous galaxies.
Figure 8 shows the UCD distribution in the Fornax cluster model with , and kpc. In this model, 14 UCDs can be formed and all of them are within 3. This centrally concentrated UCD distribution is consistent with that observed by Drinkwater et al. (2000a, b), although note that the observations do not cover the full region shown in the Figure. How the UCDs are distributed spatially is further illustrated in Figure 9 where cumulative distributions are plotted. This clearly demonstrates that most of the UCDs are located within 200 kpc of the center of the Fornax cluster and that the UCDs are more centrally concentrated than the dwarf galaxy population. This is qualitatively consistent with the observations of Drinkwater et al. (2000a, b). Thus Figures 8 and 9 indicate the “truncation radius” within which UCDs can exist in a cluster. The derived number of 14 within 200 kpc is twice as much as the observed number of UCDs within 200 kpc pf the Fornax cluster.
In Figure 10 we show the UCD distribution in the Virgo cluster model, which has , and kpc. Most of the 46 UCD candidates are located within 3, which confirms that there is a “truncation radius” for UCDs in this cluster. As is shown in Figure 11, the cumulative distribution of UCDs in this model is qualitatively similar to that of the Fornax model. The total number of UCDs is larger and the UCDs are more widely distributed in the Virgo model than in the Fornax one. Thus these results predict that (i) the UCD distribution can be truncated at , and (ii) the total number of UCDs is larger in more massive clusters. These predictions will be readily tested by future observations.
The total number of UCDs formed by galaxy threshing in the above simple simulation can depend on the total number of dE,Ns initially in a cluster thus on the luminosity function of galaxies in the cluster. Since the progenitor dwarfs of UCDs should be more luminous dE,Ns (typically ), the simulated number of UCDs depends more strongly on the shape of the luminosity function around . Recently, Hilker et al. (2003) investigated the luminosity function of the Fornax cluster for fainter objects (with = mag) and found the faint-end slope of the luminosity function is flat ( -1.1, See Pritchet & van den Bergh (1999) for the luminosity function of the Local Group of galaxies). These recent observational results are relevant to the number of dwarfs much fainter than UCD progenitor ones, so we think that adopting the most recent luminosity function does not change the above results so significantly.


4.2 Formation of stellar nuclei of dE,Ns through merging of star clusters
If UCDs can originate from the nuclei of nucleated dwarf galaxies, the next question is how these nuclei are formed within the cluster environment? Oh et al. (2000) first demonstrated that if the external tidal perturbation of a cluster of galaxies is relatively weak for a dwarf orbiting the cluster, dynamical friction can lead to significant orbital decay of the globular clusters within it and the formation of compact nuclei within a Hubble timescale. Fellhauer & Kroupa (2002) also showed that the merging of star clusters is essential to the formation of compact nuclei. One of the key tests which can determine whether the above “merger scenario” of galactic nuclei formation is plausible and realistic is to investigate whether the scaling relations observed for UCDs (e.g., the Fundamental Plane [, ]– and [, ]–relations) are consistent with those of stellar systems formed by the merging of globular clusters.
Bekki et al. (2002a) investigated this point by comparing the results of numerical simulations of GC merging in dwarfs with the recent observations of D03. They found there to be consistent agreement between the scaling relations predicted for the simulated galactic nuclei and those observed for UCDs. Figure 12 briefly summarizes these results and demonstrates that the galactic nuclei formed by GC merging lie off the GC [, ]–relation and instead lie on or close to the Faber-Jackson relation, in the same region populated by the observed UCDs (see Bekki et al. 2002a, 2003 for details of the GC merger model). This result implies that conversion of the orbital angular momentum of the GCs into internal angular momentum of a single nuclear star cluster, and energy redistribution within the merging GCs, leads to a new scaling relation (upon which the UCDs lie) which is quite different to that defined by the GC population. Unfortunately, the lack of any observations which measure velocity dispersion profiles for UCDs makes it impossible to determine whether their kinematical properties are consistent with the GC merger scenario.
Clearly more extensive comparisons between the observed structural and kinematical properties of UCDs and the simulations are needed to determine whether their origin is in GC merging. Future high-resolution imaging of UCDs by will provide finer radial light distribution profiles and thus more precise estimates of their central surface brightness. These can then be compared with the observed (Kormendy 1984) and simulated versions of the [, ]–relation. Furthermore, the shapes of the simulated nuclei (or UCDs) in the GC merger scenario depends on the kinematics of the GC’s host dwarf galaxy, such that dwarfs with more rotational energy (i.g., larger ) are likely to have more flattened nuclei (Bekki et al. 2003). Therefore statistical studies of UCD shapes based on future high-resolution imaging will also provide a vital clue to the origin of galactic nuclei and UCDs.
4.3 Origin of higher in UCDs
D03’s study of the structure and kinematics of the UCDs in Fornax has revealed that their mass-to-light ratios range from 2 to 4 in solar units, based on the assumption that they are dynamically relaxed systems. These values are larger than the typical of globular clusters (), and even larger than the largest globular clusters in M31 (-2). The most probable reason for this would be that UCDs are embedded by massive dark matter halos. However, the threshing scenario predicts that since nearly all of the dark matter can be tidally removed from dE,Ns in this process, the of the formed UCDs should be as small as the of the baryonic nuclei of the dE,Ns (Geha et al. 2002). Therefore, if UCD are formed by galaxy threshing, the dark matter halos should not be responsible for the higher of UCDs (However, we here emphasize that if UCDs are formed from galaxy threshing, the possibility of dark matter halos surrounding UCDs can not be ruled out).
Accordingly, if UCDs are formed by galaxy threshing and are predominantly baryonic, then the fact that their mass-to-light ratios are observed to be higher than the values typically measured for GCs suggests one of two possibilities: One is that the stellar populations of UCDs and GCs are quite different. The other is that the King model mass estimator, traditionally used for GCs (Meylan et al. 2001) but which has also been used to derive values for UCDs (D03), is inapplicable to the latter because of fundamental differences in the structural and kinematical properties between UCDs and GCs.
With regard to the first possibility, we point out that the difference in the initial mass function (IMF) between UCDs and GCs is more likely to cause the observed difference in between these two compact stellar systems Charlot et al. (1993) suggested that the IMF of stellar populations formed as the result of a starburst can be truncated, thus resulting in a higher . Recent hydrodynamical simulations have demonstrated that star clusters rather than field stars are more likely to form in the central regions of interacting and merging galaxies with strong starbursts because the high pressure of the interstellar gas can trigger the collapse of giant molecular clouds (Bekki & Couch 2001; Bekki et al. 2002b). Oh et al. (2000) showed that star clusters can merge with one another to form a single nucleus in a dwarf galaxy because of the efficient dynamical friction of the clusters. Together these results imply that if compact nuclei are formed by the merging of young star clusters in starbursting dwarf galaxies, then they (and hence UCD progenitors) will have a higher . Spectrophotometric studies which place strong constraints on the IMF of young star clusters in starbursting dwarf galaxies provide an important text of this first scenario.
With regard to the measurement of the mass-to-light ratio, we note that is assumed to be proportional to the product of and in the formula adopted by D03. Therefore the of each UCD can be overestimated if either the effective radius () or the central velocity dispersion () is overestimated for some observational reason. The possibility that is overestimated by a factor of 2–4 is highly unlikely, because the observed radial profiles are fitted so well by either a King model or de Vaucouleurs () profile (D03). On the other hand, the velocity dispersion of a UCD is very likely to decrease with radius, like other self-gravitating systems such as elliptical galaxies. Because D03’s spectroscopic observations were made through a slit that was large compared to the angular sizes of the UCDs, this would cause their central velocity dispersions to be underestimated, in the opposite direction to that required for an overestimation of . Although other systematic observational effects cannot be ruled out entirely, it would seem more likely that the difference between the for GCs and UCDs is real and related to differences in their stellar populations.
4.4 Physical relationship between UCDs and Cen
The globular cluster Cen is the most massive such system in our Galaxy and is observed to have unique physical properties such as a very broad metallicity distribution (Freeman & Rodgers 1975) and a highly flattened shape (Meylan 1987). These unique characteristics have been cited as evidence for Cen having a very different star formation, chemical enrichment and structure formation history to other Galactic globular clusters (e.g., Majewski et al. 1999; Hilker & Richtler 2000). Such highly flattened, luminous globular clusters are also known to reside around M31, the most notable being G1 (Meylan et al. 2001), with another recently discovered by Larsen (2001).
One of the most extensively discussed formation scenarios for these giant GCs is that they are the surviving nuclei of ancient nucleated dwarfs in the Local Group of galaxies. Bekki & Freeman (2003) recently demonstrated that Cen could have been formed from a nucleated dwarf as a result of its outer stellar envelope being completely tidally stripped by the Galaxy. The original nucleated dwarf would have had an absolute magnitude of and been in a retrograde orbit with respect to the Galaxy. Although there is nearly an order of magnitude difference in luminosity between UCDs and giant GCs such as Cen and G1, both can be formed via the same ‘threshing’ mechanism. Thus it seems plausible to propose a theoretical model in which UCDs and giant globular clusters belong to the same family of objects with a common progenitor – the nuclei of dE,Ns, – but whose luminosities/sizes differ between these two classes.
There are, however, two apparent differences between UCDs and giant GCs. Firstly, both Cen and G1 seem to lie on the GC [] scaling relation, whereas UCDs do not. Secondly, both Cen and G1 are considerably flattened with flatness parameter () values of 0.121 (Geyer et al. 1983) and 0.2 (Meylan et al. 2001), respectively. These values are much larger than the values typical of Galactic GCs (; White & Shawl 1987). There is no clear evidence that UCDs are as flattened as Cen and G1 (D03), although the ability of HST imagery to precisely measure their flatness is rather limited. This difference would imply that if both giant GCs and UCDs originate from dE,N nuclei, the less luminous dwarfs should have more flattened nuclei. Future statistical studies (based on deep imaging at high spatial resolution) of whether there is a correlation between flatness and the luminosity of nuclei in dwarfs will provide a direct test of this model.
5 Conclusions
We have investigated, numerically, how the global tidal field of a cluster transforms dE,Ns morphologically into UCDs for a range of models with different cluster masses and sizes. We summarise our principle results as follows:
(1) For a plausible dwarf galaxy scaling relation, the outer stellar components of a dE,N orbiting a cluster is almost totally stripped as a result of the strong cluster tidal field; the nucleus, on the other hand, manages to survive. The naked nucleus developed in this ‘galaxy threshing’ process will be classified as a UCD (satisfying the same criteria by which UCDs were discovered in the Fornax cluster) providing its host was more luminous than mag. The mass-to-light-ratio of the threshed dE,N decreases dramatically from to during the course of several passages through the central region of the cluster.
(2) For a dE,N to be transformed into a UCD by threshing, its orbit needs to be highly eccentric. As an example, dE,Ns with flat dark matter cores must have orbital eccentricities of for kpc and for kpc in the Fornax model. This requirement does not depend on cluster mass.
(3) The initial dark matter density profile of the dE,N is critical in determining whether it is transformed into a UCD by the threshing process. dE,Ns embedded in dark matter halos with NFW profiles (i.e., ‘cuspy’ dark matter cores) are less likely to be transformed into UCDs, because their stellar envelopes are much more strongly bound. This implies that if UCDs are formed via galaxy threshing, the progenitor dE,Ns must have very flat, low-density dark matter cores.
(4) Nucleated dwarf spirals can also be transformed into UCDs, but only if they have a low central surface brightness ( mag arcsec-2 in the -band) and larger orbital eccentricities (). Spirals with brighter central surface brightnesses ( mag arcsec-2) can instead be transformed into nucleated S0s as a result of the strong disk heating by the cluster’s tidal field. High surface brightness nucleated dwarf spirals with mag arcsec-2 cannot be transformed into UCDs, even if they are on highly eccentric () orbits.
(5) UCDs are more likely to be formed in more massive clusters (or groups), because their stronger tidal fields makes the galaxy threshing process more efficient. The total number of UCDs formed by threshing is larger and the UCDs are more widely distributed in such clusters. Our threshing model predicts that there is a “truncation radius” within which UCDs can exist in a cluster.
6 Acknowledgment
We are grateful to the referee Michael Hilker for valuable comments, which contribute to improve the present paper. KB, WJC, and MJD acknowledge the financial support of the Australian Research Council throughout the course of this work. All the simulations described here were performed GRAPE 3/5 systems at Tohoku University and at the National Astronomical Observatory in Japan.
References
- [] Adami, C., Mazure, A., Katgert, P., Biviano, A. 1998, A&A, 336, 63
- [Bassino et al. 1994] Bassino, L. P., Muzzio, J. C., & Rabolli, M. 1994, ApJ, 431, 634
- [] Bekki, K., Couch, W. J., 2001, ApJL, 557, 19
- [] Bekki, K., Couch, W. J., Drinkwater, M. J., Gregg, M. D. 2001a, ApJL, 557, 39
- [] Bekki, K., Couch, W. J., Drinkwater, M. J. 2001b, ApJL, 552, 105
- [Bekki et al. 2002] Bekki, K., Couch, W. J., & Drinkwater, M. J. 2002a, in IAU 8th Asian-Pacific regional meeting, edited by S. Ikeuchi, J. Hearnshaw, & T. Hanawa, (PASJ), p 245.
- [] Bekki, K., Forbes, D. A., Beasley, M. A., Couch, W. J. 2002b, MNRAS, 335, 1176
- [] Bekki, K., Couch, W. J., & Drinkwater, M. J., Shioya, Y. 2003, in preparation
- [] Bekki, K., Freeman, K. C. 2003, in preparation
- [Binggeli et al. 1985] Binggeli, B., Sandage, A., Tammann, G. A. 1985, AJ, 90, 1681
- [Binggeli & Cameron 1991] Binggeli, B., Cameron, L. M., 1991, A&A, 252, 27
- [Binney & Tremaine 1987] Binney, J., Tremaine, S., 1987 in Galactic Dynamics.
- [Burkert 1994] Burkert, A. 1994, MNRAS, 266, 877
- [] Burkert, A. 1995, ApJL, 447, 25
- [] Charlot, S., Ferrari, F. Mathews, G. J., Silk, J. 1993, ApJL, 419, 57
- [] Dirsch, B., Richtler, T., Geisler, D., Forte, J. C., Bassino, L. P., Gieren, W. P. 2003, AJ, 125, 1908
- [] Djorgovski, S. 1993, in ASP Conf. Ser. 48 The globular cluster-galaxy connection. ed. Graeme H. Smith and Jean P. Brodie (San Francisco: ASP), p496
- [Drinkwater et al. 2000a] Drinkwater, M. J., Phillipps, S., Jones, J. B., Gregg, M. D., Deady, J. H., Davies, J. I., Parker, Q. A., Sadler, E. M., Smith, R. M. 2000a, A&A, 355, 900
- [Drinkwater et al. 2000b] Drinkwater, M. J., Jones, J. B., Gregg, M. D., Phillipps, S. 2000b, PASA, 17, 227
- [] Drinkwater, M. J., Gregg, M. D., Colless, M. 2001, ApJL, 548, 139
- [] Drinkwater, M. J., Gregg, M. D., Hilker, M., Bekki, K., Couch, W. J., Ferguson, J. B., Jones, J. B., Phillipps, S. 2003, Nature, in press (D03)
- [] Efstathiou, G., Ellis, R. S., Peterson, B. A. 1988, MNRAS, 232, 431
- [Faber 1973] Faber, S. M. 1973, ApJ, 179, 423
- [] Faber, S. M., Jackson, R. E. 1976, ApJ, 204, 668
- [] Fellhauer, M., Kroupa, P. 2002, MNRAS, 330, 642
- [Ferguson & Binggeli 1994] Ferguson, H. C., Bingelli, B. 1994, A&ARv, 6, 67
- [] Forbes, A. F., Beasley, M. A., Bekki, K. 2002, in Sky & Space, Aug/Sep 2002, p18
- [] Freeman, K. C., Rodgers, A. W. 1975, ApJL, 201, 71
- [Freeman 1993] Freeman, k. C. 1993, in The globular clusters-galaxy connection, edited by Graeme H. Smith, and Jean P. Brodie, ASP conf. ser. 48, p608
- [] Geha, M., Guhathakurta, P., van der Marel, R. P. 2002, AJ, 125, 3073
- [] Ghigna, S., Moore, B., Governato, F., Lake, G., Quinn, T., Stadel, J. 1998, MNRAS, 300, 146
- [] Geyer, E. H., Nelles, B., Hopp, U. 1983, A&A, 125, 359
- [] Gregg, M. D., Drinkwater, M. J. 2003, in preparation
- [Harris et al. 1995] Harris, W. E., Pritchet, C. J., McClure, R. D., 1995, ApJ, 441, 120
- [Hilker et al. 1999] Hilker, M., Infante, L., Richtler, T. 1999, A&AS, 138, 55
- [] Hilker, M., Richtler, T. 2000, A&A, 362, 895
- [] Hilker, M., Mieske, S., Infante, L. 2003, A&A, 397L, 9
- [Jones et al 1997] Jones, C., Stern, C., Forman, W., Breen, J., David, L., Tucker, W., Franx, M. 1997, ApJ, 482, 143
- [King 1962] King, I. R. 1962, AJ, 67, 471
- [Kormendy 1977] Kormendy, J. 1977, ApJ, 218, 333
- [] Larsen, S. S. 2001, AJ, 122, 1782
- [] Lotz, J. M.; Telford, R., Ferguson, H. C., Miller, B. W., Stiavelli, M., Mack, J. 2001, ApJ, 552, 572
- [Majewski et al. 2000] Majewski, S. R. et al. 1999, The Galactic Halo : From Globular Cluster to Field Stars, Proceedings of the 35th Liege International Astrophysics Colloquium, Edited by A. Noels, P. Magain, D. Caro, E. Jehin, G. Parmentier, and A. A. Thoul. p619
- [Mateo 1998] Mateo, M. 1998, ARAA, 36, 435
- [] Mateo, M., Olszewski, E., Welch, D. L., Fischer, P., Kunkel, W. 1991, AJ, 102, 914
- [] Meylan, G. 1987, A&A, 184, 144
- [] Meylan, G., Sarajedini, A., Jablonka, P., Djorgovski, S. G., Bridges, T., Rich, R. M. 2001, AJ, 122, 830
- [] Mihos, J. C., McGaugh, S. S., de Blok, W. J. G. 1997, ApJL, 477, 79
- [Moore 1994] Moore, B. 1994, Nature, 370, 629
- [Navarro et al. 1996] Navarro, J. F., Frenk, C. S., White, S. D. M. 1996, ApJ, 462, 563
- [Nieto & Prugniel 1987] Nieto, J-.L., & Prugniel, P. 1987, A&A, 186, 30
- [Oh & Lin 2000] Oh, K. S., Lin, D. N. C. 2000, ApJ, 543, 620
- [] Pritchet, C. J., van den Bergh, S. 1997, AJ, 118, 883
- [] Salucci, P., Burkert, A. 2000, ApJL, 537, 9
- [Sandage et al. 1985] Sandage, A., Binggeli, B., Tammann, G. A. 1985, AJ, 90, 1759
- [Sugimoto et al. 1990] Sugimoto, D., Chikada, Y., Makino, J., Ito, T., Ebisuzaki, T., Umemura, M. 1990, Nature, 345, 33
- [] van den Bergh, S. 2000, The Galaxies of the Local Group (Cambridge University Press).
- [] White, R. E., Shawl, S. J. 1987, ApJ, 317, 246
- [Zinnecker et al. 1988] Zinnecker, H., Keable, C. J., Dunlop, J. S., Cannon, R. D., Griffiths, W. K. 1988, in Grindlay, J. E., Davis Philip A. G., eds, Globular cluster systems in Galaxies, Dordrecht, Kluwer, p603
| Model no. | host 111Morphological type of the host galaxy: dE,N, Sp, HSB, and LSB represent nucleated dwarf ellipticals, spirals, high surface brightness galaxies, and low surface brightness ones, respectively. | (mag) | dark matter 222SB and NFW represent the dark matter radial profiles by Salucci & Burkert (2000) and by Navarro, Frenk, & White (1995), respectively. | (kpc) | (kpc) | final morphology 333UCD+LSB env. means the UCD embedded by very low surface brightness stellar envelope. | comments | |
| FO1 | dE,N | -16 | SB | 200 | 27 | 0.77 | UCD | fiducial model |
| FO2 | dE,N | -12 | SB | 200 | 27 | 0.77 | UCD | |
| FO3 | dE,N | -14 | SB | 200 | 27 | 0.77 | UCD | |
| FO4 | dE,N | -18 | SB | 200 | 27 | 0.77 | UCD | |
| FO5 | dE,N | -16 | SB | 200 | 27 | 0.77 | UCD | = 0.2 |
| FO6 | dE,N | -16 | SB | 200 | 27 | 0.77 | no remnant | = 0.2 |
| FO7 | dE,N | -16 | SB | 100 | 100 | 0.0 | dE,N | |
| FO8 | dE,N | -16 | SB | 100 | 35 | 0.48 | UCD | |
| FO9 | dE,N | -16 | SB | 200 | 200 | 0.0 | dE,N | |
| FO10 | dE,N | -16 | SB | 200 | 65 | 0.52 | UCD+LSB env. | |
| FO11 | dE,N | -16 | SB | 400 | 47 | 0.79 | dE,N | |
| FO12 | dE,N | -16 | SB | 200 | 27 | 0.77 | dE,N | = 0.5 |
| FO13 | dE,N | -16 | NFW | 200 | 65 | 0.52 | dE,N | = |
| FO15 | dE,N | -16 | NFW | 200 | 27 | 0.77 | UCD+LSB env. | = |
| FO14 | dE,N | -16 | NFW | 200 | 27 | 0.77 | dE,N | = 0.5 |
| FO16 | dE,N | -16 | NFW | 200 | 27 | 0.77 | dE,N | = 0.25 |
| FO17 | Sp(HSB) | -16 | SB | 200 | 65 | 0.52 | Sp | =22 mag arcsec-2 |
| FO18 | Sp(LSBI) | -16 | SB | 200 | 65 | 0.52 | S0 | =24 mag arcsec-2 |
| FO19 | Sp(LSBI) | -16 | SB | 200 | 27 | 0.77 | UCD with LSB.env | =24 mag arcsec-2 |
| FO20 | Sp(LSBII) | -16 | SB | 200 | 65 | 0.52 | UCD | =26 mag arcsec-2 |
| FO21 | Sp(LSBI) | -16 | SB | 200 | 65 | 0.52 | S0 | = 12 |
| FO22 | Sp(HSB) | -16 | SB | 100 | 35 | 0.48 | Sp/S0 | |
| VI1 | dE,N | -16 | SB | 200 | 27 | 0.77 | UCD | |
| VI2 | dE,N | -16 | SB | 400 | 58 | 0.75 | UCD with LSB env. | |
| LG1 | dE,N | -16 | SB | 200 | 21 | 0.81 | dE,N | |
| LG2 | dE,N | -16 | SB | 50 | 5 | 0.81 | UCD | |
| LG3 | dE,N | -16 | SB | 100 | 11 | 0.80 | UCD |