The NATURE OF DAMPED ABSORBING GALAXIES AT –A PHOTOMETRIC REDSHIFT SURVEY OF DAMPED ABSORBERS1
Abstract
We study the nature of damped absorption (DLA) systems at using a sample of 11 DLA galaxies, for which accurate redshift measurements are available. Five of the 11 systems are identified in our on-going photometric redshift survey of DLA galaxies, while the remaining six systems are identified by previous groups using either spectroscopic or photometric redshift techniques. Absolute -band magnitude of the galaxies range from to . Impact parameter separations of the galaxy and absorber pairs range from to kpc. We first demonstrate that the precision of photometric redshifts is sufficient for identifying DLA galaxies, because DLAs are rare and their intrinsically high column density implies a small impact parameter of the host galaxy to the QSO line of sight. We then adopt this first large DLA galaxy sample to study the neutral gas cross section of intermediate-redshift galaxies and examine the optical properties of DLA galaxies at . The results of our study are: (1) the extent of neutral gas around intermediate-redshift galaxies scales with -band luminosity as with kpc and at ; (2) the observed incidence of the DLAs versus the -band luminosity of the DLA galaxies is consistent with models derived from adopting a known galaxy -band luminosity function and the best-fit scaling relation of the neutral gas cross section at ; (3) comparison of the observed and predicted number density of DLAs supports that luminous galaxies can explain most of the DLAs found in QSO absorption line surveys and a large contribution of dwarfs () to the total neutral gas cross section is not necessary; (4) of the 11 DLAs studied, 45% are disk dominated, 22% are bulge dominated, 11% are irregular, and 22% are in galaxy groups, indicating that galaxies that give rise to the DLAs span a wide range of morphological types and arise in a variety of galaxy environment; and (5) galaxies that contain the bulk of neutral gas in the universe do not appear to exhibit a substantial luminosity evolution between and .
1 INTRODUCTION
Damped absorption (DLA) systems observed in the spectra of background quasi-stellar objects (QSOs) trace neutral gas regions of H I column densities (historically defined as ) to redshifts as high as the background QSOs can be observed. They are believed to arise in luminous galaxies or their progenitors at high redshift. Optical spectroscopic surveys for DLAs, where the absorbers are detected at redshifts ranging from to , have demonstrated that DLAs dominate the mass density of neutral gas in the universe, containing roughly enough gas at to form the bulk of the stars in present-day galaxies (Wolfe et al. 1995; Storrie-Lombardi & Wolfe 2000; Péroux et al. 2002). But chemical abundance analyses of the DLAs yield metallicities lower than the typical solar values at all redshifts that have been measured (e.g. Pettini et al. 1999; Prochaska & Wolfe 2002; Kulkarni & Fall 2002), suggesting that DLAs do not trace the bulk of star formation. Because metallicity varies as functions of morphological type and galactocentric distance, it is impossible to establish connections between the DLAs and galaxies without first identifying the absorbing galaxies.
Despite extensive searches, only three galaxies at high redshift (Warren et al. 2001; Møller et al. 2002) and four galaxies at low redshift (Rao & Turnshek 1998; Lane et al. 1998; Miller, Knezek, & Bregman 1999; Turnshek et al. 2001; Cohen 2001; Bowen, Tripp, & Jenkins 2001) responsible for DLAs have been identified both in imaging surveys and in spectroscopic follow-up. A number of candidate absorbing galaxies that are likely to produce DLAs because of their small angular separations to the QSO lines of sight in deep Hubble Space Telescope (HST) images have been discussed by various authors (Steidel et al. 1994; Le Brun et al. 1997; Warren et al. 2001). The results of the searches appear to suggest that galaxies giving rise to the high H I column density absorbers span a wide range of morphology, from dwarfs, to early-type galaxies, to spirals. The diversity in the morphology of DLA galaxies may explain the large scatter in the metallicity measurements, but it introduces some challenge to the belief that these absorbers arise in gaseous disks and therefore trace the progenitors of present-day luminous galaxies.
It is difficult to identify galaxies that produce DLAs based on spectroscopy alone due to their faintness and small impact parameter to bright, background QSOs, where an accurate sky determination is a challenge for the spectrum extraction. It has recently become clear, however, that high-redshift galaxies can be correctly uncovered by means of photometric redshift techniques. For example, comparison of photometric and spectroscopic redshifts measured for 146 galaxies in the Hubble Deep Field has established that photometric redshifts are accurate to a few tenths at over the entire redshift range tested (e.g. Fernández-Soto et al. 2001). In addition, comparison of photometric and spectroscopic redshifts measured for 89 objects in the Hubble Deep Field south and Chandra Deep Field south also confirms that photometric redshifts estimated using ground-based photometry are both accurate and reliable to (Chen et al. 2003).
The accuracy in photometric redshift measurements is sufficient to identify DLA galaxies, because DLAs are rare and their intrinsic high column density implies a small projected distance of the host galaxy to the QSO line of sight. Specifically, the number density of DLAs per unit redshift interval is found to be between and (Rao & Turnshek 2000; Jannuzi et al. 1998). Therefore, the chances of finding two DLAs in a small redshift interval along a single line of sight are tiny. Adopting the Schechter (1976) luminosity function determined by Ellis et al. (1996) with , , and , we expect to see on average galaxy of luminosity within an angular radius of to a QSO line of sight over the redshift range (Figure 1).
Here we present the first results of a photometric redshift survey of faint galaxies in QSO fields with known DLAs. When selecting the targeted DLA fields for our survey, we have relaxed the H I column density threshold to and found 21 absorption systems at satisfying the new column density threshold. In all five fields that we have surveyed so far, we have identified galaxies or galaxy groups at the same redshift as the DLAs. Comparison of our photometric redshifts and known spectroscopic redshifts of 11 galaxies in these fields confirms that the photometric redshift measurements are accurate and precise enough not only to identify the DLA galaxies, but also to study the surrounding galaxy environment. Combining the DLA galaxies identified in our survey with those known in the literature, we have collected 11 DLA galaxies at for which robust redshift measurements are available. This is more than half of the total number of DLAs known at and is the first large sample of galaxies that are known to trace the bulk of neutral gas in the universe. As we shall show in this paper, the DLAs appear to be drawn from the same parent population as luminous field galaxies with () and a large contribution from dwarf galaxies to the total H I gas cross section is not necessary.
The first part of the paper describes the strategy and observations. We describe the survey design and observation strategies in § 2 and observations in § 3. Image processing and photometric redshift analysis are discussed in § 4. Descriptions of individual fields are presented in § 5. The second part of the paper describes interpretations of the data. We present the first large sample of DLA galaxies in § 6. Results of a study to understand the correlation between the properties of the DLAs and the properties of the DLA galaxies are presented in § 7, including the neutral gas cross section of galaxies at intermediate redshift and the morphology and intrinsic luminosity of the DLA galaxies. Comparisons with previous results are presented in § 8. Finally, a summary is presented in § 9. We adopt a cosmology, and , with a dimensionless Hubble constant throughout the paper.
2 A PHOTOMETRIC REDSHIFT SURVEY OF DLA GALAXIES
Over the past two years, we have conducted an imaging survey through multiple bandpasses of QSO fields with known DLAs. The goal of the survey is to identify a large sample of galaxies that produce DLAs at by means of photometric redshift techniques. The photometric redshift techniques determine the redshift of a galaxy by comparing the observed spectral energy distribution (SED) established from a compilation of broadband photometric measurements with a grid of SED templates using a maximum likelihood method. Our survey differs from previous studies to look for DLA galaxies in that photometric redshift measurements together with well understood measurement uncertainties are obtained for all galaxies in the field, including those close to the QSO lines of sight. Therefore we are able to not only obtain a quantitative measure of the confidence of the identification of each DLA galaxy, but also to study the clustering properties of these absorbing galaxies.
The choice of filters and the required depths for the imaging survey were determined based on results from previous studies together with those of our own simulations in order to secure accurate photometric redshift measurements. It is understood that photometric redshift errors arise from two different sources, template-mismatch variance and photometric uncertainties (Fernández-Soto et al. 2001; Chen et al. 2003). The former—which is due to the finite number of templates employed in the redshift likelihood analysis—dominates the redshift uncertainties for bright galaxies and the latter dominates the redshift uncertainties for faint galaxies. Three important lessons were learned from these results. First, -band photometry is important for accurate photometric redshift measurements for objects at (Connolly et al. 1995; Chen et al. 2003). Second, additional near-infrared photometry helps to distinguish between ambiguous optical spectral discontinuities of galaxies at low and high redshifts (Connolly et al. 1997; Fernández-Soto, Lanzetta, & Yahil 1999; Chen et al. 2003). Third, photometric redshift measurements are reliable only for galaxies that are detected at the 30 level of significance (Yahata et al. 2000).
The imaging survey was therefore designed to obtain a suite of optical and near-infrared images of the QSO fields, the most important of which were near-infrared , , and images for all DLA fields and a -band image for the DLAs at . Furthermore, the required imaging depths were estimated from adopting a typical Scd galaxy template and assuming a no-evolution scenario. We found that an galaxy at would have and therefore it was necessary to reach a 5 limiting magnitude of in the optical bandpasses for identifying galaxies of luminosity at this redshift, corresponding to . In the near-infrared bands, we aimed at a uniform limiting magnitude , which in the band corresponds to for a non-evolving Scd-type galaxy at .
3 OBSERVATIONS
3.1 Optical Imaging Observations
Optical images of the fields surrounding the QSOs AO0235164, EX03022223, PKS0439433, HE11221649, and PKS1127145 were obtained using the direct imager with a Tek#5 CCD on the 2.5 m du Pont telescope at the Las Campanas Observatory. This camera has a plate scale of 0.259 arcsec pixel-1 at the Cassegrain focus of the telescope, covering an field of view. The optical imaging data presented in this paper were taken separately in three different runs in January 2001, February 2002, and November 2002. The observations were carried out in a series of five to nine exposures of between 300 to 900 s each and dithered by between 10 to 20 arcsec in space to remove deviant pixels. Standard star fields selected from Landolt (1992) were observed through each of the bandpasses per night. Flat-field images were taken both at a white screen inside the dome and at a blank sky during the twilight periods every night. Bias frames were also obtained every night to remove the camera bias level.
Additional optical images of AO0235164 and EX03022223 obtained with HST using the Wide Field and Planetary Camera2 (WFPC2) with the F450W and F702W filters were accessed from the HST data archive. The images of AO0235164 were taken in June 1994 with the QSO placed at the center of the Wide Field Camera 3 in both filters. The observations with the F450W filter were carried out in two exposures of 600 s each. The observations with the F702W filter were carried out in two exposures of 300 s each. The images of EX03022223 were taken in June 1994 with the QSO placed at the center of the Planetary Camera in both filters. The observations with the F450W filter were carried out in four exposures of between 400 and 600 s each. The observations with the F702W filter were carried out in six exposures of 600 s each. A journal of the optical imaging observations is listed in columns (1)–(5) of Table 1.
3.2 Infrared Imaging Observations
Near-infrared images of the six DLA fields were also obtained on the 2.5 m du Pont telescope using the Cambridge Infrared Survey Instrument (CIRSI; Beckett et al. 1998) in October 2000 and January 2001, and the Wide Field IR camera (WIRC; Persson et al. 2001) in February 2002. These instruments contain a sparse mosaic of four 10242 Rockwell Hawaii HgCdTe arrays and have a plate scale of 0.196 arcsec pixel-1 in CIRSI and 0.199 arcsec pixel-1 in WIRC. For the purpose of identifying galaxies close to the QSOs, we used only one array for the IR imaging of the DLA fields. The observations were carried out in between five and nine sets of four exposures 45 to 75 s in duration with dither offsets of between 10 and 20 arcsec in a rectangular pattern. Between five and six IR standard stars selected from Persson et al. (1998) were observed every night. Flat-field images were obtained at a white screen inside the dome and were formed from differences of equal length exposures with the dome lamps on and off. A journal of the near-infrared imaging observations is listed Table 1 as well.
4 ANALYSIS
4.1 Image Processing and Galaxy Photometry
Individual exposures obtained with HST/WFPC2 were reduced using standard pipeline techniques. Individual exposures of optical images obtained with the Tek#5 CCD were processed according to the following procedures. First, bias and overscan were subtracted from individual frames. Next, a flat-field image was formed for each bandpass by median filtering individual flat-field frames taken during twilight or inside the dome every night. Most of the individual science images were flat-fielded using dome flats, except that in a few cases where twilight flats served better to remove hot spots in the frames. Finally, a fringe frame in the band was formed by median filtering the individual unregistered and flat-fielded frames obtained in each QSO field every night and was subtracted from these frames after being scaled by the ratio of the medians in the images. Individual exposures obtained with CIRSI and WIRC were processed using the data reduction pipeline described in Chen et al. (2002).
The processed individual images were registered to a common origin, filtered for deviant pixels based on a rejection criterion and a bad pixel mask formed using the flat-field frames, and stacked according to a weighting factor that is proportional to the inverse of the sky variance. A summary of the quality of the stacked images is presented in Table 1, which lists for each field the instrument, plate scale, filter, total exposure time, full width at half maximum (FWHM) of the median point spread function (PSF), and the limiting magnitude in a one-arcsec diameter aperture. In column (8) of Table 1, we also list for each system the expected apparent magnitudes in individual bandpasses of an Scd-type galaxy () at the redshift of the DLA .
Registration solutions that include rotation, linear offsets, and scaling in both and directions between the optical and near-infrared images were derived based on common stars identified in each QSO field. Because the near-infrared images have on average smaller PSFs, a coadded , , and (if available) image of each field was adopted as an image template for object detection using the SExtractor program (Bertin & Arnout 1996). The detection threshold was set to be a group of contiguous pixels of signal-to-noise ratio with an area coverage comparable to the size of the medium PSF. One product of the SExtractor program is an object segmentation map of each field, which indicates the sizes and shapes of all the detected objects. Instead of registering images of different bandpasses, the object segmentation map of each field was registered to individual optical images according to the registration solution. The optical extents of individual objects were broadened by the difference in the optical and IR PSFs to ensure accurate flux measurements over consistent apertures. Object fluxes were measured by summing up all the photons in the corresponding apertures in the segmentation map. Flux uncertainties were estimated from the mean variance over the neighboring sky pixels.
The photometry of the space-based F450W and F702W images was calibrated using the zero points provided by the HST. Photometric calibrations of the ground-based optical images were obtained by fitting a linear function, which included a zero-point, color, and extinction corrections, to the Landolt standard stars observed on the same nights. Photometric calibrations of the images were obtained by fitting a constant term that accounts for the zero-point correction to a number of the Persson standard stars observed throughout every night. The RMS dispersion of the best-fit photometric solution was found to be 0.05 mag for the optical images and 0.02 mag for the near-infrared images. Extinction corrections of individual bandpasses in each QSO field were estimated and applied using the Galactic extinction map published in Schlegel, Finkbeiner, & Davis (1998).
4.2 Photometric Redshifts and Uncertainties
We adopted the photometric redshift technique originally developed by Lanzetta and collaborators (Lanzetta, Yahil, & Fernández-Soto 1996; Fernández-Soto, Lanzetta, & Yahil 1999) but modified according to the descriptions in Chen et al. (2003) to determine galaxy redshifts based on ground-based photometry. We included six galaxy spectrophotometric templates as presented in Fernández-Soto et al. (1999) and Yahata et al. (2000) that cover the spectral interval of Å and span a range of spectral types—from elliptical or S0 (E/S0), Sab, Scd, irregular (Irr), to starburst. These empirical templates have already included some amount of dust reddening that is intrinsic to the host galaxies and therefore no artificial reddening was attempted. Uncertainties in photometric redshifts obtained based on ground-based galaxy photometric measurements have been studied extensively in Chen et al. (2003), where the authors showed that photometric redshifts based on the same set of SED templates are both accurate and reliable with an rms residual between spectroscopic and photometric redshifts of at .
Are photometric redshift measurements precise enough for the purpose of identifying DLA galaxies? To address this issue, we performed the following exercise. First, we calculated the corresponding impact parameter of 1 arcsec angular radius versus redshift as shown in Figure 1(a). Given that a typical galaxy in the local universe is observed to have an H I extent at of 22 kpc (e.g. Broeils & van Woerden 1994; Cayatte et al. 1994), we believe that DLA galaxies reside most likely within angular radius at or at from the QSO lines of sight.
Next, we estimated the number of random galaxies that would be seen in a cylinder centered at a known DLA. The size of the cylinder is set by the typical neutral gaseous extent of a galaxy together with photometric redshift uncertainties. If each known DLA represents a galaxy, then the probability of finding another galaxy by chance coincidence in this ”cylinder of uncertainty” quantifies the significance of an identification using photometric redshifts—a low probability of chance coincidence indicates a small likelihood that the true absorbing galaxy is present in the same volume but hidden underneath the detection limit of our survey, and therefore represents a high confidence in the photometric redshift identifications. Taking into account the fact that galaxies cluster with one another, we calculated the number of random galaxies that would be seen in the neighborhood of a known DLA according to
| (1) |
where is the number density of galaxies of luminosity brighter than , is the real-space two-point correlation function of field galaxies with representing the distance in co-moving coordinates between the DLA and surrounding galaxies, and is the co-moving volume element enclosed by the cylinder. Adopting the two-point correlation function determined by Zehavi et al. (2002) based on galaxies from the Sloan Digital Sky Survey (which is characterized by Mpc and ) and the galaxy luminosity function of Ellis et al. (1996) (which is characterized by Mpc-3 and over the redshift interval and includes low surface brightness galaxies), we found that the expected overdensity of galaxies in the small volume around the known DLAs as a result of galaxy clustering () is negligible (%) in comparison to the expected number of random galaxies (). We present the expected number of random galaxies in the neighborhood of a DLA versus redshift in Figure 1(b) for a combination of minimum luminosity considered and survey angular radii .
Figure 1(b) confirms that within a small angular radius photometric redshift uncertainties are relatively small to introduce little/no confusions in our photometric-redshift based DLA galaxy survey. Specifically, we expect to find galaxies brighter than within radius from a DLA at and galaxies brighter than within radius from a DLA at . If one galaxy is identified in the “immediate” vicinity of a DLA using photometric redshift techniques, the probability of finding additional random galaxies in the same neighborhood is vanishingly small. In addition, the number density of DLAs per unit redshift interval is measured to be between and at (Rao & Turnshek 2000; Jannuzi et al. 1998). We would find on average no more than one DLA per 10 lines of sight over the redshift interval . The possible confusion that may occur because of two closely located DLAs is also negligible. We therefore conclude that photometric redshift identifications of DLA galaxies are robust.
5 DESCRIPTIONS OF INDIVIDUAL FIELDS
We have completed the multi-color imaging survey for five QSO fields with known DLAs, and identified the DLA galaxy in every case using our photometric redshift technique. Properties of the DLAs and DLA galaxies identified in these fields are described here.
5.1 The Field toward AO 0235164
A radio spectrum of this BL Lac quasar () exhibited a strong 21-cm absorption line at (Roberts et al. 1976), which was resolved into four distinct absorption components in a subsequent monitoring program (Wolfe, Brigg, & Davis 1982). The latter observations also showed that the individual components have relative flux ratios varying from a few to % over the course of two years. The optical spectrum of the quasar showed strong absorption features produced by Mg I, Mg II, Fe II, and Mn II at the same redshift (Burbidge et al. 1976). The results of the optical and radio observations together indicate that this absorber has a high H I column density. Cohen et al. (1999) confirmed based on a UV spectrum of the QSO obtained with HST/STIS that the absorber is a DLA with . In the following paragraphs, we shall show that this field has previously been surveyed for the host galaxy of the QSO and the DLA galaxy by various authors using spectroscopic techniques.
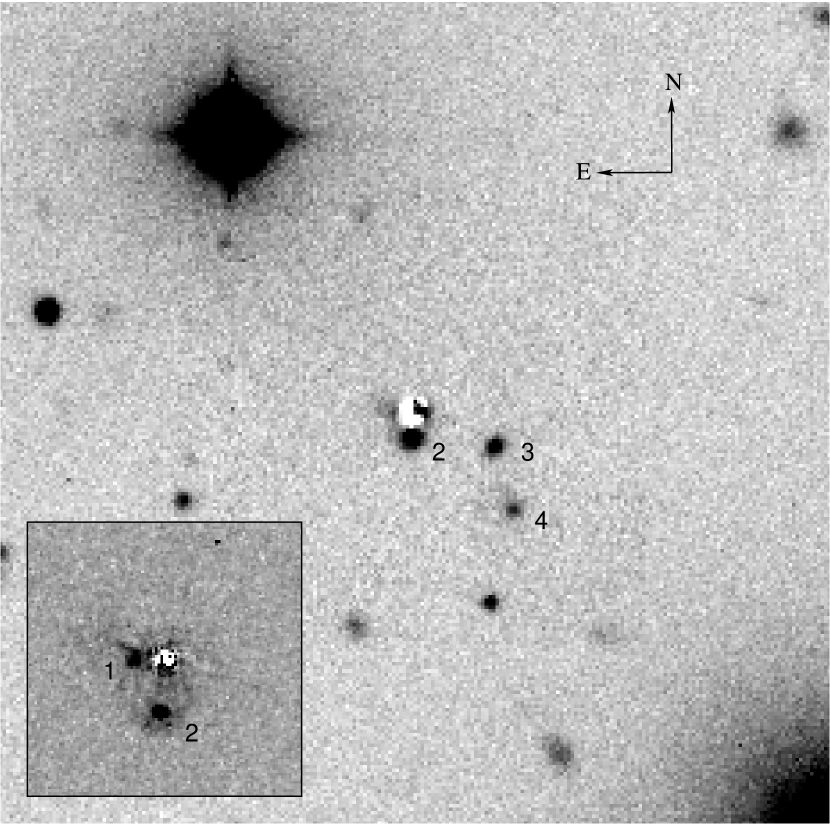
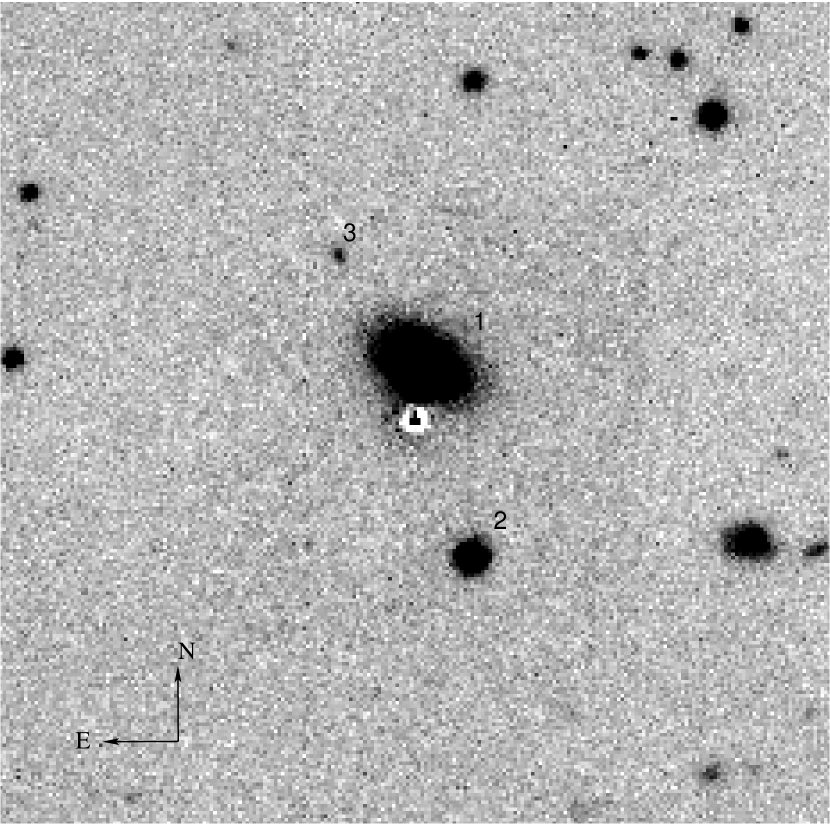
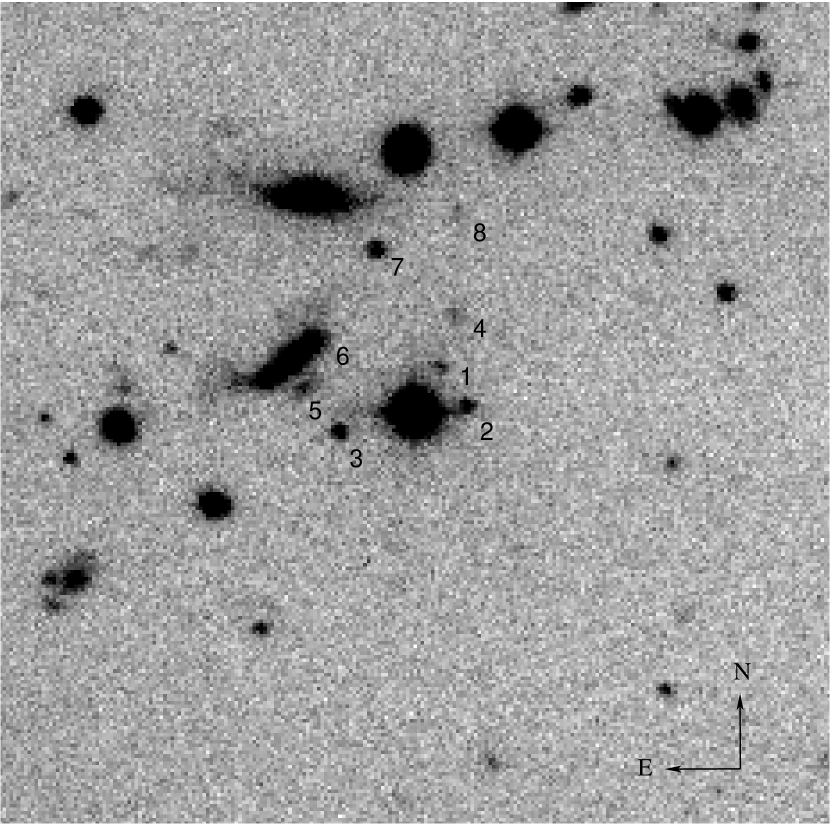
Figure 2 shows an image of the field around the BL Lac quasar obtained with the direct CCD imager on the du Pont telescope using the standard Cousins filter. The image is on a side, corresponding to kpc at . The inset shows a close-up image of the immediate vicinity around the QSO obtained with HST using WFPC2 and the F702W filter. The light from the background QSO in the ground-based image has been subtracted using an empirical PSF determined from a median of 26 stars. The light of the background QSO in the space-based image has been subtracted using a model PSF calculated in the Tiny Tim software (Krist & Hook 1997). Galaxies identified within an angular radius of to the background QSO are marked by their identification numbers (ID) in the image with the corresponding measurements presented in Table 2. In columns (1)–(11) of Table 2, we list for each galaxy the ID, Right Ascension and Declination offsets, and , from the QSO in arcseconds (′′), angular distance to the QSO , best-fit photometric redshift , spectroscopic redshift (if available), and magnitudes together with associated uncertainties in ground-based bands.
Four objects are identified at with . Object #1 at (, ) to the QSO is well resolved in the space-based WFPC2/F702W image but is heavily blended with the background QSO in all our ground-based optical images. We were unable to obtain accurate photometric measurements for this object using the ground-based data and we estimated that it has an apparent magnitude of because of the contaminating light from the PSF of the background QSO in the WFPC2/F702W image. The remaining three objects at to the QSO have . Object #2 at angular distance to the QSO is best described by a starburst template at , which coincides with the location of the DLA. Object #3 at angular distance to the QSO is best described by an E/S0 template at and object #4 at angular distance to the QSO is best described by an E/S0 template at
This field has been surveyed by various groups to locate galaxies responsible for the intervening absorption features. The results showed that objects #1 and #2, and object #3 at (,) have all been identified to have , using either narrow-band imaging (Yanny, York, & Gallagher 1989) or slit spectroscopy (Cohen et al. 1987; Stickel, Fried, & Kühr 1988; Burbidge et al. 1996; Guillemin & Bergeron 1997). In particular, object #2 is found to be a broad emission-line galaxy that shows evidence of the presence of an active nucleus (Burbidge et al. 1996). It is clear that a group of galaxies is responsible for the known DLA, which may explain the multiple absorption components observed in the 21-cm data.
In addition, we note that two galaxies further away from the QSO line of sight at (, ) and (, ) have known redshifts at and (Stickel et al. 1988; Burbidge et al. 1996). The best-fit photometric redshifts for these two galaxies are respectively and 0.25, supporting that photometric redshifts determined based on the available galaxy photometry are accurate. While our photometric redshifts are consistent with known spectroscopic redshifts for most objects in this field, the discrepancy between and for object #3 appears to be larger than the typical rms scatter measured in previous studies (e.g. Chen et al. 2003). The unusually large discrepancy inevitably casts some doubts in the reliability of photometric redshift techniques. We examined in details the photometry of this object in order to understand the source of errors, and found that the observed SED of the galaxy has a steep slope that cannot be fit by the regular templates. Stickel et al. (1988) presented a spectrum of this galaxy, which shows signatures of a late-type galaxy but with a weak [O II] emission line. The steeper slope observed in the broad-band SED and the narrow-band features seen in the galaxy spectrum together suggest that the galaxy contains a significant amount of dust. We therefore repeated the photometric redshift analysis for this object by including templates that are artificially reddened according to the formula presented in Calzetti et al. (2000) and found that the observed SED of this galaxy may be described by an Irr template at with additional reddening of .
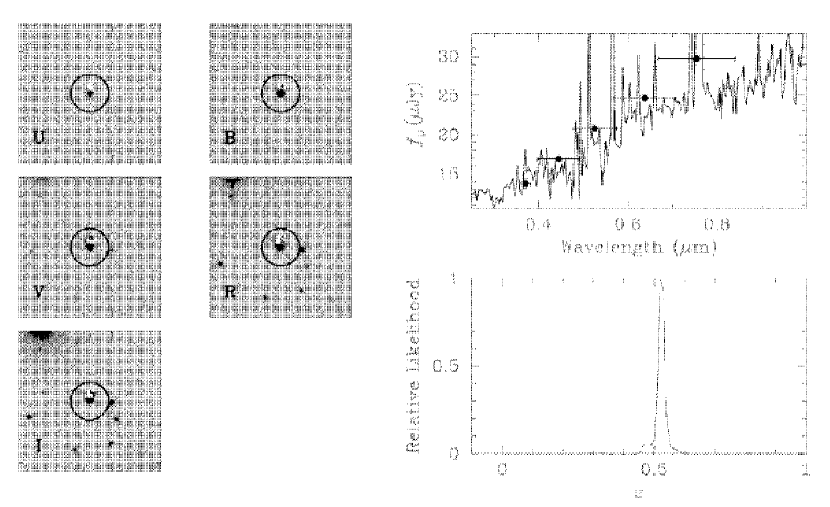
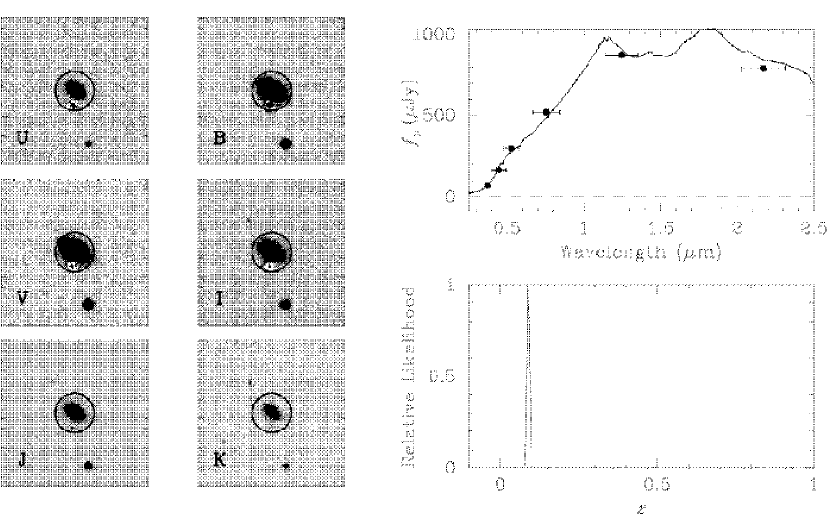
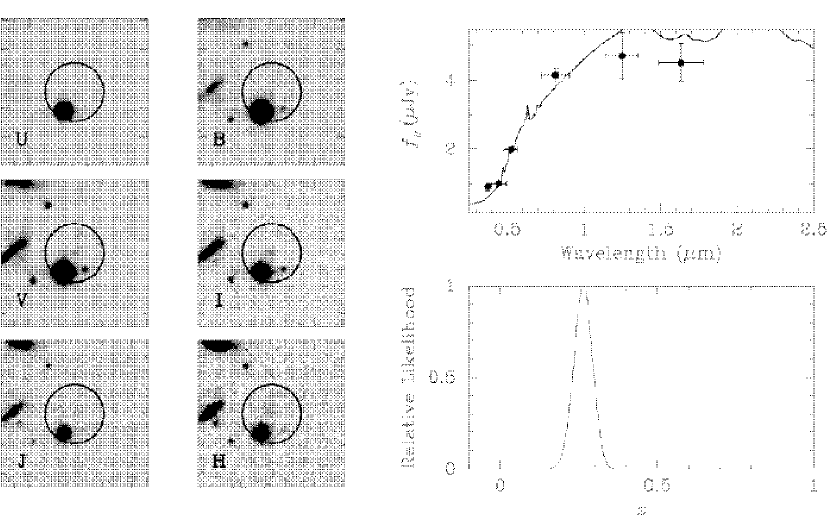
In summary, a group of galaxies is found at the redshift of the known DLA toward AO0235+164. The angular distances of these galaxies to the background QSO range from to , corresponding to kpc. The proximity of these galaxies to one another makes it difficult to associate the DLA with any one of the galaxies individually, rather it is likely that each of these galaxies is a potential DLA system as revealed in the 21-cm observations and all of them together produce the strong DLA feature observed in the spectrum of the background QSO. In the subsequent neutral gas cross section analysis, we shall adopt object #2 as the primary component for which we have accurate photometric measurements. Object #2 has a rest-frame -band absolute magnitude and a corresponding projected distance to the QSO line of sight kpc at . Figure 3 shows individual images of this system through different bandpasses on the left and a summary of the photometric redshift analysis on the right. The dimension of the image clips is on a side. The top panel on the right shows the observed SED established based on the five photometric measurements (solid points) of the galaxy, superimposed with the best-fit SB template (solid line). The bottom panel on the right shows the redshift likelihood function with a sharp peak at .
5.2 The Field toward EX 03022223
The ultraviolet spectrum of this QSO () exhibited complex, strong candidate absorption features at , 0.9874, and 0.9690 (Lanzetta, Wolfe, & Turnshek 1995). The absorber also showed strong Mg II and Fe II absorption features (Petitjean & Bergeron 1990) and was confirmed to be a DLA system with (Pettini & Bowen 1997; Lanzetta 1997, unpublished; Boissé et al. 1998). The absorber turned out to be a blend of C II feature at and N I at (Boissé et al. 1998). The absorber turned out to be a feature at (Boissé et al. 1998). Pettini & Bowen (1997) showed that Zn is only a factor of two less abundant in the DLA system than in the interstellar medium of the Milky Way, comparable to what is expected of the Milky Way at . In addition, high-resolution optical spectroscopy of the QSO revealed two distinct components 36 km s-1 apart with apparent difference in dust depletion, (Pettini et al. 2000).
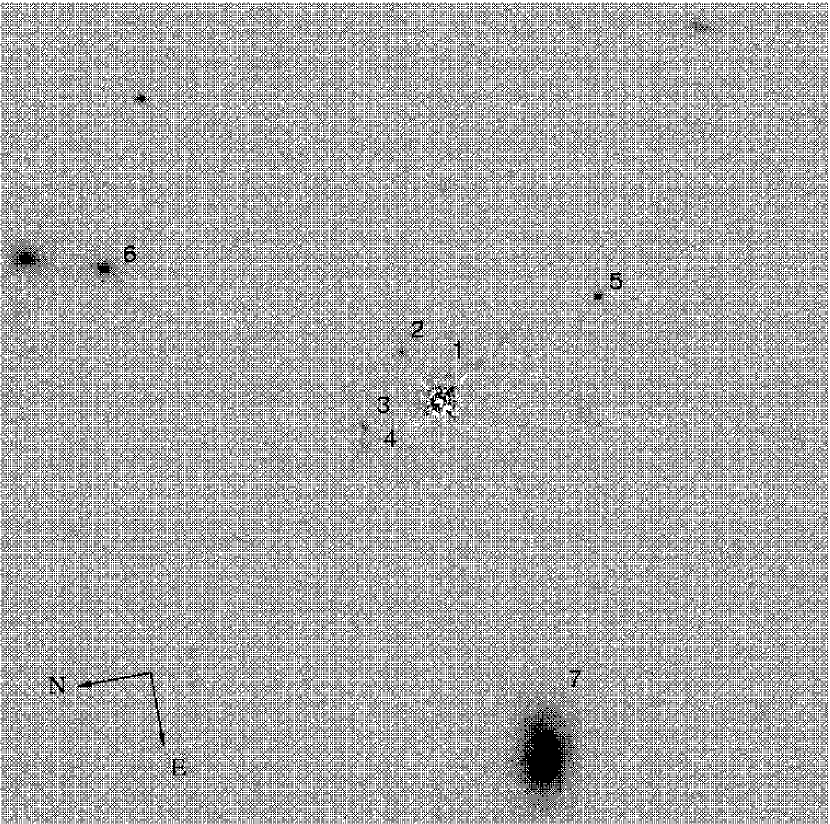
Figure 4 shows the field around the QSO obtained with the Planetary Camera on board HST using the F702W filter. The image is on a side, corresponding to kpc at . Galaxies identified at in the survey are noted by their ID in the image with the corresponding measurements presented in Table 3. In columns (1)–(11) of Table 3, we list for each galaxy the ID, , , , , (if available), and magnitudes together with associated uncertainties in the HST F450W and F702W, and ground-based , , and bands.
We have obtained photometric redshifts for seven objects at with . The results of the photometric redshift analysis show that these galaxies have redshifts ranging from to . Comparison of photometric and known spectroscopic redshifts for objects #5, #6, and #7 supports that photometric redshifts determined based on the set of photometric measurements available for galaxies in this field are accurate. We were, however, unable to obtain reliable photometric redshifts for objects #1 and #2. The two objects are well resolved in the space-based images, but are blended in the PSF of the QSO in the ground-based images. It is extremely challenging to obtain robust photometric measurements for these objects in the , , and bands as a result. In addition, objects #3 and #4 are blended together with each other, although they are well resolved from the QSO in the ground-based images. We attempted to obtain separate photometric measurements for the two galaxies based on the object extent determined in the F702W image. The associated ground-based photometry were inevitably uncertain, resulting in large uncertainties of photometric redshifts. We then determined the best-fit photometric redshift for the two objects combined on the basis of the summed fluxes presented in Table 3 for object “34”. The results in Table 3 indicate a consistent photometric redshift estimate for object #3 with or without including the second component #4.
The results of the photometric redshift analysis indicate that objects #34 and #5 are both at the redshift of the DLA. Object #34 is best described by a starburst template at , while object #5 is best described by an Sab template at . We consider object #5 unlikely to be the DLA galaxy because of the large angular distance to the QSO line of sight, which corresponds to kpc at . Object 34 is to the QSO, corresponding to kpc at . We therefore conclude that this object is the most likely DLA galaxy with .
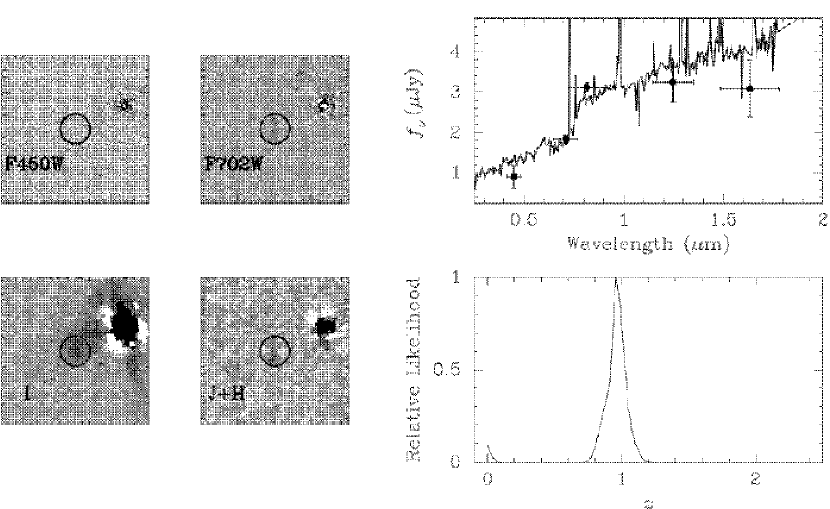
There are, however, two objects (#1 and #2) at smaller angular distances to the QSO, which Le Brun et al. (1997) attributed as the DLA galaxy candidates. Following the arguments presented in § 4.2, these two objects are either at cosmologically distinct distances away from the DLA or they are physical associated with object #34. In the second scenario, it would be difficult to associate the known DLA with either of these galaxies individually, but it would be more likely that the DLA is produced by a group of galaxies. At , object #1 would have kpc and , and object #2 would have kpc and . If a typical galaxy has and at (Chen et al. 2002), then objects #1, #2, and 34 would be respectively 0.27, 0.3, and galaxies. Based on the available data, we cannot rule out either of the two scenarios. In the subsequent neutral gas cross section analysis, we shall adopt object #34 as the DLA host galaxy for which we have a confident redshift measurement. Individual images of objects #3 and #4 together through different bandpasses and the results of the photometric redshift analysis are presented in Figure 5.
We cannot rule out the possibility that the two components in object 34 are at cosmologically distinct distances, given the available data. It is, however, interesting to find that if the second component (#4) is at the same redshift, then it appears to have relatively more intrinsic reddening according to the optical and near-infrared color, (in comparison to for #3). This is qualitatively in line with the dust depletion gradient found in the abundance analysis of elements Zn and Cr presented by Pettini et al. (2000).
5.3 The Field toward PKS0439433
The spectrum of PKS0439433 () obtained at ultraviolet wavelengths using HST/FOS exhibited a number of strong absorption features from low-ionization transitions such as Mg II, Fe II, Si II, and Al II at (Petitjean et al. 1996). A direct measurement of using the damping wings of the absorption feature is, however, not yet available. The strong associated metal absorption lines are often a robust indicator that the absorber has (e.g. Rao & Turnshek 2000), which in this case is supported by an independent work reported in Wilkes et al. (1992). These authors derived based on the X-ray absorption observed in the spectrum of PKS0439433. While a more precise estimate of in this absorber awaits ultraviolet spectroscopy of the QSO carried out at wavelength Å–where the absorption line is located, we adopt for this DLA in the subsequent discussion.
Figure 6 shows the field around the QSO obtained with the direct CCD imager on the du Pont telescope using the standard Cousins filter. The image is on a side, corresponding to kpc at . The light from the background QSO has been subtracted using an empirical PSF determined from a median of 10 stars in the image frame. Galaxies identified within an angular radius of to the background QSO are indicated by their ID in the image with the corresponding measurements presented in Table 4. In columns (1)–(12) of Table 4, we list for each galaxy the ID, and , , , (if available), and magnitudes together with associated uncertainties in ground-based bands.
We have identified three objects at with and . The results of our photometric redshift analysis showed that object #1 at angular distance to the QSO is best described by an Sab template at . Objects #2 and #3, which are further away from the lines of sight, are found to be at redshifts that are very different from the DLA. Object #1 is therefore identified as the galaxy responsible for the DLA with a rest-frame -band absolute magnitude . The corresponding projected distance of the galaxy to the QSO line of sight is kpc. Individual images of object #1 through different bandpasses and the results of the photometric redshift analysis are presented in Figure 7.
Object #1 is the lowest-redshift DLA galaxy identified in our survey. It appears to have the typical morphology of a disk galaxy and is fairly bright. The redshift estimate of this object has been confirmed spectroscopically by various authors (Petitjean et al. 1996; Chen, Kennicutt, & Rauch 2003 in preparation). The well resolved disk structure makes the galaxy-absorber pair a good system for comparisons between the kinematics and chemical abundances of the absorbers and the absorbing galaxies.
5.4 The Field toward HE 11221649
The combined IUE and optical spectra of this QSO () exhibited a strong Lyman limit system with associated Mg II and Fe II absorption features at (Reimers et al. 1995). Subsequent spectroscopy using HST/FOS confirmed the presence of a DLA with at (de la Varga et al. 2000). In addition, a more detailed analysis of different metal transitions identified in a Keck HIRES spectrum indicated that this DLA has a metallicity of solar with an abundance pattern similar to metal-poor Halo stars (de la Varga et al. 2000). Absorption profiles of the low ions such as Fe II, Mg II, Mn II also exhibited complicated, multi-component structures, which follow an edge-leading signature.
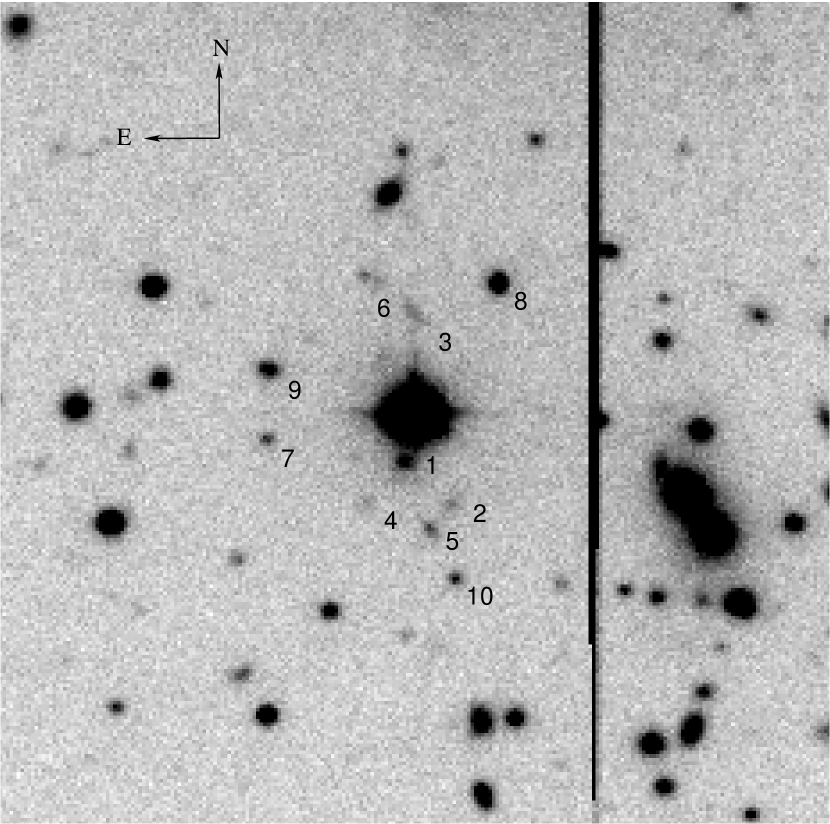
Figure 8 shows the field around the QSO obtained with the direct CCD imager on the du Pont telescope using the standard Cousins filter. The image is on a side, corresponding to kpc at . Galaxies identified within an angular radius of to the background QSO are indicated by their ID in the image with the corresponding measurements presented in Table 5. In columns (1)–(11) of Table 5, we list for each galaxy the ID, and , , , (if available), and magnitudes together with associated uncertainties in ground-based bands.
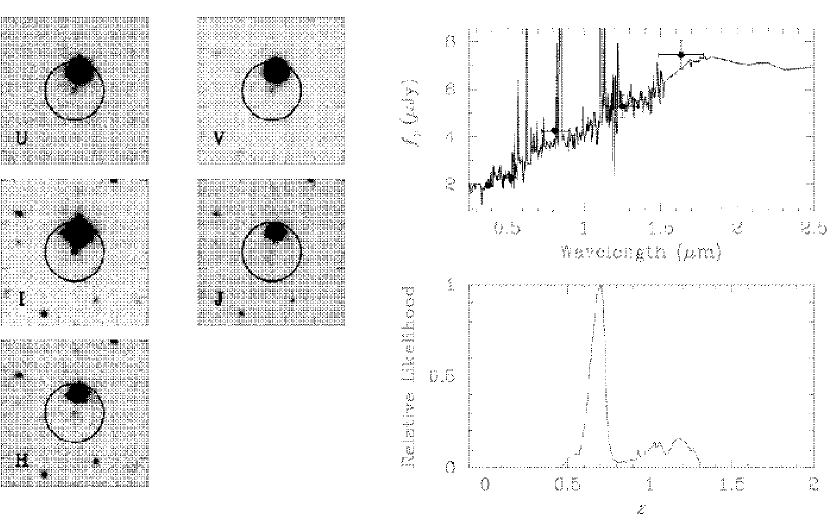
We have identified 10 objects at with and . The results of our photometric redshift analysis showed that object #1 at angular distance to the QSO is best described by a starburst template at . Object #6 at angular distance to the QSO has a best-fit redshift at , but with a large redshift uncertainty. The corresponding projected distances of objects #1 and #6 are respectively and 51.5 kpc to the QSO line of sight. In comparison to object #1, object #6 is 2.5 times fainter and three times further distant away from the line of sight. We therefore conclude that object #1 is the galaxy responsible for the DLA. It has a rest-frame -band absolute magnitude . Individual images of object #1 through different bandpasses and the results of the photometric redshift analysis are presented in Figure 9.
It is clear from Figure 8 that the field surrounding HE11221649 has an overdensity of galaxies about west of the QSO. The results of the photometric redshift analysis indicate that the galaxies are at . They are therefore not associated with the DLA. Nevertheless, the corresponding projected distance of the galaxy group to the QSO line of sight would be kpc at . A more detailed examination of metal absorption features in the QSO spectrum at the redshift of the galaxy group would help to study the ionization state and metallicity of the extended gas around these galaxies.
5.5 The Field toward PKS 1127145
The optical spectrum of this QSO () exhibited a strong system with associated Mg II and Fe II absorption features at (Bergeron & Bossié 1991). Subsequent observations in 21-cm and HST/FOS spectroscopy further showed that this system is also a strong 21-cm absorber (Lane et al. 1998) and has (Rao & Turnshek 2000). This system resembles the one toward AO0235164 in that the strong 21-cm absorption feature was further resolved into five distinct components over a velocity interval of km s-1 in follow-up 21-cm observations and exhibited variability in the absorption line strength over the time scale of a few days (Lane 2000; Kanekar & Chengalur 2001). Finally, recent spectroscopic observations of the QSO with Chandra suggested that the absorbing gas of the DLA has metallicities of at most 20% of the typical solar values (Bechtold et al. 2001).
Figure 10 shows the field around the QSO obtained with the direct CCD imager on the du Pont telescope using the standard Cousins filter. The image is on a side, corresponding to kpc at . Galaxies identified within an angular radius of to the background QSO are indicated by their ID in the image with the corresponding measurements presented in Table 6. In columns (1)–(12) of Table 6, we list for each galaxy the ID, and , , , (if available), and magnitudes together with associated uncertainties in ground-based bands.
We have identified eight objects at with and . The results of our photometric redshift analysis showed that object #1 at angular distance to the QSO is best described by an Scd template at . Objects #2 also at angular distance to the QSO is best described by a starburst template at at . Object #6 at angular distance to the QSO is best described by an Sab template at at . The corresponding projected distances of objects #1, #2, and #6 are respectively , 12.2, and 31.5 kpc to the QSO line of sight. In spite of a projected distance of about three times further away, object #6 is more than 15 times brighter than objects #1 and #2. By way of illustration, we present in Figure 11 individual images of object #1 through different bandpasses and the results of the photometric redshift analysis for this galaxy.
Bergeron & Boissé (1991) obtained spectra for object #6 and a galaxy at (”,”) to the QSO line of sight. They measured the redshifts of the two galaxies to be and 0.312, respectively. Deharveng, Buat, & Bergeron (1995) further estimated the oxygen abundance of object #6 to be approximately 30% of the solar value, which is in an interesting agreement with the abundance determined for the X-ray absorbing gas by Bechtold et al. (2001). Lane et al. (1998) reported a redshift identification of object #2 at , yielding a total of three known galaxies at the redshift of the DLA. The results of our photometric redshift survey add one more galaxy (object #1) to the group of galaxies at the DLA redshift.
In summary, a group of at least four galaxies are found at the redshift of the known DLA toward PKS1127145. The angular distances of these galaxies to the background QSO range from to , corresponding to kpc. The rest-frame -band absolute magnitudes of the galaxies range from to . This is the second DLA known to arise in a group of galaxies and have resolved absorption components in the 21-cm observations. Because of the proximity of these galaxies to the QSO line of sight, it is difficult to separate the contribution of either of the galaxies to the DLA. Despite the ambiguity in the contributions of the group galaxies to the observed DLA, we shall assign the absorber to object #2 in the subsequent gas cross section analysis because it is a factor of 1.7 times brighter than object #1 at the same projected distance away from the sightline.
6 A LARGE SAMPLE OF DLA GALAXIES AT
As an important step toward understanding the physical nature of DLA galaxies, we need to first identify a large sample of galaxies that give rise to these absorption systems observed in the spectra of background QSOs. It has been, however, difficult not only because of the challenges of observing faint galaxies close to bright, background QSO, but also because of the small number of DLAs known in the literature. Various DLA surveys carried out along random lines of sight have yielded consistent estimates from which we expect to find three DLAs per 10 lines of sight between and 3.5 and no more than one DLA per 10 lines of sight between and 1 (e.g. Storrie-Lombardi & Wolfe 2000; Rao & Turnshek 2000; Ellison et al. 2001). Individual DLA systems have been reported separately from targeted surveys of QSOs that occur close to the centers of foreground galaxies (Miller, Knezek, & Bregman 1999; Bowen, Tripp, & Jenkins 2001). Despite extensive searches, there are only a total of 21 DLAs discovered at .
We have completed a survey of galaxies in five QSO fields with known DLAs. In all five cases, galaxies or galaxy groups that give rise to the DLAs are successfully identified using photometric redshift techniques. As discussed in § 4.2, the precision of photometric redshifts is sufficient for identifying DLA galaxies, because DLAs are rare and their intrinsic high column density implies a small impact parameter of the host galaxy to the QSO line of sight. Furthermore, we continue to examine the accuracy of our photometric redshift measurements in every field whenever known spectroscopic redshifts are available. Comparison of photometric redshifts and known spectroscopic redshifts for 11 galaxies in these five fields confirms that the photometric redshifts are accurate with an rms residual between spectroscopic and photometric redshifts of (Figure 12).
In addition to the five DLA galaxies that we presented in this paper, there are six DLA galaxies identified by various authors. There are therefore 11 DLA galaxies known with robust redshift measurements, which are more than half of the total number of DLAs known at . We briefly summarize the properties of these six additional DLA systems below.
LBQS00580155 (): Pettini et al. (2000) reported the discovery of a DLA toward this QSO at with in an HST/FOS spectrum. A detailed study of chemical abundances of the absorber by these authors showed that the absorbing gas has near-solar metallicity. They further reported, after a careful examination of an HST/WFPC2 image of the field, that a late-type disk galaxy away from the QSO is likely to be the absorbing galaxy. This object has been confirmed spectroscopically to be at (Chen, Kennicutt, & Rauch 2003, in preparation) and is therefore identified as the DLA galaxy at kpc to the QSO line of sight.
Q0738313 (): Rao & Turnshek (1998) reported the discovery of two DLAs toward this QSO at and with and , respectively. Subsequent spectroscopic surveys of galaxies in the field uncovered a compact galaxy at and away from the QSO line of sight, corresponding to kpc (Turnshek et al. 2001; Cohen 2001). Cohen also reported the identification of a galaxy at and away from the QSO line of sight that might be responsible for the system at . The large redshift and angular separations of the galaxy and absorber pair, however, raise doubts in the validity of the identification. In the subsequent analysis, we adopt the brightness limit as determined by Turnshek et al. (2001) for the unknown absorbing galaxy.
B2 0827243 (): Rao & Turnshek (2000) reported the discovery of a DLA toward this QSO at with . Steidel et al. (2002) identified a highly-inclined disk galaxy at and away from the background QSO, corresponding to kpc. Rao et al. (2003) presented photometric measurements of the galaxy and found that the observed SED of the galaxy may be described by a galaxy at that had recently undergone two episodes of star-forming events.
TON 1480 (): This QSO occurs behind a nearby early-type galaxy NGC4203 at , around away ( kpc at ) from the galactic center. Miller, Knezek, & Bregman (1999) obtained an ultraviolet spectrum of the QSO with HST/STIS and reported the detection of a DLA at the redshift of the foreground galaxy with . In addition, they found that the absorbing gas is co-rotating with the gaseous disk of the galaxy. Accompanied with the DLA are metal absorption features produced by Mg II, Fe II, and Mn II, but the elemental abundances of these species are estimated to be significantly below the typical solar values.
HS15435921 (): This QSO occurs behind a nearby low surface brightness (LSB) galaxy SBS1543593 at , only away ( kpc at ) from the galactic center. Bowen, Tripp, & Jenkins (2001) obtained an ultraviolet spectrum of the QSO with HST/STIS and reported the detection of a DLA at the redshift of the foreground galaxy with . Accompanied with the DLA are strong metal absorption features produced by Si II, C II, and O I.
PKS1629120 (): Rao et al. (2003) reported the discovery of a new DLA toward the QSO at with in recent HST/STIS observations. These authors also obtained images of the field and identified a disk galaxy at away from the background QSO. They found that the observed SED of the galaxy may be described by a young galaxy at that had recently undergone a single burst of star formation. Follow-up spectroscopy confirms that this galaxy is at (Chen, Kennicutt, & Rauch 2003, in preparation) and the corresponding projected distance is kpc
A list of the 11 DLAs with the absorbing galaxies identified is presented in Table 7. In columns (1)–(9) of Table 7, we list for each system the name of the background QSO, the QSO emission redshift , the redshift of the DLA , , the angular distance of the DLA galaxy to the QSO in arcsec, the corresponding projected distance , the observed brightness in the magnitude system, the corresponding rest-frame -band absolute magnitude , and its visual morphology—whether it is bulge dominated (compact), disk dominated, or irregular. In addition, we have shown in §§ 5.1 and 5.5 that the DLAs toward AO0234164 and PKS1127145 arise in a group of galaxies. We therefore included all the identified group members in Table 7. Finally, the DLA at toward Q0738313 and the DLA at toward PKS162223 have been surveyed extensively for the absorbing galaxies by various groups (Turnshek et al. 2001; Cohen 2001; Steidel et al. 1997) but remain unidentified. We include these two systems at the end of Table 7, listing the brightness limits of the absorbing galaxies, for the purpose of completeness.
The galaxies presented in Table 7 represent the first large sample of galaxies that are found with secure redshift measurements to give rise to 11 known DLAs. We note, however, that two systems toward TON 1480 and HS15435921 were discovered in targeted searches of DLAs with a prior knowledge of the foreground absorbing galaxies. The differences in the selection criteria of these two systems complicates follow-up statistical analyses. To facilitate our subsequent analysis, we define a “homogeneous” sample of DLA galaxies that contains nine DLA systems discovered in random lines of sight, and an “inhomogeneous” sample of DLA galaxies that includes the two additional systems discovered in targeted DLA searches.
The galaxy and absorber pairs in the homogeneous sample span a redshift interval from to —covering 60% of the current universe age—with a median redshift , and have absolute -band magnitude ranging from to . Impact parameter separations of the galaxy and absorber pairs range from to kpc with a median of kpc.
7 THE NATURE OF DAMPED ABSORBING GALAXIES
An important aspect of the DLA galaxy sample is that these galaxies are selected uniformly on the basis of known neutral gas content ( ). They represent a galaxy population that contains the bulk of neutral gas in the universe and is complementary to galaxies selected based on the stellar content. In this section, we shall focus on understanding the nature of galaxies that produce known DLAs at and study the neutral gas content of intermediate-redshift galaxies using the DLA galaxy sample.
7.1 H I extent of intermediate-redshift galaxies
We first study the H I column density distribution versus impact parameter using the inhomogeneous DLA galaxy sample and compare the distribution with known H I surface density profiles observed in nearby galaxies. The goal here is to determine the extent of neutral hydrogen gas of intermediate-redshift galaxies selected by their association with known DLAs. Hence all of the galaxies that are observed to possess extended H I are included in the analysis presented here.
Figure 13 shows versus for the 11 galaxy and absorber pairs in the inhomogeneous DLA galaxy sample. Mean H I surface density profiles measured from 21-cm observations of nearby galaxies of different morphological type and intrinsic luminosity are presented in different curves (Cayatte et al. 1994; Uson & Matthews 2003). The thick error bars in the upper-right corner indicates both the scatter of at the Holmberg radii of Sd-type galaxies observed in 21-cm data and the scatter of the H I extent at (Cayatte et al. 1994). The two DLAs found to arise in groups of galaxies are marked in circles. We use different sizes of the symbols to indicate the intrinsic luminosity of these galaxies in the left panel and redshifts in the right panel (see the figure caption). Despite the apparent large scatter in the H I column density distribution, we see two interesting features. First, the H I column density observed in DLAs is not grossly different from the mean H I distribution of nearby galaxies, although we note that measurements obtained in 21-cm observations are smoothed over a finite beam size. Second, while the H I extent of these intermediate-redshift galaxies appears to be comparable to that of nearby galaxies, most DLAs tend to lie at slightly larger radii of the absorbing galaxies for a given .
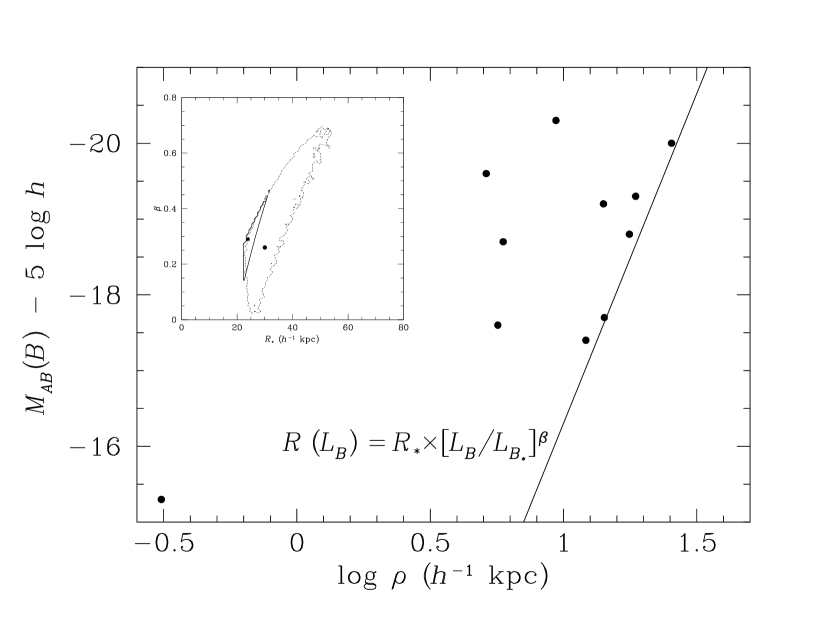
Next, we study the distribution of versus . The objectives are to determine how the H I extent of the galaxies scales with intrinsic luminosity and to obtain a quantitative estimate of the total neutral gas cross section of individual galaxies. The data presented in Figure 14 exhibit an apparent envelope that stretches to larger at brighter , suggesting that brighter galaxies have more extended H I gas. To proceed with our analysis, we adopt a model to describe the distribution of neutral hydrogen gas around individual galaxies. We consider both a uniform sphere model and a uniform disk model, and assume a power-law relation between the H I extent and the intrinsic -band luminosity of the host galaxy,
| (2) |
where is the characteristic H I radius of an galaxy.
The disk model is more favorable for the purpose of testing the hypothesis that the DLAs arise in the progenitors of present-day disk galaxies. But because of unknown inclination and orientation of the gaseous disks, the sphere model allows us to obtain an empirical measure of the H I extent that represents a lower limit to the size of the underlying disks. Here we determine best-fit and for both models and compare the results at the end.
For a uniform sphere model, we employ a maximum likelihood analysis to determine and . Under this scenario, the probability of finding a galaxy of -band luminosity in the projected distance interval and that produces a DLA in the spectrum of a background QSO is
| (3) |
Equation (3) represents a simple gas cross section argument that a random line-of-sight is more likely to run through gaseous clouds at larger radii because of larger allowed area. The likelihood of observing galaxies producing DLAs at different projected distances is therefore given by
| (4) |
We find from the likelihood analysis that and for (Ellis et al. 1996). The corresponding 2- error contour is presented as the thick line in the inset of Figure 14 with the best-fit parameters marked by the solid square. The best-fit scaling relation is indicated by the straight line in Figure 14 as well. This result applies over the -band luminosity interval spanned by the observations. We note that the scaling relation is not well determined at fainter -band luminosity, because there is only one data point at (at and kpc) which does not place a strong constraint in the likelihood analysis.
For a uniform disk model, we perform a Monte Carlo analysis to account for the uncertainties in the inclination and orientation of the underlying gaseous disk. First, we assign random inclination and orientation angles to describe the gaseous disk around each of the 11 DLAs, allowing that the probability of finding a gaseous disk of is proportional to . Next, we calculate the corresponding galactocentric distance between the absorber and the associated galaxy according to
| (5) |
Next, we determine a set of best-fit and by performing the maximum likelihood analysis summarized in the previous paragraph with the probability rewritten as
| (6) |
Finally, we repeat the procedures 10,000 times. The results from the Monte Carlo analysis are shown in the inset of Figure 14. We find that the H I extent of individual galaxies under a uniform disk model is best characterized by kpc and as indicated by the solid circle. The thin dotted line represents the 95% uncertainty contour.
Comparison of the best-fit and in Figure 14 from two adopted models shows that while there is a large systematic uncertainty in the characteristic radius because of unknown disk alignment, the scaling exponent has consistent best-fit values based on the available data. Combining the results of the maximum likelihood analysis and the Monte Carlo simulations, we conclude that the scaling relation between galaxy -band luminosity and H I extent at may be described by equation (2) with
| (7) |
and
| (8) |
The errors in equation (7) indicate the 67% one-parameter confidence interval of for a uniform gaseous disk model. The uncertainty interval in equation (8) indicates the likely allowed by the inhomogeneous sample with an uncertain alignment of the underlying gaseous disk.
Cayatte et al. (1994) presented H I surface density profiles for 84 field galaxies in the local universe from 21cm observations. The data showed that , where is the H I extent of these galaxies at and is the extinction corrected optical radius ( from de Vaucouleurs et al. 1976). We estimate that kpc for an galaxy, using nine galaxies in this field sample for which an absolute distance measure has been determined by the HST Key Project to Measure the Hubble Constant (Freedman et al. 2001). Consequently, we find kpc at for nearby galaxies. It appears from equation (8) that the H I extent of intermediate-redshift galaxies is marginally larger than that of local galaxies, although with a large uncertainty.
7.2 The incidence of DLA versus galaxy luminosity
The scaling relation discussed in § 7.1 was derived from galaxies that are known to produce DLAs in the spectra of background QSOs. It is characteristic of the H I extent of the galaxies selected by their association with known DLAs, but it is not clear whether the scaling relation is also representative of those galaxies that are not included in the DLA galaxy sample. To address this issue, we compare the observed incidence of the DLAs as a function of galaxy -band luminosity with models derived from adopting a known galaxy luminosity function and a scaling relation between the total H I gas cross section and galaxy -band luminosity. The objective is to determine how the neutral gas cross section is distributed among galaxies of different intrinsic luminosity.
We restrict our analysis to the homogeneous sample, because the models derived from a known galaxy luminosity function is equivalent to a volume-limited galaxy survey (see equation 9 below). The DLAs in the homogeneous sample are selected from random lines of sight and therefore satisfy the requirement. This approach also allows us to obtain an independent estimate of the scaling relation between neutral gaseous extent and galaxy -band luminosity for comparison with the results presented in § 7.1.
We first examine the observed luminosity distribution of the nine DLA galaxies in the homogeneous sample. Figure 15 shows that all of the nine DLAs selected from random lines of sight arise in galaxies brighter than or equivalently for an (Ellis et al. 1996), and none arises in fainter galaxies111We leave out the two systems toward Q0738313 and PKS162223 in our analysis here because the absorbing galaxies can be arbitrarily bright or faint, if they are hidden underneath the PSF of the background QSOs.. The observations indicate that luminous galaxies of dominate the neutral gas cross section of the universe.
There are, however, ambiguous cases like the DLAs toward AO0235164 and PKS1127145, for which we found a group of galaxies that give rise to the known DLAs. It is important to examine whether the conclusion that luminous galaxies dominate the neutral gas cross section would hold if we had selected a different galaxy in the group for the two absorbers. In the field toward AO0235164, object #1 at angular distance to the QSO line of sight is only resolved in a space-based image and has % of the flux observed in object #2 which we have selected as the primary component of the DLA. Assuming that object #1 has the same SED as object #2, we work out that it has . In the field toward PKS1127145, object #1 has and is at the same angular distance to the QSO line of sight as object #2 which we have selected as the primary component of the DLA. If we substitute these two galaxies as the primary components toward the two lines of sight, then we have one galaxy (out of nine total) fainter than and none fainter than . Therefore, the conclusion that luminous galaxies dominate the neutral gas cross section remains valid.
The observed incidence of DLAs produced by galaxies of different properties may be modeled by adopting a known galaxy luminosity function and assuming that every galaxy is surrounded by an H I gaseous disk of radius . We note that can be a function of different galaxy parameters , such as intrinsic luminosity and/or morphological type, but for the present analysis we shall focus on the case where . The mean number of DLAs per unit redshift interval that we expect to find in galaxies of -band luminosity in the interval to is
| (9) |
where is the speed of light, is the H I absorbing gas cross section of a gaseous disk with accounting for the effective impact area of the disk due to disk inclination, and is the galaxy luminosity function.
Adopting a known galaxy luminosity function from typical faint galaxy surveys and the power-law relation defined in equation (2) for , we can then determine the characteristic radius and scaling exponent using the homogeneous DLA galaxy sample. For a given DLA, the probability of finding a galaxy in the luminosity interval and and the impact parameter interval and is defined from equation (9) as
| (10) |
where is related to according to equation (5) for an inclined gaseous disk of and , has been substituted with a Schechter function characterized by and a faint-end slope , and is the mean gas cross section averaged over all probable inclination angles. The mean gas cross section takes into account the fact that the probability density of finding a gaseous disk of is . If the inclination and orientation of each of the gaseous disk are known, then and can be determined using a maximum likelihood analysis in which the likelihood of observing an ensemble of nine galaxies responsible for nine previously known DLAs is the product of over –9.
Because of uncertainties in the orientation of the underlying gaseous disks, we attempt to solve the best-fit scaling relation using a Monte Carlo method. As described in § 7.1, we first assign each DLA galaxy a random inclination and orientation angle for the gaseous disk. Then we perform the likelihood analysis to determine the best-fit scaling relation. Finally, we repeat the process 10,000 times to find the most likely and that best describe the observations.
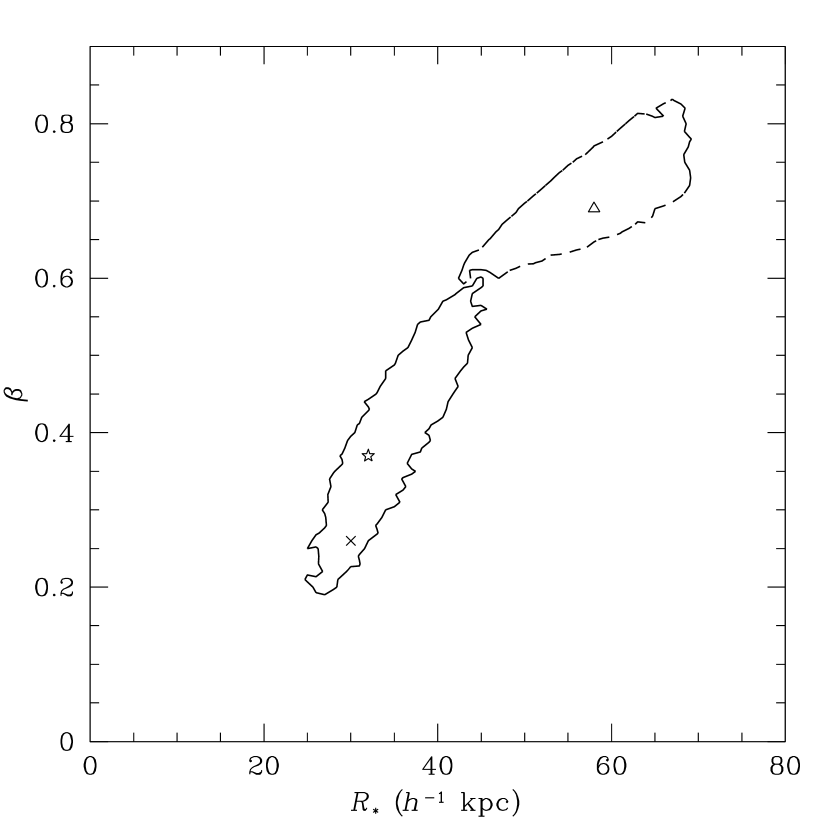
The results are presented in Figure 16 for a Schechter luminosity function characterized by and (Ellis et al. 1996). We find that a scaling relation characterized by kpc and (the triangle in the figure) best describes the observed incidence of DLAs as a function of , if we apply the same scaling relation over the entire -band luminosity interval. The corresponding 95% error contour is shown in the dashed line. It is evident that the best-fit scaling relation is driven to large and steep due to a lack of DLA galaxies that are fainter than in our homogeneous sample. This scaling relation naturally lends more weight on intrinsically luminous galaxies, but the predicted large gaseous extent kpc for an -type galaxy is inconsistent with the impact parameter distribution presented in Figure 13 and is therefore unlikely to be correct.
Motivated by the absence of faint galaxies responsible for the known DLAs, we repeat the Monte Carlo analysis and impose a cut-off in the gas cross section for galaxies fainter than . The best-fit scaling relation is indicated by the star in Figure 16 at kpc and . The corresponding 95% error contour is shown in the solid line. The predicted gaseous extent for an -type galaxy is consistent with the impact parameter distribution presented in Figure 13 and the scaling law agrees well with the optical Holmberg relation (1975). For comparison, we also include in Figure 16 the best-fit scaling relation described in § 7.1 for the inhomogeneous DLA galaxy sample (the cross). We find that the best-fit scaling relation determined from imposing a gas cross section cut-off at faint magnitudes is consistent with the results presented in equations (7) and (8) .
The predicted incidence of DLAs versus galaxy -band luminosity based on the scaling relation characterized by kpc and at is presented as the solid curve in Figure 15 for comparison with the observations. The dashed curve shows the expectation from extrapolating the scaling relation to fainter magnitudes. According to the model, if the best-fit scaling relation obtained at applies to galaxies at fainter magnitudes, then they do not contribute to more than 44% of the total H I gas cross section at . We note that of all the 21 DLAs known at , nine have been identified with galaxies of and two are uncertain. If the scaling relation applies to galaxies of , then it implies that almost all of the remaining 10 DLAs would be produced by galaxies fainter than . Because the DLA galaxies have been selected from random lines of sight by various authors, we find it unlikely that our DLA galaxy sample is biased toward luminous galaxies.
Furthermore, comparison of the observed DLA number density at and the prediction from equation (9) offers an additional constraint on the contribution from faint galaxies to the total H I gas cross section. Rao & Turnshek (2000) measured the number density of DLAs per unit redshift per line of sight and reported at . Integrating equation (9) over the luminosity interval of for a luminosity function characterized by , , and (Ellis et al. 1996) and a scaling relation characterized by kpc and , we find that at . The predicted number density from luminous galaxies alone can already explain all the observed DLAs in QSO absorption line surveys, supporting that the scaling relation for dwarf galaxies may be substantially different from equations (7) and (8) and a large contribution from dwarf galaxies to the neutral gas cross section is not necessary.
In summary, our analysis shows that the observed incidence of DLAs as a function of galaxy -band luminosity follows the expectation derived from a gas cross section weighted galaxy luminosity function at and that dwarf galaxies have a negligible contribution to the total H I gas cross section. On the other hand, a targeted DLA survey toward the low surface brightness galaxy (HS15435921) of did reveal a DLA feature in the background QSO at kpc. It is therefore clear that dwarf galaxies () do contain H I gas. Consequently, the imposed cut-off at necessary to obtain a reasonable best-fit suggests that dwarf galaxies have neutral gas cross section that is scaled down from that of more luminous galaxies.
7.3 Evolution with redshift
The homogeneous sample of DLA galaxies also allows us to examine the redshift evolution of intrinsic -band luminosity of the galaxies selected from known DLAs. Because these DLA galaxies trace the bulk of neutral gas in the universe, the objective is to study whether there exists a steep evolution in their intrinsic luminosity as reported in various magnitude-limited surveys of field galaxies (see e.g. Lilly et al. 1996). Figure 17 shows the distribution of rest-frame -band absolute magnitude versus redshift for the 11 DLAs (closed circles) that have been surveyed so far, including the two systems for which no absorbing galaxies have yet been found (indicated by arrows). The two systems that are found to arise in groups of galaxies are marked with open triangles. For comparison, we also include in the plot the two additional systems from the inhomogeneous DLA galaxy sample (open circles). Considering only the systems that are associated with individual galaxies (excluding the open triangles), we find no indication of steep brightening in the intrinsic luminosity of the host galaxies from to . We note, however, that this result is still limited by the small number of DLAs known at low redshift.
7.4 Morphology and galaxy environment
One of the primary objectives of our study is to resolve the puzzle of the apparent low metallicity measured in these systems. It is not clear whether the low metallicity determined for the DLAs occurred as a result of metallicity gradient commonly observed in nearby disk galaxies (e.g. Henry & Worthey 1999; Kennicutt, Bresolin, & Garnett 2003) or as a result of the diversity in the morphology of the DLA galaxies. Based on the homogeneous sample of DLA galaxies, we find that the morphological types of the DLA galaxies are directly observed to range from compact galaxies (e.g. the DLA toward HE11221649) through normal spiral galaxies (e.g. the DLA toward PKS0439433) through low surface brightness galaxies (e.g. the DLA toward EX03022223). Specifically, of the 11 DLAs studied, four arise in disk-dominated galaxies (45%), two in bulge-dominated galaxies (22%), one in an irregular galaxy (11%), and two are in galaxy groups (22%).
It is evident from the available data that DLAs probe galaxies of different morphology and galactic environment, consistent with previous findings (e.g. Le Brun et al. 1997). However, we caution possible systematic biases against detections of low surface brightness stellar disks in the ground-based images. In addition, various studies have shown that galaxies exhibit different morphologies in different bandpasses, but we have not accounted for this morphological -correction in our discussion. The bias is likely to be more significant for galaxies at higher redshifts. For example, the DLA galaxy toward EX03022223 appears to show irregular structures in the F702W bandpass. At , the observed F702W bandpass corresponds to the rest-frame -band, in which local disk galaxies often appear to be irregular (e.g. Windhorst et al. 2002). High spatial resolution images obtained in the near infrared will be needed for a more reliable assessment for this particular system. For the DLA galaxies at lower redshift, future HST images obtained through two bandpasses will be crucial for confirming our initial classifications using ground-based images.
We also note that the two strongest DLAs presumed to arise in galaxy groups with exhibit unusual properties that are strikingly similar (Figure 13; points in open circle). First, they exhibit variability in the absorption line strengths over the course of a few days to six months (Wolfe et al. 1982; Kanekar & Chengalur 2001). Second, there exist distinct components in the 21-cm absorption profiles observed against the background QSOs, which span a velocity range of km s-1 (Wolfe et al. 1982; Lane 2000; Kanekar & Chengalur 2001). Both sets of observations indicate that neither of the DLAs is likely to arise in a single large H I cloud. These properties together suggest that the underlying gaseous environment is different from those in typical galaxies. Two additional DLAs at are estimated to have , one at toward Q0218357 and the other at toward Q0248430 (Rao & Turnshek 2000). Future high spectral resolution 21-cm monitoring of these absorbers will provide further clues on whether or not these very high column density DLAs arise preferentially in denser galaxy environment.
8 COMPARISON WITH PREVIOUS WORK
The long-standing belief that the DLAs probe the gaseous progenitors of present-day luminous galaxies at high redshift (see Wolfe 1995) is challenged by various reports that dwarf galaxies dominate the galaxy population that produces the DLAs at (Le Brun et al. 1997; Colbert & Malkan 2002; Rao et al. 2003). Our results have, however, demonstrated that dwarf galaxies do not dominate the neutral gas cross section, consistent with the results of a recent study of H I gas cross section of nearby galaxies (Ryan-Weber, Webster, & Staveley-Smith 2003). Here we compare our study with those published by previous authors in order to understand this discrepancy.
Le Brun et al. (1997) observed six QSO fields with known DLAs at using HST/WFPC2 and identified candidate DLA galaxies based on their close proximity to the QSO lines of sight. Adopting the F702W-band photometric measurements of these candidate galaxies presented by the authors and the cosmology, we find that these candidates span a -band absolute magnitude range from to with one fainter than , two in , and three brighter than . This is not inconsistent with the predicted incidence of DLAs that we presented in § 7.2.
Rao et al. (2003) presented results from a photometric redshift survey of four QSO fields with known DLAs. These authors successfully identified the absorbing galaxies for three systems using photometric redshift techniques and reported the detection of a candidate galaxy in a -band image. Rao et al. collected a sample of 14 candidate DLA galaxies at , for which only five galaxies have secure redshifts available. They conclude that low-luminosity dwarf galaxies with small impact parameters dominate the bulk of the neutral hydrogen gas in the universe at and that the highest column density systems arise in low surface brightness dwarf galaxies. These conclusions are in complete disagreement with ours presented in § 7. Here we investigate possible reasons that may have resulted in the gross discrepancy.
Our DLA sample overlaps with the Rao et al. sample in six fields, AO0235164, EX03022223, Q0738313 (the DLA at ), B2 0827243, PKS1127145, and PKS1629120. These authors attributed the DLAs toward AO0235164 and PKS1127145 to the faintest galaxies in the groups found at the absorber redshifts. They also attribute the DLA toward EX03022223 to the candidate galaxy that has been found at the closest angular distance to the QSO line of sight, following Le Brun et al. (1997). Of the six overlapping fields, Rao et al. concluded that three DLAs arise in galaxies fainter than , while the other three DLAs arise in galaxies brighter than . This is qualitatively consistent with the expectation derived in § 7.2. It appears that the large discrepancy comes primarily from the remaining eight DLA fields, for which no reliable redshift measurements are available.
However, the fields toward AO0235164 and PKS1127145 are known to have groups of galaxies at close distances to the DLAs. Each of these galaxies is likely to contribute to the observed DLA features, as suggested by the 21-cm observations. Consequently, the conclusion that the highest column density systems arise in low surface brightness dwarf galaxies needs to be re-evaluated.
In addition, there is a systematic uncertainty in the definition of dwarf systems induced by the differences in optical and near-infrared galaxy luminosity, which is clearly present in Rosenberg & Schneider (2003). These authors estimated the contribution of H I-rich galaxies to the DLA population at using an H I mass function derived from a blind 21-cm survey. While these authors concluded that galaxies of H I masses dominate the total neutral hydrogen gas, they also showed a flat distribution in the versus -band luminosity plot. It indicates that a large fraction of DLAs should arise in near-infrared faint galaxies. We emphasize, however, that whether or not “dwarf” galaxies have a substantial contribution to the neutral gas cross section is still uncertain, because a large scatter between H I mass and is evident (see their Figure 4). The corresponding spans at least three orders of magnitude for a given , which is likely to flatten the distribution of versus .
In summary, we find that the luminosity distribution of the candidate DLA galaxies in Le Brun et al. is consistent with the results of our analysis in § 7.2 that dwarf galaxies () do not dominate the neutral gas cross section in the universe . The main conclusion from Rao et al. that dwarf galaxies have significant contributions to the neutral gas cross section needs to be re-evaluated, when luminosity uncertainties of their DLA galaxies are taken into account.
9 SUMMARY AND CONCLUSIONS
We presented results from a photometric redshift survey of galaxies in five QSO fields with known DLAs. In all five cases using photometric redshift techniques, we have identified the galaxies or galaxy groups that are responsible for the known DLAs. We demonstrate that the precision of photometric redshifts is sufficient for identifying DLA galaxies, because DLAs are rare and because their intrinsic high column density implies a small impact parameter of the host galaxy to the QSO line of sight. Comparison of photometric redshifts and known spectroscopic redshifts for 11 galaxies in these fields also confirms that the photometric redshifts are accurate to within an rms uncertainty of . Combining the results of our survey with known DLA galaxies that have been previously identified using spectroscopic or photometric redshift techniques, we have collected 11 DLA galaxies at for which reliable redshift measurements are available. This is more than half of the total number of DLAs known at .
However, the differences in the selection criteria of these DLA systems make any statistical analysis using the entire sample complex and difficult. We have therefore defined a “homogeneous” sample of DLA galaxies that contains nine DLA systems discovered in random absorption lines surveys, and an “inhomogeneous” sample of DLA galaxies that includes the two systems discovered in targeted DLA searches. Redshifts of the DLA galaxies in the homogeneous sample range from to —covering 60% of the current universe age. Absolute -band magnitude of the galaxies range from to . Impact parameter separations of the galaxy and absorber pairs range from to kpc. We determined neutral gas extent of luminous galaxies using the inhomogeneous DLA galaxy sample and examined the luminosity distribution and galaxy environment of DLA galaxies using the homogeneous sample. The results are summarized as follows:
1. We find based on a uniform gaseous disk model that the neutral gas cross section of individual galaxies scales with -band luminosity as with and kpc at . The result suggests that the neutral gaseous extent of intermediate-redshift galaxies is marginally larger than what is observed in local galaxies.
2. The observed incidence of the DLA galaxies as a function of galaxy -band absolute magnitude indicates that luminous galaxies () dominate the neutral gas cross section in the universe. In addition, the observations agree well with predictions from adopting a known galaxy luminosity function and the best-fit scaling relation of the total gas cross section at . The necessary cut-off at suggests that dwarf galaxies possess H I gas cross section that is scaled down from luminous galaxies
3. Comparison of the observed number density of DLAs and predictions derived from our model indicates that luminous galaxies () can already explain most of the DLAs found in QSO absorption line surveys and a large contribution of dwarfs to the total neutral gas cross section is not necessary
4. Morphological types of DLA galaxies are directly observed to range from bulge-dominated (compact) galaxies through normal disk galaxies through low surface brightness galaxies, indicating that the DLA galaxy sample is roughly representative of the galaxy population over a large fraction of the Hubble time.
5. The DLAs probe a variety of galaxy environment. In particular, two of the highest column density systems ( ) at that show distinct absorption components in 21-cm observations are found to arise in groups of galaxies.
6. Galaxies selected based on do not appear to have a substantial luminosity evolution between and .
In summary, we conclude that the underlying galaxy population traced by the DLAs at may be well characterized by a gas cross-section weighted galaxy luminosity function at . Dwarf galaxies () do not dominate the total H I gas cross section, although they may have some contribution.
References
- (1)
- (2) Bechtold, J., Siemiginowska, A., Aldcroft, T.L., Elvis, M., Dobrzycki, A. 2001, ApJ, 562, 133
- (3)
- (4) Beckett, M.G., Mackay, C.D., McMahon, R.G., Parry, I.R., Ellis, R.S., Chan, S.J., & Hoenig, M. 1998, in Infrared Astronomical Instrumentation, ed. Fowler, A.M., Proc. SPIE, 3354, p. 14
- (5)
- (6) Bergeron, J. & Boissé, P. 1991, A&A, 243, 344
- (7)
- (8) Bertin, E. & Arnouts, S. 1996, A&AS, 117, 393
- (9)
- (10) Boissé, P., Le Brun, V., Bergeron, J., & Deharveng, J.-M. 1998, A&A, 333, 841
- (11)
- (12) Bowen, D.V., Tripp, T.M., & Jenkins, E.B. 2001, AJ, 121, 1456
- (13)
- (14) Broeils, A.H., & van Woerden, H. 1994, A&AS, 107, 129
- (15)
- (16) Burbidge, E.M., Caldwell, R.D., Smith, H.E., Liebert, T., & Spinrad, H. 1976, ApJ, 205, L117
- (17)
- (18) Burbidge, E.M., Beaver, E.A., Cohen, R.D., Junkkarinen, V.R., & Lyons, R.W. 1996, AJ, 112, 2533
- (19)
- (20) Calzetti, D., Armus, L., Bohlin, R. C., Kinney, A. L., Koornneef, J., & Storchi-Bergmann, T. 2000, ApJ, 533, 682
- (21)
- (22) Cayatte, V., Kotanyi, C., Balkowski, C., & van Gorkom, J.H. 1994, AJ, 107, 1003
- (23)
- (24) Chen, H.-W., McCarthy, P.J., & Marzke, R.O. et al. 2002, ApJ, 570, 54
- (25)
- (26) Chen, H.-W., Marzke, R.O., & McCarthy, P.J., Martini, P., Carlberg, R.G., Persson, S.E., Bunker, A., Bridge, C.R., & Abraham, R.G. 2003, ApJ, 586, 745
- (27)
- (28) Cohen, J.G. 2001, AJ, 121, 1275
- (29)
- (30) Cohen, R.D., Smith, H.E., Junkkarinen, V.T., & Burbidge, E.M. 1987, ApJ, 318, 577
- (31)
- (32) Cohen, R.D., Burbidge, E.M., Junkkarinen, V.T., Lyons, R.W., & Madejski, G. 1999, AAS, 194, 71.01
- (33)
- (34) Colbert, J. W. & Malkan, M. A. 2002, ApJ, 566, 51
- (35)
- (36) Connolly, A.J., Csabai, I., Szalay, A.S., Koo, D.C., Kron, R.G., & Munn, J.A. 1995, AJ, 110, 2655
- (37)
- (38) Connolly, A.J., Szalay, A.S., Dickinson, M., Subbarao, M.U., & Brunner, R.J. 1997, ApJ, 486, L11
- (39)
- (40) de la Varga, A., Reimers, D., Tytler, D., Barlow, T., & Burles, S. 2000, A&A, 363, 69
- (41)
- (42) de Vaucouleurs, G., de Vaucouleurs, A., & Corwin, J.R. 1976, Second Reference Catalogue of Bright Galaxies (University of Texas, Austin
- (43)
- (44) Deharveng, J.-M., Buat, V., & Bergeron, J. 1995, A&A, 298, 57
- (45)
- (46) Ellis, R.S., Colless, M., Broadhurst, T., Heyl, J., & Glazebrook, K. 1996, MNRAS, 280, 235
- (47)
- (48) Ellison, S.L., Yan, L., Hook, I.M., Pettini, M., Wall, J.V., & Shaver, P. 2001, A&A, 379, 393
- (49)
- (50) Fernández-Soto, A., Lanzetta, K.M., & Yahil, A. 1999, ApJ, 513, 34
- (51)
- (52) Fernández-Soto, A., Lanzetta, K.M., Chen, H.-W., Pascarelle, S.M., & Yahara, N. 2001, ApJS, 135, 41
- (53)
- (54) Freedman, W.L. et al. 2001, ApJ, 553, 47
- (55)
- (56) Guillemin, P. & Bergeron, J. 1997, A&A, 328, 499
- (57)
- (58) Henry, R.B.C. & Worthey, G. 1999, PASP, 111, 919
- (59)
- (60) Holmberg, E. 1975, in Galaxies and the Universe, ed. A. Sandage, M. Sandage, & J. Kristian (Chicago: Univ. Chicago Press), 123
- (61)
- (62) Jannuzi, B.T. et al. 1998, ApJS, 118, 1
- (63)
- (64) Kanekar, N. & Chengalur, J.N. 2001, MNRAS, 325, 631
- (65)
- (66) Kennicutt, R.C., Bresolin, F., & Garnett, D.R. 2003, ApJ in press
- (67)
- (68) Krist, J.E., & Hook, R. N. 1997, The Tiny Tim User’s Guide, Version 4.4 (Baltimore: STScI)
- (69)
- (70) Kulkarni, V.P. & Fall, S.M. 2002, ApJ, 580, 732
- (71)
- (72) Landolt, A.U. 1992, AJ, 104, 340
- (73)
- (74) Lane, W., Smette, A., Briggs, F., Rao, S., Turnshek, D., & Meylan, G. 1998, AJ, 116, 26
- (75)
- (76) Lane, W. 2000, PhD. Thesis, Univ. of Groningen
- (77)
- (78) Lanzetta, K.M., Wolfe, A.M., & Turnshek, D.A. 1995, ApJ, 440,435
- (79)
- (80) Lanzetta, K.M., Yahil, A., & Fernández-Soto, A. 1996, Nature, 381, 759
- (81)
- (82) Le Brun, F., Bergeron, J., Boissé, P., & Deharveng, J.M. 1997, A&A, 321, 733
- (83)
- (84) Lilly, S.J., Le Fèvre, O., Hammer, F., & Crampton, D. 1996, ApJ, 461, 534
- (85)
- (86) Lin, H., Yee, H.K.C., Carlberg, R.G. et al. 1999, ApJ, 518, 533
- (87)
- (88) Miller, E.D., Knezek, P.M., & Bregman, J.N. 1999, ApJ, 510, L95
- (89)
- (90) Møller, P., Warren, S.J., Fall, S.M., Fynbo, J.U., & Jakobsen, P. 2002, ApJ, 574, 51
- (91)
- (92) Nilson, P. 1973, Uppsala General Catalogue of Galaxies, (Stockholm: Almqvist & Wiksell (dist.))
- (93)
- (94) Persson, S.E., Murphy, D.C., Krzeminski, W., Roth, M., & Rieke, M.J. 1998, AJ, 116, 2475
- (95)
- (96) Persson, S.E., Murphy, C.D., Gunnels, S., Birk, C., Bagish, A., & Koch, E. 2002, AJ, 124, 619
- (97)
- (98) Péroux, C., Dessauges-Zavadsky, M., Kim, T., McMahon, R.G., & D’Odorico, S. 2002, Ap&SS, 281, 543
- (99)
- (100) Petitjean, P. & Bergeron, J. 1990, A&A, 231, 309
- (101)
- (102) Petitjean, P., Theodore, B., Smette, A., & Lespine, Y. 1996, A&A, 313, 25
- (103)
- (104) Pettini, M., & Bowen, D.V. 1997, A&A, 327, 22
- (105)
- (106) Pettini, M., Ellison, S.L., Steidel, C.C., & Bowen, D.V. 1999, ApJ, 510, 576
- (107)
- (108) Pettini, M., Ellison, S.L., Steidel, C.C., Shapley, A.E., & Bowen, D.V. 2000, ApJ, 532, 65
- (109)
- (110) Prochaska, J.X. & Wolfe, A.M. 2002, ApJ, 566, 68
- (111)
- (112) Rosenberg, J.L. & Schneider, S.E. 2003, ApJ, 585, 256
- (113)
- (114) Rao & Turnshek 1998, ApJ, 500, L115
- (115)
- (116) Rao & Turnshek 2000, ApJS, 130, 1
- (117)
- (118) Rao, S.M., Nestor, D.B., Turnshek, D.A., Lane, W., Monier, E.M., & Bergeron, J. 2003, ApJ, in press (astro-ph/0211297)
- (119)
- (120) Reimers, D., Rodriguez-Pascual, P., Hagen, H.-J., & Wisotzki, L. 1995, A&A, 293, L21
- (121)
- (122) Roberts, M.S., Brown, R.L., Brundage, W.D., Rots, A.H., Haynes, M.P., & Wolfe, A.M. 1976, ApJ, 81, 293
- (123)
- (124) Ryan-Weber, E.V., Webster, R.L., & Staveley-Smith, L. 2003, MNRAS, in press
- (125)
- (126) Schechter, P. 1976, ApJ, 203, 297
- (127)
- (128) Schlegel, D.J., Finkbeiner, D.P., & Davis, M. 1998, ApJ, 500, 525
- (129)
- (130) Smith, P.S., Balonek, T.J., Elston, R., & Heckert, P.A. 1987, ApJS, 64, 459
- (131)
- (132) Steidel, C.C., Pettini, M., Dickinson, M., & Persson, S.E. 1994, AJ, 108, 2046
- (133)
- (134) Steidel, C.C., Dickinson, M., Meyer, D.M., Adelberger, K.L., & Sembach, K.R., 1997, ApJ, 480, 568
- (135)
- (136) Steidel, C.C., Kollmeier, J.A., Shapley, A.E., Churchill, C.W., Dickinson, M., & Pettini, M. 2002, ApJ, 570, 526
- (137)
- (138) Stickel, M., Fried, J.W. & Kühr, H. 1988, A&A, 198, L13
- (139)
- (140) Storrie-Lombardi, L.J. & Wolfe, A.M. 2000, ApJ, 543, 552
- (141)
- (142) Turnshek, D.A., Rao, S., Nestor, D., Lane, W., Monier, E., Bergeron, J., & Smette, A. 2001, ApJ, 553, 288
- (143)
- (144) Uson, J.M. & Matthews, L.D. 2003, AJ, in press
- (145)
- (146) Warren, S.J., Møller, P., Fall, S.M., & Jakobsen, P. 2001, MNRAS, 326, 759
- (147)
- (148) Wilkes, B.J., Elvis, M., Fiore, F., McDowell, J.C., Tananbaum, H., & Lawrence, A. 1992, ApJ, 393, L1
- (149)
- (150) Windhorst, R.A. et al. 2002, ApJS, 143, 113
- (151)
- (152) Wolfe, A.M., Briggs, F.H., & Davis, M.M. 1982, ApJ, 259, 495
- (153)
- (154) Wolfe, A.M., Lanzetta, K.M., Foltz, C.B., & Chaffee, F.H. 1995, ApJ, 454, 698
- (155)
- (156) Wolfe, A.M. 1995, in ESO Workshop on QSO Absorption Lines, ed. G. Meylan (Berlin: Springer), 13
- (157)
- (158) Yahata, N., Lanzetta, K.M., Chen, H.-W., Fernández-Soto, A., Pascarelle, S.M., Puetter, R.C., & Yahil, A. 2000, ApJ, 538, 493
- (159)
- (160) Yanny, B., York, D.G. & Gallagher, J.S. 1989, ApJ., 338, 735.
- (161)
- (162) Zehavi, I. et al. 2002, ApJ, 571, 172
- (163)
- (164) Zheng, W., Kriss, G.A., Telfer, R.C., Grimes, J.P., & Davidsen, A.F. 1997, ApJ, 475, 469
- (165)
| Table 1 | |||||||
| Summary of the Optical and Near-infrared Imaging Data | |||||||
| Plate Scale | Exposure | FWHM | |||||
| Field | Instrument | (arcsecpixel) | Filter | Time (s) | (arcsec) | a | |
| (1) | (2) | (3) | (4) | (5) | (6) | (7) | (8) |
| AO0235164 () | Tek#5/CCD | 0.259 | 2700 | 1.22 | 25.2 | 22.9 | |
| Tek#5/CCD | 0.259 | 1200 | 1.15 | 25.5 | 22.6 | ||
| Tek#5/CCD | 0.259 | 2400 | 0.97 | 25.5 | 22.0 | ||
| Tek#5/CCD | 0.259 | 2100 | 0.85 | 25.7 | 21.2 | ||
| Tek#5/CCD | 0.259 | 2100 | 0.78 | 24.7 | 20.7 | ||
| HST/WFPC2 | 0.100 | F450W | 1200 | 0.20 | 24.7 | 22.5 | |
| HST/WFPC2 | 0.100 | F702W | 600 | 0.20 | 24.4 | 21.0 | |
| EX03022223 () | HST/WFPC2 | 0.046 | F450W | 2000 | 0.09 | 24.4 | 24.1 |
| HST/WFPC2 | 0.046 | F702W | 3600 | 0.09 | 25.5 | 23.2 | |
| Tek#5/CCD | 0.259 | 8100 | 0.78 | 25.4 | 22.4 | ||
| CIRSI | 0.196 | 5700 | 0.52 | 23.8 | 21.7 | ||
| CIRSI | 0.196 | 1620 | 0.56 | 23.3 | 21.5 | ||
| PKS0439433 () | Tek#5/CCD | 0.259 | 1800 | 0.85 | 25.3 | 18.8 | |
| Tek#5/CCD | 0.259 | 1200 | 0.91 | 25.7 | 18.1 | ||
| Tek#5/CCD | 0.259 | 900 | 0.78 | 25.2 | 17.5 | ||
| Tek#5/CCD | 0.259 | 900 | 0.65 | 24.3 | 17.0 | ||
| WIRC | 0.199 | 2460 | 0.60 | 23.7 | 16.8 | ||
| WIRC | 0.199 | 3240 | 0.46 | 22.5 | 16.9 | ||
| HE11221649 () | Tek#5/CCD | 0.259 | 4200 | 0.89 | 26.0 | 23.4 | |
| Tek#5/CCD | 0.259 | 2100 | 0.79 | 25.9 | 22.8 | ||
| Tek#5/CCD | 0.259 | 9600 | 0.70 | 25.7 | 21.4 | ||
| CIRSI | 0.196 | 5700 | 0.57 | 24.2 | 20.9 | ||
| CIRSI | 0.196 | 5580 | 0.70 | 23.8 | 20.6 | ||
| PKS1127145 () | Tek#5/CCD | 0.259 | 3480 | 0.98 | 26.0 | 21.6 | |
| Tek#5/CCD | 0.259 | 3240 | 0.83 | 26.5 | 21.2 | ||
| Tek#5/CCD | 0.259 | 3600 | 0.67 | 26.4 | 20.3 | ||
| Tek#5/CCD | 0.259 | 6000 | 0.60 | 25.0 | 19.6 | ||
| CIRSI | 0.196 | 4200 | 0.56 | 23.7 | 19.2 | ||
| CIRSI | 0.196 | 3300 | 0.56 | 23.9 | 19.2 | ||
| aFor a typical Scd galaxy of , assuming no luminosity evolution with redshfit. | |||||||
| Table 2 | ||||||||||
| Galaxies identified within angular radius from AO0235164 (; ) | ||||||||||
| ID | (′′) | (′′) | (′′) | |||||||
| (1) | (2) | (3) | (4) | (5) | (6) | (7) | (8) | (9) | (10) | (11) |
| 1 | 1.1 | 0.0 | 1.1 | … | 0.524a | … | … | … | e | … |
| 2 | 0.2 | 2.1 | 2.1 | 0.52 | 0.524a,b,c | 21.060.03 | 20.840.01 | 20.610.01 | 20.420.01 | 20.220.02 |
| 3 | 5.9 | 2.6 | 6.5 | 0.32 | 0.525a,d | 24.420.54 | 24.160.30 | 22.480.06 | 21.540.03 | 20.850.03 |
| 4 | 6.9 | 7.0 | 9.8 | 0.68 | … | 23.970.38 | 24.700.53 | 23.400.15 | 22.540.06 | 21.210.04 |
| aYanny et al. 1989; b Cohen et al. 1987; cGuillemin & Bergeron 1997; dStickel et al. 1988; | ||||||||||
| eMagnitude limit was estimated based on a WFPC2/F702W image. | ||||||||||
| Table 3 | ||||||||||
| Galaxies identified within angular radius from EX03022223 (; ) | ||||||||||
| ID | (′′) | (′′) | (′′) | F450W | F702W | |||||
| (1) | (2) | (3) | (4) | (5) | (6) | (7) | (8) | (9) | (10) | (11) |
| 1 | 1.1 | 0.3 | 1.1 | … | … | 23.680.17 | 23.880.08 | … | … | … |
| 2 | 2.4 | 1.2 | 2.7 | … | … | 24.400.37 | 23.780.07 | … | … | … |
| 3 | 0.2 | 3.4 | 3.4 | 0.96 | … | 24.660.42 | 24.040.09 | 23.130.04 | 23.690.30 | 24.500.87 |
| 4 | 1.0 | 3.6 | 3.7 | … | … | 24.880.57 | 23.960.09 | 23.810.09 | 23.130.20 | 22.900.24 |
| 34 | 0.6 | 3.5 | 3.6 | 0.96 | … | 24.010.34 | 23.250.06 | 22.670.04 | 22.620.17 | 22.680.25 |
| 5 | 2.7 | 7.1 | 7.6 | 1.05 | 1.000a | 24.740.54 | 22.990.04 | 21.670.01 | 20.710.02 | 20.790.04 |
| 6 | 8.3 | 11.8 | 14.4 | 0.70 | 0.663a | 23.880.38 | 21.590.02 | 21.100.01 | 20.570.03 | 20.460.04 |
| 7 | 14.8 | 0.7 | 14.8 | 0.04 | 0.118b | 19.620.02 | 18.730.01 | 18.430.01 | 18.060.01 | 17.880.01 |
| aGuillemin & Bergeron 1997; bLe Brun et al. 1997. | ||||||||||
| Table 4 | |||||||||||
| Galaxies identified within angular radius from PKS0439433 (; ) | |||||||||||
| ID | (′′) | (′′) | (′′) | ||||||||
| (1) | (2) | (3) | (4) | (5) | (6) | (7) | (8) | (9) | (10) | (11) | (12) |
| 1 | 0.5 | 3.9 | 3.9 | 0.09 | 0.101a,b | 19.310.01 | 18.37 0.01 | 17.720.01 | 17.120.01 | 16.550.01 | 16.660.01 |
| 2 | 4.2 | 10.1 | 10.9 | 0.00 | … | 21.740.04 | 19.670.01 | 18.760.01 | 17.880.01 | 17.470.01 | 17.850.02 |
| 3 | 5.6 | 12.0 | 13.3 | 0.83 | … | 25.330.47 | 25.780.38 | 25.020.32 | 22.210.08 | 21.760.09 | 20.360.07 |
| aPetitjean et al. (1996); bChen, Kennicutt, & Rauch (2003, in preparation). | |||||||||||
| Table 5 | ||||||||||
| Galaxies identified within angular radius from HE1122168 (; ) | ||||||||||
| ID | (′′) | (′′) | (′′) | |||||||
| (1) | (2) | (3) | (4) | (5) | (6) | (7) | (8) | (9) | (10) | (11) |
| 1 | 0.8 | 3.5 | 3.6 | 0.69 | … | 23.190.08 | 23.010.06 | 22.330.03 | 22.100.10 | 21.720.09 |
| 2 | 2.8 | 6.5 | 7.1 | 1.24 | … | 24.410.20 | 24.280.15 | 23.560.08 | 22.870.21 | |
| 3 | 0.2 | 7.4 | 7.4 | 1.05 | … | 25.350.48 | 25.200.35 | 23.360.07 | 22.360.11 | 22.390.15 |
| 4 | 3.7 | 6.6 | 7.5 | 0.72 | … | 26.220.68 | 25.720.38 | 24.330.11 | 26.061.86 | 23.490.25 |
| 5 | 1.2 | 8.5 | 8.6 | 0.00 | … | 24.420.20 | 23.870.10 | 23.070.05 | 23.160.21 | 23.720.51 |
| 6 | 3.1 | 10.0 | 10.4 | 0.63 | … | 24.820.27 | 24.350.15 | 23.340.06 | 23.470.27 | 22.630.18 |
| 7 | 10.7 | 1.9 | 10.9 | 0.26 | … | 28.115.36 | 24.980.23 | 23.120.05 | 22.510.11 | 22.720.17 |
| 8 | 6.1 | 9.6 | 11.4 | 0.43 | … | 23.250.09 | 21.100.01 | 20.470.03 | 19.970.02 | |
| 9 | 10.6 | 3.2 | 11.0 | 0.35 | … | 23.870.12 | 21.970.02 | 21.280.04 | 21.010.05 | |
| 10 | 3.0 | 12.1 | 12.4 | 1.22 | … | 25.140.33 | 25.050.25 | 23.060.04 | 21.760.05 | 21.470.05 |
| Table 6 | |||||||||||
| Galaxies identified within angular radius from PKS1127145 (; ) | |||||||||||
| ID | (′′) | (′′) | (′′) | ||||||||
| (1) | (2) | (3) | (4) | (5) | (6) | (7) | (8) | (9) | (10) | (11) | (12) |
| 1 | 1.9 | 3.3 | 3.8 | 0.27 | … | 24.000.15 | 23.900.07 | 23.160.04 | 22.360.05 | 22.220.15 | 22.270.13 |
| 2 | 3.8 | 0.4 | 3.8 | 0.33 | 0.312a | 23.320.07 | 23.320.03 | 22.680.02 | 22.140.04 | 21.970.10 | 22.600.15 |
| 3 | 5.4 | 1.4 | 5.6 | 0.12 | … | 23.060.07 | 22.940.03 | 22.260.02 | 21.700.04 | 21.950.14 | 21.700.09 |
| 4 | 3.0 | 7.1 | 7.7 | 0.75 | … | 25.310.32 | 24.570.09 | 24.560.10 | 23.360.08 | 23.760.40 | 22.990.17 |
| 5 | 8.0 | 1.9 | 8.2 | 0.53 | … | 23.610.10 | 23.480.04 | 23.020.03 | 22.290.05 | 21.580.08 | 21.310.05 |
| 6 | 9.0 | 3.9 | 9.8 | 0.26 | 0.313b | 21.470.04 | 21.030.01 | 19.900.01 | 19.090.01 | 18.590.01 | 18.300.01 |
| 7 | 2.7 | 11.9 | 12.2 | 0.00 | … | 25.300.36 | 23.460.04 | 22.570.02 | 21.670.02 | 21.410.07 | 21.480.06 |
| 8 | 3.1 | 14.6 | 15.0 | 0.95 | … | 25.370.29 | 25.260.12 | 24.940.11 | 23.890.10 | 24.540.70 | 24.660.65 |
| aLane et al. (1998); bBergeron & Boissé (1991). | |||||||||||
| Table 7 | ||||||||
| Properties of known DLA galaxies at | ||||||||
| QSO | (cm-2) | (arcsec) | ( kpc) | a | Morphology | |||
| (1) | (2) | (3) | (4) | (5) | (6) | (7) | (8) | (9) |
| TON 1480 | 0.614 | 0.0036 | 20.34 | 114.0 | 5.94 | S0b | ||
| HS15435921 | 0.807 | 0.009 | 20.35 | 2.4 | 0.31 | LSBc | ||
| LBQS00580155 | 1.954 | 0.613 | 20.08 | 1.2 | 5.67 | disk | ||
| AO0235164 | 0.940 | 0.524 | 21.70 | 2.1 | 9.37 | compact | ||
| 6.4 | 28.03 | compact | ||||||
| EX03022223 | 1.400 | 1.0095 | 20.36 | 3.3 | 18.65 | Irr | ||
| PKS0439433 | 0.593 | 0.101 | 20.00 | 3.9 | 5.13 | disk | ||
| Q0738313 | 0.635 | 0.2212 | 20.90 | 5.7 | 14.23 | compact | ||
| B2 0827243 | 0.939 | 0.525 | 20.30 | 5.8 | 25.42 | disk | ||
| HE11221649 | 2.400 | 0.681 | 20.45 | 3.6 | 17.66 | compact | ||
| PKS1127145 | 1.187 | 0.313 | 21.71 | 3.8 | 12.13 | Irr | ||
| 3.8 | 12.13 | 22.1 | compact | |||||
| 9.8 | 31.59 | 19.1 | disk | |||||
| 17.5 | 56.18 | 18.9 | disk | |||||
| PKS1629120 | 1.795 | 0.531 | 20.70 | 3.0 | 13.24 | disk | ||
| Q0738313 | 0.635 | 0.0912 | 21.18 | … | … | |||
| PKS162223 | 0.927 | 0.6563 | 20.36 | … | … | |||
| a; bNilson (1973); cBowen et al. (2001). | ||||||||