2 Department of Physics, Center for Theoretical Physics and Center for Space Research, Massachusetts Institute of Technology,
Cambridge, MA 02139, U.S.A.
3 Copernicus Astronomical Center, Polish Academy of Sciences, Bartycka 18, 00-716 Warsaw, Poland
Theoretical UBVRI colors of iron core white dwarfs
We explore photometric properties of hypothetical iron core white dwarfs and compute their expected colors in Johnson broadband system. Atmospheres of iron core WDs in this paper consist of pure iron covered by a pure hydrogen layer of an arbitrary column mass. LTE model atmospheres and theoretical spectra are calculated on the basis of Los Alamos TOPS opacities and the equation of state from the OPAL project, suitable for nonideal Fe and H gases. We have also computed colors of the models and determined an area on the vs. and vs. planes, occupied by both pure Fe, and pure H model atmospheres of WD stars. Finally, we search for iron core white dwarf candidates in the available literature.
Key Words.:
Stars: atmospheres – Stars: white dwarfs – Stars: fundamental parameters1 Introduction
Chemical composition of white dwarf stars cores has not yet been convincingly determined. While most white dwarfs are believed to have pure carbon or mixed carbon-oxygen interiors, there are suggestions that cores of some WDs are built of heavier elements, and pure iron cores represent the extreme case.
An idea that some white dwarfs have cores built of heavier elements was put forward by Provencal et al. (1998) and Provencal & Shipman (1999). In particular, they noted that the nearby white dwarf Procyon B has relatively normal white dwarf mass of 0.594 , but has a very small radius (cf. also Girard et al. 2000). This would imply that Procyon B has a very heavy core, perhaps of iron. They found that radii of other WD stars: EG 50 and GD 140 are also located significantly below the mass-radius relation predicted for typical carbon interior compositions. Only recently, Provencal et al. (2002) on the basis of precise Hubble spectral measurements recognized that Procyon B is a normal white dwarf, belonging to the DQZ spectral class.
Panei et al. (2000) have obtained thorough theoretical mass-radius relations for iron-dominated cores. They show that EG 50, GD 140 and 40 Eri B satisfy these relations for iron cores, contrary to mass-radius relations for carbon and oxygen cores. Their result convinced us that the existence of the iron core white dwarfs is possible. The above hypothesis is a sufficient reason for us to perform and publish this research paper.
Atmospheres of these stars are probably built from pure iron gas covered by hydrogen (and/or helium) layer, since stratified atmospheres are common among the known white dwarfs. We expect that most likely iron and hydrogen are not perfect gases, at least in cooler WDs.
In the following sections we describe model atmosphere calculations in the local thermodynamical equilibrium (LTE), which are based on a frequently used equation of state computed by the OPAL Project for nonideal hydrogen (Rogers, Swenson, & Iglesias 1996) and iron gas (Rogers 2002). Our calculations use exclusively the Los Alamos TOPS monochromatic absorption and scattering opacities, consistent with the nonideal EOS for both gases (Magee et al. 1995). Model atmosphere and spectrum calculations are restricted to atmospheres in radiative equilibrium, corresponding to effective temperatures K.
Los Alamos opacity tables were originally designed to study physics and pulsational instabilities in stellar envelopes by means of Rosseland mean opacities. Therefore the tables do not have spectral resolution adequate to study details of stellar atmospheric spectra. This is the reason that our paper presents and discusses mostly spectral indices , , , and of the broadband Johnson photometric system. We attempt to find a prescription for differentiating most common DA white dwarfs with pure hydrogen atmospheres from iron core white dwarfs with pure iron or stratified hydrogen–iron atmospheres.
2 Numerical methods
2.1 Model atmosphere computations
Model atmosphere equations are based on the following equation of radiative transfer, suitable for planar geometry
| (1) |
where variables , , and have their usual meaning. The three monochromatic variables are expressed in units erg cm-2 sec-1 Hz-1 str-1. Dimensionless absorption is , where and denote LTE true absorption and coherent scattering coefficients, respectively. Absorption coefficient has been corrected in our code for stimulated emission as in LTE.
Computer code used here has been derived from the code atm21 adapted to coherent scattering in stellar atmosphere (exact description in Madej 1991, 1994, 1998; Madej & Różańska 2000; Stage, Joss, & Madej 2002).
The foregoing papers explain in detail the equations of hydrostatic and radiative equilibrium, which are imposed on the model atmospheres, as well as two boundary conditions associated with the equation of transfer. The equation of transfer and the radiation field was solved with the method of variable Eddington factors (Mihalas 1978).
Model atmosphere equations were expressed in discrete form on frequency grid , and standard optical depth grid , . Here, in our models, the monochromatic optical depth at the fixed wavelength of 1500 Å is used. For each model we set and started computations from a very small standard optical depth point . We have assumed a value for equal to for pure hydrogen models, while for pure iron and stratified H-Fe models was set. Both the monochromatic absorption and scattering coefficiens, and hence the , were determined at each frequency and depth points by direct interpolation of extensive TOPS opacity tables. The equation of state for nonideal gas, i.e. the values of gas density for a given temperature and gas pressure, were similarly determined by interpolation of the OPAL EOS tables either for H or pure Fe gas.
2.2 Equation of state and opacity data
The nonideal equation of state for partially ionized plasma, which was used in our research, has been extensively described by Rogers (1994), Rogers, Swenson & Iglesias (1996), cf. also references therein. These authors refer to their derivation as to the activity expansion of the grand canonical partition function of plasma, the latter being basic function in statistical thermodynamics. The method includes quantum mechanical two-body and many-body interactions, and electron degeneracy along with other effects. We feel not enough competent to present and discuss details of their method in the present paper. However, we mention after Rogers et al. (1996) that their derivation of the EOS for various plasmas basically differs from common methods which are based on minimization of free energy in plasma.
This research uses EOS data which is available for a general user. EOS tables for pure hydrogen plasma were taken from the Lawrence Livermore National Laboratory www site (http://www-phys.llnl.gov /Research/OPAL/index.html). With EOS tables for pure iron gas we were kindly provided by Dr. F.J. Rogers (2002).
Extensive TOPS monochromatic opacity tables have been prepared at the Los Alamos National Laboratory (Magee et al. 1995). We have collected hydrogen and iron data from their web page at http://www.t4.lanl.gov/opacity/tops.html. See that www site for more details on the TOPS opacity calculations.
2.3 Synthetic colors of the Johnson UBVRI system
Having calculated the models, we acquired their broadband Johnson colors using a color synthesis procedure described by Bergeron et al. (1995); see also detailed review of photometric systems by Girardi et al. (2002).
At first, stellar magnitudes of a theoretical spectrum are computed according to the standard formula
| (2) |
where we integrate the product of the flux energy spectrum of a model atmosphere with the transmission function of the respective broadband filter. The constant can assume an arbitrary value.
We used the Johnson transmission functions defined by Bessell (1990), and restricted our research to analysis of colors, i.e. differences of the respective magnitudes. Then the definition of the respective colors, e.g. color, is as follows:
| (3) |
cf. Bergeron et al. (1995). Constant includes all quantities which are not related to flux .
Note that plane-parallel model atmosphere codes compute theoretical spectra of radiation which are emitted by unit surface on the star, this is 1 cm2 in case of the atm21 code. Therefore theoretical flux in Eq. 3 is never directly comparable with e.g. the flux measured on Earth or absolute flux in that filter, which would be measured at 10 pc distance.
Eq. 3 can be applied to Vega, which is the fundamental spectrophotometric standard. In our research each color of Vega is equal to zero by assumption. Setting to the flux of Vega allowed us to determine constants , , and for all theoretical colors presented in the following Sections.
For the above calibration purposes we adapted absolute fluxes of Vega observed by Hayes (1985), for Å. His paper gives values of the Vega flux in equidistant intervals of 25 Å and therefore gives poor description of the flux in the near ultraviolet, where prominent higher Balmer lines merge and the wavelength depence of Vega flux is very complex. Therefore for Å we have taken theoretical fluxes from Castelli & Kurucz (1994). They have computed atlas12 model atmosphere and spectrum of Vega with a high spectral resolution, normalised in the same way as Hayes’ (1985) observations.
We have taken this approach to reference spectra of Vega from Bergeron et al. (1995), in order to make our color indices for hydrogen and iron atmospheres fully compatible with their tables of Johnson photometry colors computed for DA and DB white dwarfs.
3 UBVRI colors of pure H atmospheres
In this section we construct and discuss two different series of pure hydrogen model atmospheres of white dwarfs. This is done in order to compare and measure the discrepancies between each other and assess the uncertainty of colors of atmospheres computed with the following two basically different numerical methods. By doing this, we also test the compatibility of both OPAL and TOPS data with the existing model atmosphere codes. If effect, we draw a conclusion that our pure Fe model atmospheres, based on those data, are consistent with pure H atmospheres.
For calculating models of hot WD atmospheres consisting of pure hydrogen, the following approaches were undertaken: (1) We assumed that plasma of hot hydrogen atmosphere is described by the EOS of ideal gas. Under this assumption, thorough models were calculated in the NLTE regime. Models and spectra computations were performed using tlusty195 and synspec42 codes (Hubeny 1988; Hubeny & Lanz 1992, 1995). Three spectral series of hydrogen (Lyman, Balmer, and Paschen) were considered as we computed outgoing flux spectra and color indices. Since Paschen lines are not present in the standard versions of both codes, we have adopted to the codes the opacities of thermally & pressure-broadened Paschen lines from Lemke (1997). (2) Alternatively, we assumed more factual, nonideal EOS for gas and derived a number of models in LTE. Tables for nonideal EOS were taken from the OPAL project, while the Los Alamos TOPS monochromatic opacity tables were used.
| 1 | 20 | 7 | -0.895 | -0.057 | -0.098 | -0.206 |
| 1 | 20 | 8 | -0.965 | -0.012 | -0.103 | -0.202 |
| 1 | 20 | 9 | -1.017 | 0.014 | -0.109 | -0.199 |
| 1 | 20 | 10 | -1.076 | 0.026 | -0.112 | -0.180 |
| 1 | 30 | 7 | -1.121 | -0.193 | -0.135 | -0.290 |
| 1 | 30 | 8 | -1.157 | -0.171 | -0.139 | -0.288 |
| 1 | 30 | 9 | -1.186 | -0.163 | -0.142 | -0.288 |
| 1 | 30 | 10 | -1.211 | -0.168 | -0.145 | -0.275 |
| 1 | 50 | 7 | -1.238 | -0.284 | -0.146 | -0.325 |
| 1 | 50 | 8 | -1.244 | -0.277 | -0.147 | -0.325 |
| 1 | 50 | 9 | -1.251 | -0.275 | -0.148 | -0.323 |
| 1 | 50 | 10 | -1.256 | -0.275 | -0.149 | -0.320 |
| 1 | 70 | 7 | -1.257 | -0.313 | -0.145 | -0.338 |
| 1 | 70 | 8 | -1.262 | -0.308 | -0.150 | -0.339 |
| 1 | 70 | 9 | -1.268 | -0.304 | -0.150 | -0.336 |
| 1 | 70 | 10 | -1.271 | -0.304 | -0.152 | -0.336 |
| 1 | 100 | 7 | -1.279 | -0.329 | -0.142 | -0.348 |
| 1 | 100 | 8 | -1.280 | -0.327 | -0.145 | -0.350 |
| 1 | 100 | 9 | -1.282 | -0.324 | -0.146 | -0.349 |
| 1 | 100 | 10 | -1.282 | -0.324 | -0.150 | -0.349 |
| 1 | 20 | 7 | -0.812 | -0.091 | -0.209 |
| 1 | 20 | 8 | -0.866 | -0.035 | -0.210 |
| 1 | 20 | 9 | -0.927 | 0.029 | -0.203 |
| 1 | 50 | 7 | -1.217 | -0.291 | -0.330 |
| 1 | 50 | 8 | -1.224 | -0.278 | -0.331 |
| 1 | 50 | 9 | -1.229 | -0.258 | -0.327 |
| 1 | 100 | 7 | -1.270 | -0.328 | -0.350 |
| 1 | 100 | 8 | -1.271 | -0.322 | -0.352 |
| 1 | 100 | 9 | -1.269 | -0.309 | -0.348 |
In the present work we are concerned about isolated hot WD atmospheres with effective temperatures in the range of 20000 to 100000 K and surface gravities ranging from to (cgs units). White dwarfs of as high surface gravity as are not yet known, however, one can expect that iron core white dwarfs of a given mass have a particularly small radius and therefore high surface gravity. Consequently, we appended high gravity hydrogen model atmospheres to obtain grid consistent with pure iron high gravity atmospheres. The radiative and hydrostatic equilibria are implied in all models.
Grids of color indices for both NLTE (tlusty195) and LTE (Los Alamos) series of models were plotted on two-index plane, vs. , and are displayed on Figure 1. Colors of the TOPS-based LTE models are in a reasonable agreement with the corresponding colors of the NLTE models, especially for highest effective temperatures . The largest difference in the index is equal to almost 0.1 mag (for K and ); in the it is mere 0.034 mag (for K and ). The differences in color are smaller still.
We conclude that the models, based on TOPS and OPAL tables, are in satisfactory agreement with the NLTE tlusty195 models, as long as pure hydrogen models are concerned. Therefore we believe that pure iron or stratified hydrogen-iron models with nonideal EOS would be consistent with NLTE ideal gas models at the high limit.
It is interesting to note that colors of pure H model atmospheres computed either with the EOS of ideal gas or with the OPAL nonideal EOS exhibit systhematic differences for lower effective temperatures of our grid. Only at the highest both series of models converge on the vs. plane. Such systhematic differences are not present in the vs. diagram and hence are not displayed here.

Furthermore, our synthetic NLTE colors of pure hydrogen white dwarfs are nearly identical with both our LTE colors of these stars (computed with other option to the tlusty195 code and still using ideal EOS) and the LTE colors obtained by Bergeron et al. (1995) in their intensive study on ages, luminosities, and other photometric parameters of DA white dwarfs.
3.1 Discussion of discrepancies
The above-mentioned systhematic differences could be caused by the effects of deviations from the ideal EOS for hydrogen gas, since they vanish at the highest . In order to verify such a hypothesis, we have chosen several temperature and gas pressure points across our sample pure H model atmosphere, K and , computed with the nonideal EOS and TOPS opacity data, see Table 3.
We compared two different densities corresponding to the same pair of , : density , obtained by direct interpolation of the OPAL tables, and corresponding to an ideal H gas, obtained from the relevant subroutines of the atm21 code. One can see that the difference between both densities reach 0.3 % at the bottom of the model, and it is much smaller in upper layers. Therefore we conclude that the EOS of an ideal gas is well fulfilled in all our pure H atmospheres, including also models of higher , of course. This firmly suggests that the impact of nonideal gas effects on the color discrepancies between our H models and these obtained with tlusty195 is negligible.
The referee pointed out that such differences could be due to NLTE effects considered by the code tlusty195, or other reasons. Earlier studies on this subject have already predicted the nonideal EOS’s and NLTE effects in hydrogen atmospheres of white dwarfs. Wesemael et al. (1980) in their extensive paper on WD model atmospheres and spectra, have also studied the influence of hydrogen line blanketing and NLTE effects on both and color indices. They found, for a pure H model atmosphere of K and , that both and line-blanketing corrections are of the order 0.001 mag (at most).
Therefore NLTE corrections to UBV are just negligible in case of pure H white dwarfs, for relatively hot objects of K. This conclusion is also supported by our own computations, which were not detailed in this paper.
The influence of blanketing by Balmer and Lyman lines is much more important. Wesemael et al. (1980) have determined that both and corrections, LTE minus NLTE, are equal to 0.017 mag and +0.043 mag, respectively, for a model of K and . Both corrections should increase in their absolute value with decreasing (see p. 300 of that paper). The quantity of both corrections, when extrapolated down to the K, seems comparable with both differences and , cf. Fig. 1.
Note that both series of pure H model atmospheres displayed in Fig. 1 take into account the blanketing by Balmer and Lyman lines. However, one can expect that perhaps TOPS hydrogen opacity tables do not include most sophisticated theory of H line broadening, thus causing and errors seen in Fig. 1. The difference strongly decreases in color, since in both and filters there are only single Balmer lines, and their broadening gets unimportant for the wide-band photometry.
At this point we turn the reader’s attention to the paper by Hubeny, Hummer & Lanz (1994), who discuss theory of NLTE model atmospheres with line blanketing also near the series limit (the occupation probability formalism). The latter implies dissolving of merging lines, which is the effect of nonideal gas in a stellar atmosphere (see also Lanz & Hubeny, who applied theory of dissolving levels in hydrogen dominated DA atmospheres with carbon or iron in trace abundances). Such a nonideal gas effect has been included also in our tlusty195 hydrogen atmosphere calculations, see Table 2 and Fig. 1.
Recent paper by Rohrmann et al. (2002) presents theory and derivation of the nonideal EOS for H and He gas, including their molecules. Rohrmann et al. (2002) concentrate on the theory of He core white dwarfs, which are much colder than WDs discussed in this paper.
4 Pure iron and H-Fe stratified atmospheres
We have computed and present here extensive set of pure iron model atmospheres and synthetic broadband colors for models of K and and 10 (cgs). We have extended our computations to an extremely large . In fact we are not aware of the existence of any white dwarf star with but assume that iron cores of a given mass would have much smaller radius , and therefore , than common carbon-oxygen cores. Pure H model atmospheres discussed in the previous section were also extended to such a large surface gravity due to the same reason.
Pure Fe model atmospheres were computed using nonideal EOS by Rogers (2002) and Los Alamos TOPS monochromatic opacities. Iron models were computed also on the grid of 155 discrete standard optical depth points, starting from the extremely high layer and with 901 discrete frequencies. Computations were very difficult and sometimes unstable due to complicated run of monochromatic opacities in Los Alamos tables and due to high gradients of opacities (with respect both to temperature and gas density) at higher densities of this exotic chemical composition. Moreover, pure iron model of K and was not in hydrostatic equilibrium, since the model exceeded the Eddington limit in its deeper layers. In other words, the acceleration of gas, exerted by the integrated radiative flux and directed upwards, exceeded gravitational acceleration in those layers.
4.1 Physical conditions in Fe atmospheres
Physical properties of pure Fe white dwarf atmospheres do not differ substantially from pure H atmospheres, at least for relatively high effective temperatures K which were investigated in this paper. Table 3 presents concisely values of few most important thermodynamical variables across the sample pure Fe model atmosphere with K and , organized in the same way as it was described in Section 3.1.
After each temperature iteration (and also after the final one), gas presures in the model are determined by integrating the equation of hydrostatic equilibrium
| (4) |
where all the monochromatic quantities were computed at the standard wavelength, Å. One can note that gas pressure is essentially determined by run of the standard opacities, .
Column No. 6 in Table 3 shows that TOPS opacities (for 1 gram of gas) are only times larger for iron than for hydrogen. This implies that resulting gas pressures on a fixed are few times smaller in pure Fe sample atmosphere than in pure H atmosphere of the same K. Iron and hydrogen atmospheres do not differ substantially from each other in the run of physical variables , , and the density .
On the contrary to the pure H model, columns 4 and 5 of Table 3 show that the realistic nonideal Fe gas density (Rogers 2002) differs from the density , computed by our atm21 code according to the ideal gas EOS. The difference of both densities reaches one order of magnitude in that model, which clearly demonstrates that the ideal EOS of iron would be of no use in WDs of K. We have checked that iron gas of density (cgs) behaves like an ideal gas in temperatures as high as K or higher.
Column 7 in Table 3 presents geometrical depths of various standard optical depth levels , assuming that the zero (reference) level of geometrical height is fixed at the upper boundary of a model atmosphere. The depth of a fixed level is given by
| (5) |
The total thickness of a sample pure H model atmosphere of K and equals to 7 kilometers. The corresponding pure Fe atmosphere is thinner, obviously due to a higher molecular weight of an iron gas.
| H model | ||||||
| cm | ||||||
| 1.0000E-10 | 1.1787E+04 | 1.7938E-02 | 9.2253E-15 | 9.2241E-15 | 5.5747E-01 | 0.0000E+00 |
| 1.0000E-06 | 1.1787E+04 | 9.6360E+01 | 4.9551E-11 | 4.9611E-11 | 1.5151E+00 | 1.6705E+05 |
| 1.0000E-03 | 1.3906E+04 | 6.3030E+03 | 2.7472E-09 | 2.7560E-09 | 2.7532E+01 | 2.5270E+05 |
| 1.0000E-01 | 1.7834E+04 | 1.0314E+05 | 3.5055E-08 | 3.5228E-08 | 1.4934E+02 | 3.2323E+05 |
| 1.0000E+00 | 2.5032E+04 | 6.0435E+05 | 1.4629E-07 | 1.4709E-07 | 2.4124E+02 | 3.8450E+05 |
| 1.0000E+02 | 6.0790E+04 | 2.3710E+07 | 2.3641E-06 | 2.3726E-06 | 6.4096E+02 | 6.3574E+05 |
| 2.6102E+02 | 6.7564E+04 | 4.5851E+07 | 4.1132E-06 | 4.1262E-06 | 8.0050E+02 | 7.0605E+05 |
| Fe model | ||||||
| cm | ||||||
| 1.0000E-10 | 1.1411E+04 | 1.6666E-01 | 3.6337E-13 | 3.2686E-12 | 5.9939E-02 | 0.0000E+00 |
| 1.0000E-06 | 1.2684E+04 | 1.6718E+02 | 3.2779E-10 | 2.9763E-09 | 1.0046E+00 | 3.2555E+04 |
| 1.0000E-03 | 1.4567E+04 | 9.1482E+03 | 1.5621E-08 | 1.4709E-07 | 3.8319E+01 | 5.4919E+04 |
| 1.0000E-01 | 1.7476E+04 | 6.0067E+04 | 8.5492E-08 | 7.8795E-07 | 2.8835E+02 | 6.7055E+04 |
| 1.0000E+00 | 2.2247E+04 | 2.2637E+05 | 2.5312E-07 | 2.2825E-06 | 5.7911E+02 | 7.7449E+04 |
| 1.0000E+02 | 5.5742E+04 | 9.6135E+06 | 4.2901E-06 | 2.4393E-05 | 1.2986E+03 | 1.3145E+05 |
| 2.6102E+02 | 6.3817E+04 | 1.7025E+07 | 6.6363E-06 | 3.6046E-05 | 3.4230E+03 | 1.4520E+05 |
4.2 Spectra of Fe atmospheres
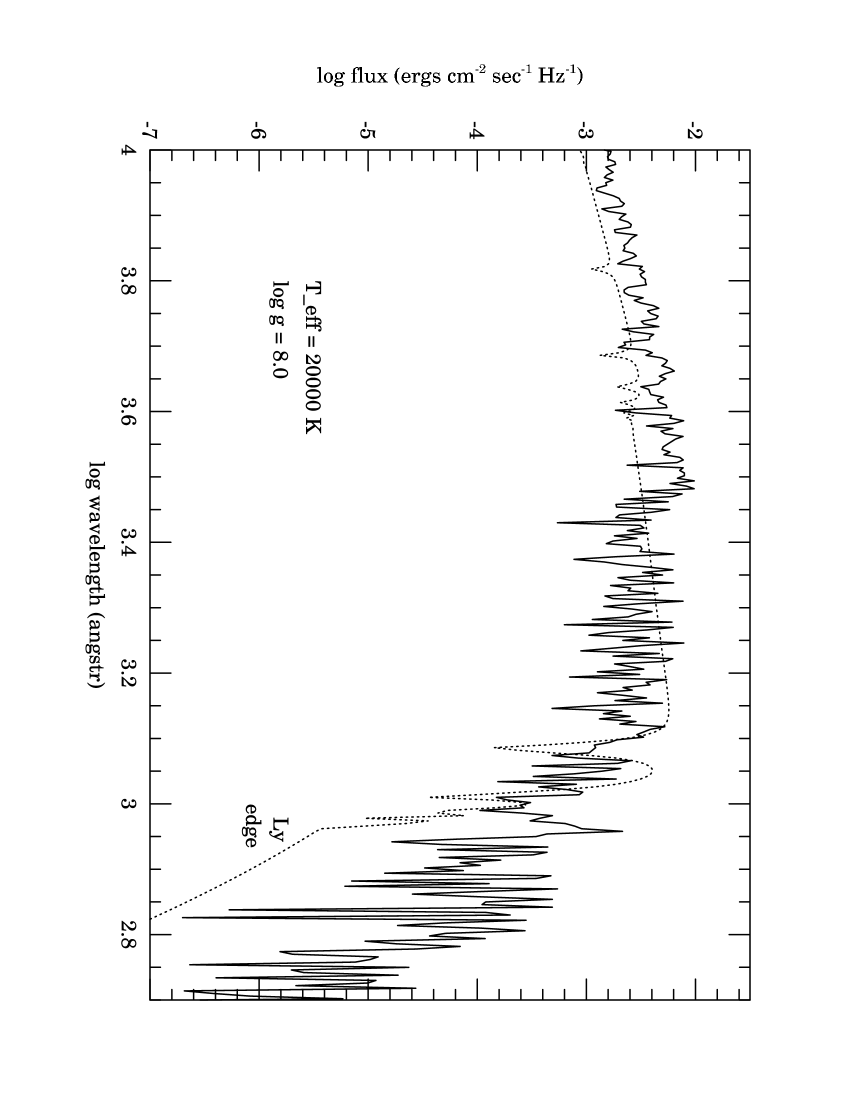
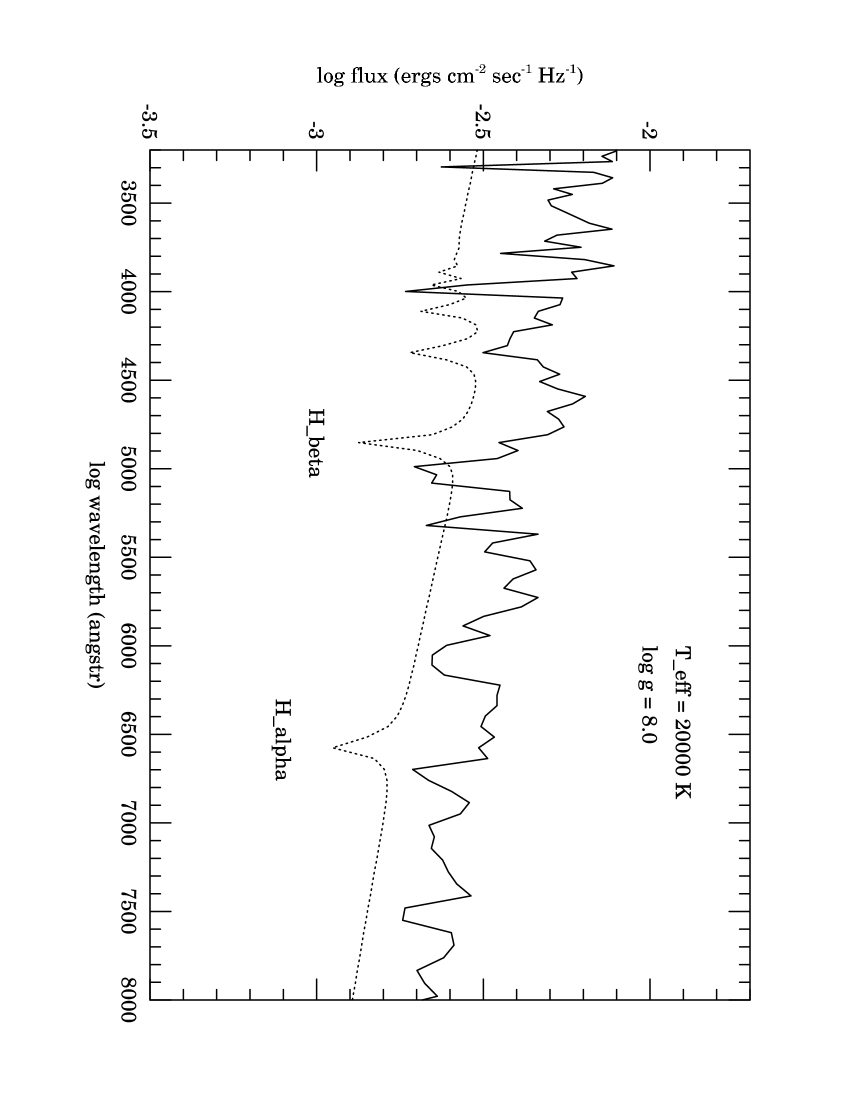
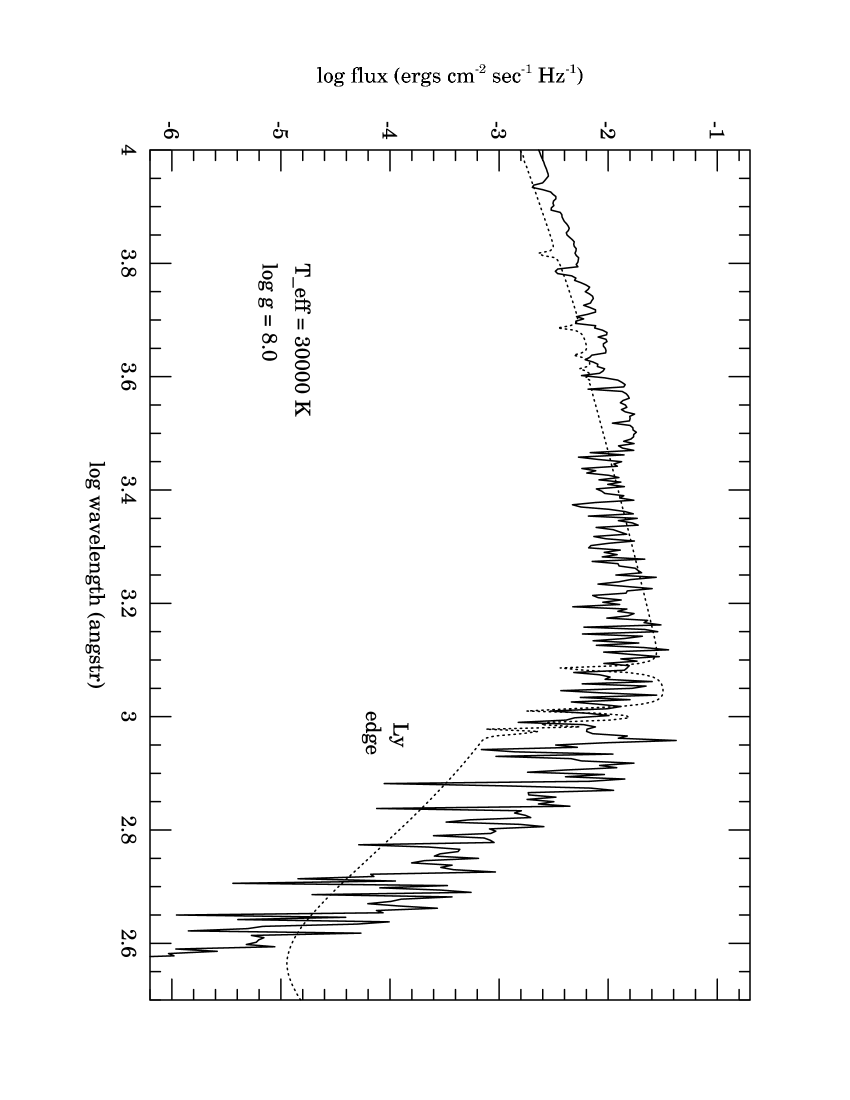
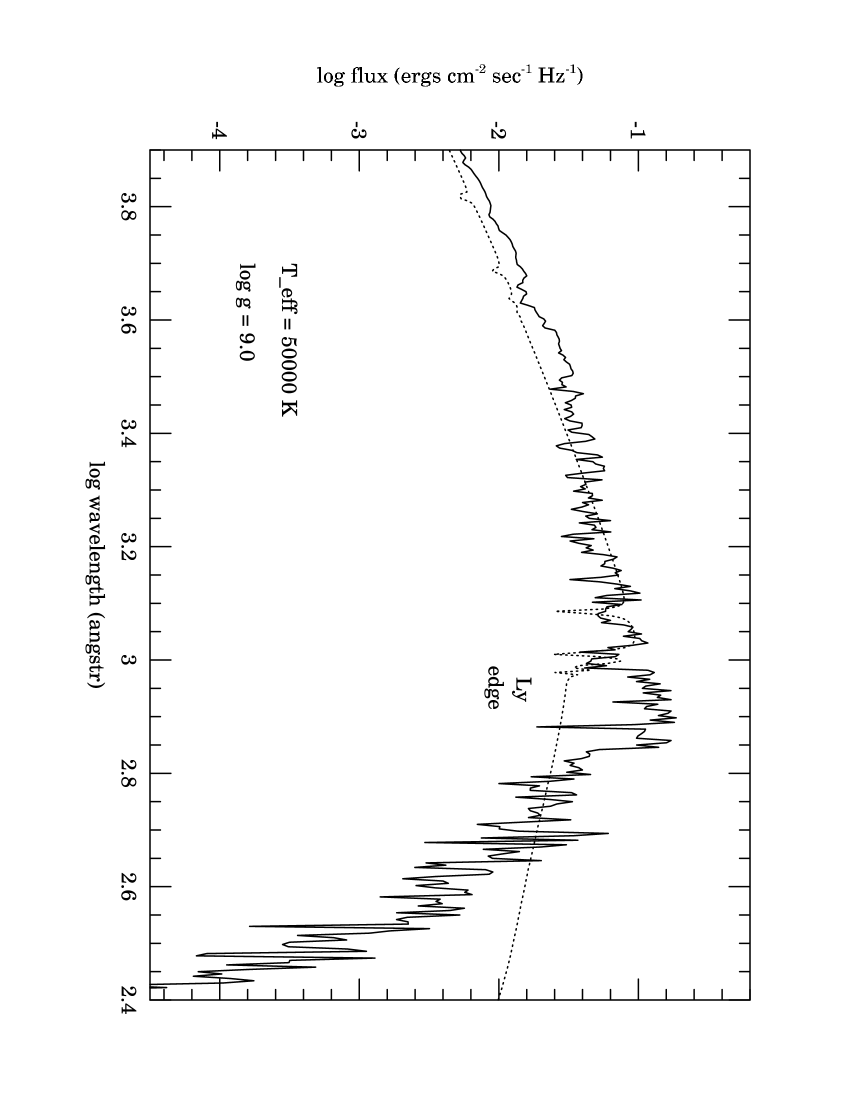
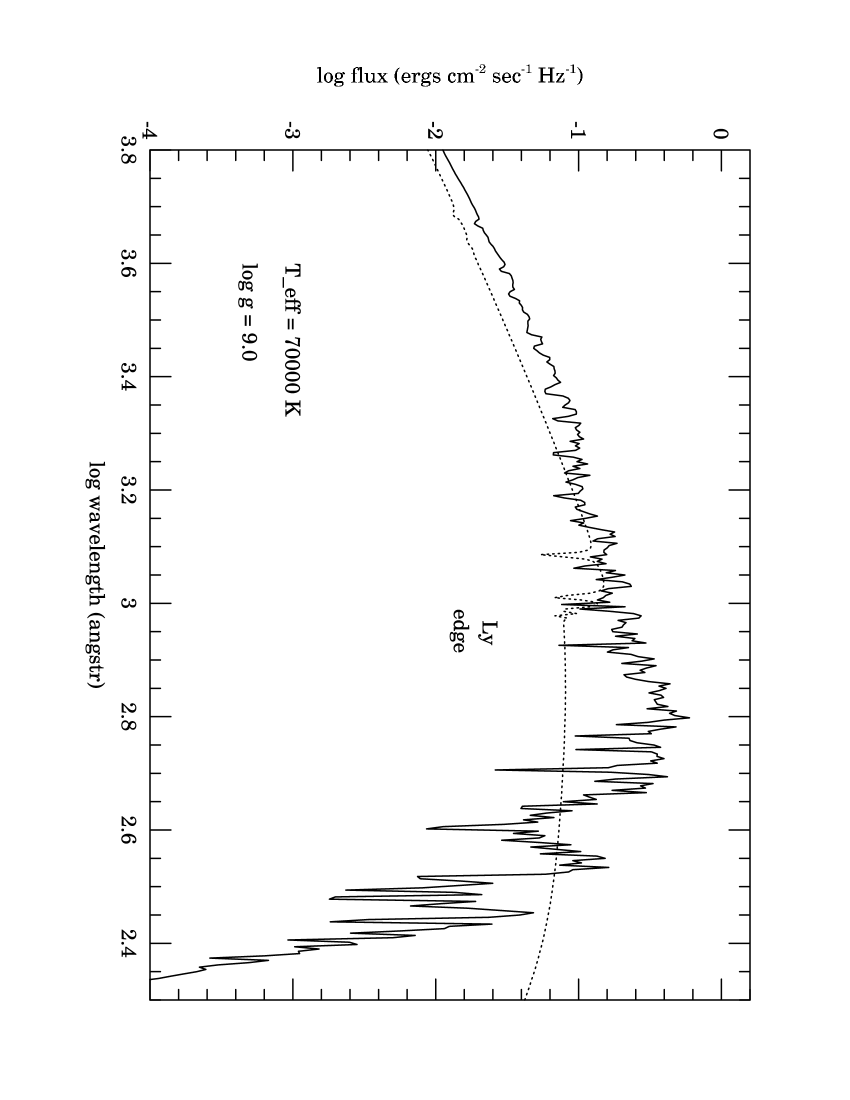
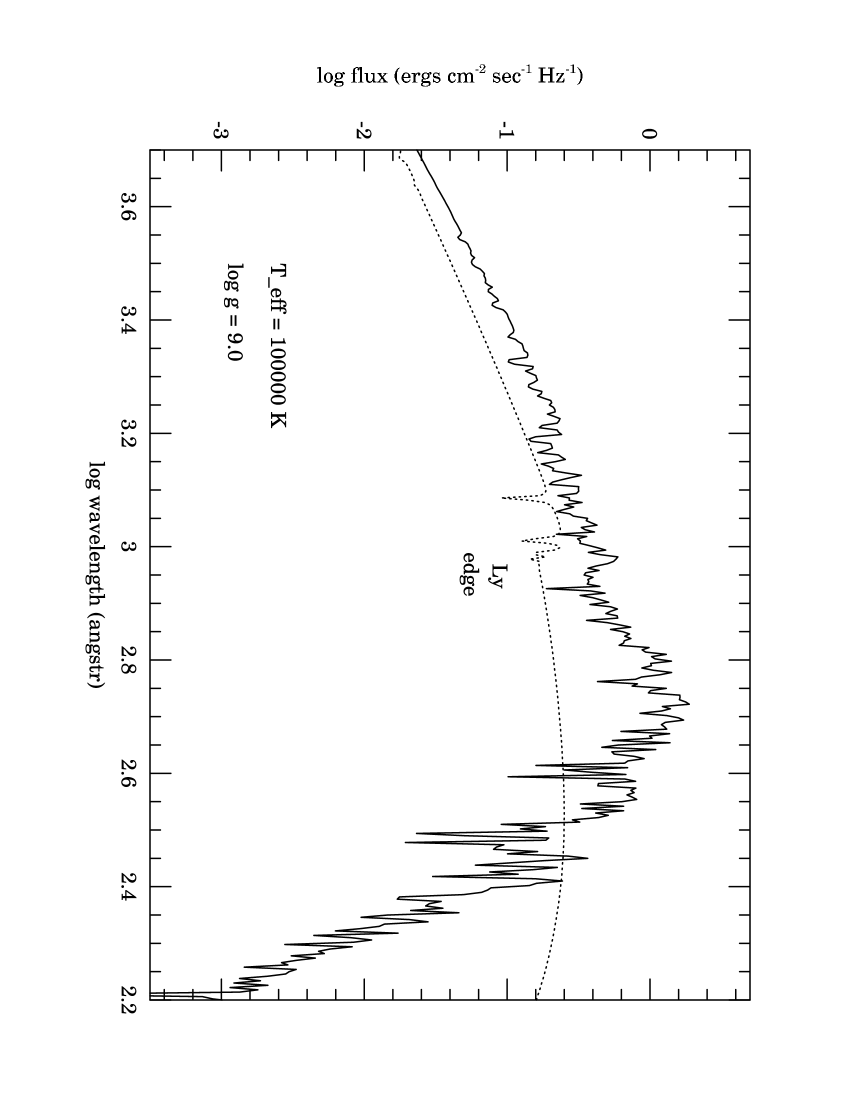
Sample spectra of both pure iron and pure hydrogen model atmospheres are plotted in Figs 2-7. They are arranged in order of increasing effective temperatures to demonstrate quantitatively evolution of both Fe and H spectra with increasing in the wide spectral region where the most of radiative energy is emitted. Effective temperatures chosen for this presentation range from 20000 K up to 100000 K and or 9.0 in hotter models.
Both series of model atmospheres were computed with the nonideal EOS from the OPAL Project to ensure consistency. One can see that pure Fe spectrum is entirely different from the H spectrum, both in visual (Fig. 3) and in far and extreme UV (Figs. 2 and 4-7). The Los Alamos TOPS monochromatic opacities suitable to nonideal EOS allowed us to reproduce strongly broadened hydrogen Lyman and Balmer lines (Fig. 3). Appearance of theoretical optical and near UV spectrum of the iron atmospheres is completely different and also exhibits strongly broadened iron features, but their identification is beyond the scope of this paper.
Fig. 3 shows that the sample pure Fe atmosphere of K is much brighter than pure H atmosphere in visual and also in far UV region beyond the Lyman edge (wavelengths Å). In near UV, for Å, pure Fe atmosphere is fainter that its pure H (i.e. the DA type) counterpart. Figs. 4-7 demonstrate that Fe atmospheres are very bright for Å also in higher . Only in the extreme UV, for Å, Fe atmospheres get extremely faint apparently due to increasing iron monochromatic absorption.
The latter effect, i.e. an increase of iron absorption in EUV and X-rays, is clearly seen in TOPS tables at any fixed temperature and gas density . In general, iron gas is much more opaque than hydrogen at any wavelength. This implies also that our pure Fe model atmospheres are geometrically thinner, as compared with pure H atmospheres of the same and , see also Table 3.
4.3 Broadband UBVRI colors
Theoretical broadband colors of our pure iron models are displayed in Table 3. Comparison of Tables 1 and 3 shows that and colors of iron models are significantly lower than the same color indices of hydrogen model atmospheres. Therefore, a pure iron atmosphere of a given and appears as if it was much hotter than pure H atmosphere with the same parameters (an iron WD appears more blue to an observer).
| 26 | 20 | 7 | -1.330 | -0.284 | 0.097 | -0.063 |
| 26 | 20 | 8 | -1.188 | -0.191 | 0.011 | -0.133 |
| 26 | 20 | 9 | -1.110 | -0.111 | -0.047 | -0.185 |
| 26 | 20 | 10 | -1.094 | -0.088 | -0.040 | -0.191 |
| 26 | 30 | 7 | -1.432 | -0.225 | -0.083 | -0.287 |
| 26 | 30 | 8 | -1.432 | -0.214 | -0.108 | -0.278 |
| 26 | 30 | 9 | -1.418 | -0.214 | -0.137 | -0.284 |
| 26 | 30 | 10 | -1.377 | -0.231 | -0.139 | -0.279 |
| 26 | 50 | 7 | -1.360 | -0.363 | -0.177 | -0.432 |
| 26 | 50 | 8 | -1.376 | -0.313 | -0.194 | -0.467 |
| 26 | 50 | 9 | -1.431 | -0.256 | -0.202 | -0.459 |
| 26 | 50 | 10 | -1.440 | -0.235 | -0.188 | -0.418 |
| 26 | 70 | 7 | -1.322 | -0.387 | -0.174 | -0.420 |
| 26 | 70 | 8 | -1.311 | -0.396 | -0.188 | -0.443 |
| 26 | 70 | 9 | -1.303 | -0.379 | -0.193 | -0.459 |
| 26 | 70 | 10 | -1.313 | -0.340 | -0.197 | -0.467 |
| 26 | 100 | 7 | -1.323 | -0.376 | -0.168 | -0.423 |
| 26 | 100 | 8 | -1.315 | -0.358 | -0.133 | -0.321 |
| 26 | 100 | 9 | -1.327 | -0.419 | -0.187 | -0.442 |
| 26 | 100 | 10 | -1.321 | -0.425 | -0.195 | -0.461 |
| H/Fe | 20 | 7 | -1.300 | -0.262 | 0.080 | -0.057 |
| H/Fe | 20 | 8 | -1.174 | -0.180 | -0.024 | -0.141 |
| H/Fe | 20 | 9 | -1.095 | -0.097 | -0.080 | -0.192 |
| H/Fe | 20 | 10 | -1.098 | -0.091 | -0.071 | -0.197 |
| H/Fe | 30 | 7 | -1.433 | -0.216 | -0.088 | -0.287 |
| H/Fe | 30 | 8 | -1.435 | -0.207 | -0.116 | -0.282 |
| H/Fe | 30 | 9 | -1.417 | -0.209 | -0.143 | -0.288 |
| H/Fe | 30 | 10 | -1.378 | -0.229 | -0.147 | -0.285 |
| H/Fe | 50 | 7 | -1.363 | -0.357 | -0.177 | -0.429 |
| H/Fe | 50 | 8 | -1.390 | -0.299 | -0.200 | -0.466 |
| H/Fe | 50 | 9 | -1.431 | -0.255 | -0.217 | -0.451 |
| H/Fe | 50 | 10 | -1.440 | -0.235 | -0.210 | -0.415 |
| H/Fe | 70 | 7 | -1.320 | -0.381 | -0.170 | -0.413 |
| H/Fe | 70 | 8 | -1.311 | -0.390 | -0.182 | -0.425 |
| H/Fe | 70 | 9 | -1.305 | -0.374 | -0.190 | -0.445 |
| H/Fe | 70 | 10 | -1.315 | -0.338 | -0.197 | -0.461 |
| H/Fe | 100 | 7 | -1.315 | -0.364 | -0.152 | -0.376 |
| H/Fe | 100 | 8 | -1.326 | -0.392 | -0.163 | -0.382 |
| H/Fe | 100 | 9 | -1.323 | -0.408 | -0.180 | -0.428 |
| H/Fe | 100 | 10 | -1.318 | -0.419 | -0.191 | -0.452 |
We have also computed model atmospheres of a more complex structure, in which pure iron gas is covered by a pure hydrogen layer of an arbitrary thickness. Table 4 presents color indices of such stratified atmospheres, in which we have arbitrarily assumed that the transition depth between hydrogen and iron layers is located at the standard optical depth . This assumption precisely determines the column mass of a hydrogen layer in each model atmosphere
| (6) |
Hydrogen column mass in our H-Fe stratified atmospheres weakly depends both on and of the models. For example, H column mass is equal to g cm-2 in the coldest model of K and , and slowly rises to g cm-2 for the hottest model of K and (cf. sequence of sample models, Figs. 2-7).
It would be very interesting to convert H column masses to the total mass of a hydrogen envelope covering the iron core of a white dwarf. Such a rescaling requires the knowledge of the radius , whereas our models are parametrized by the gravity, . We have arbitrarily assumed the mass of a white dwarf to be , and used relations for iron core white dwarfs (Panei et al. 2000; Althaus 2003). Respectively, the total mass of a hydrogen envelope in two above sample models is lesser than for K and , and is approximately equal to for the hottest model of K and .
One can note that the estimated masses of a hydrogen layer are rather small, as compared with H masses arbitrarily assumed in published grids of theoretical relations ( up to . This is because H-Fe stratified models in the present paper require a H layer of the moderate optical depth in frequencies corresponding to the UBVRI filters, which do not cover completely the iron core.
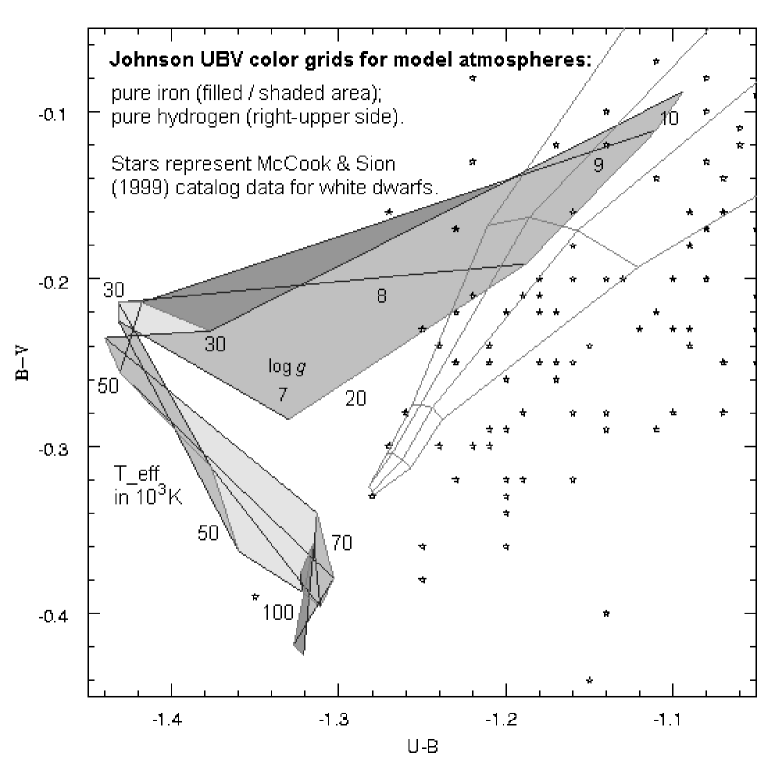
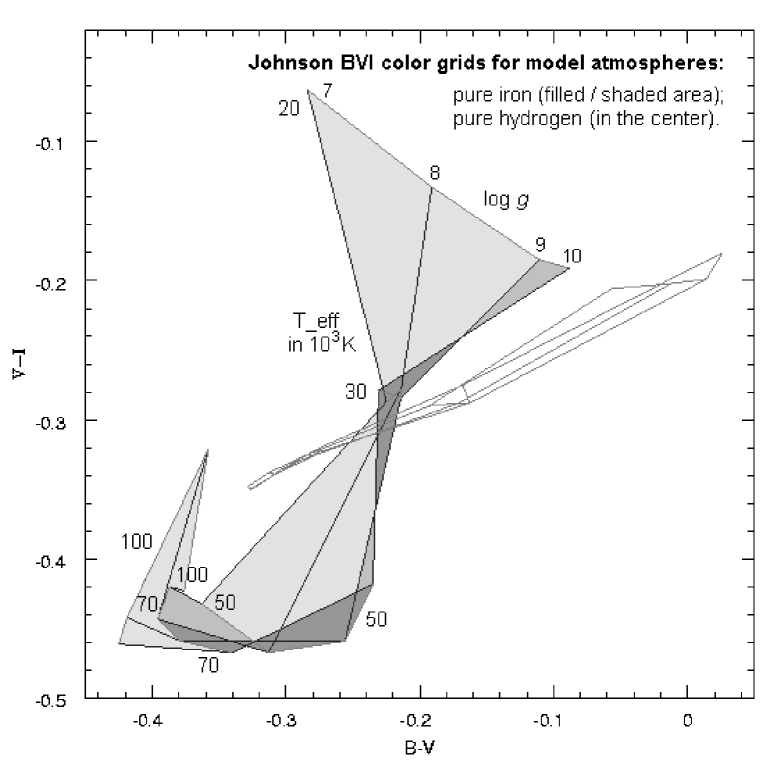
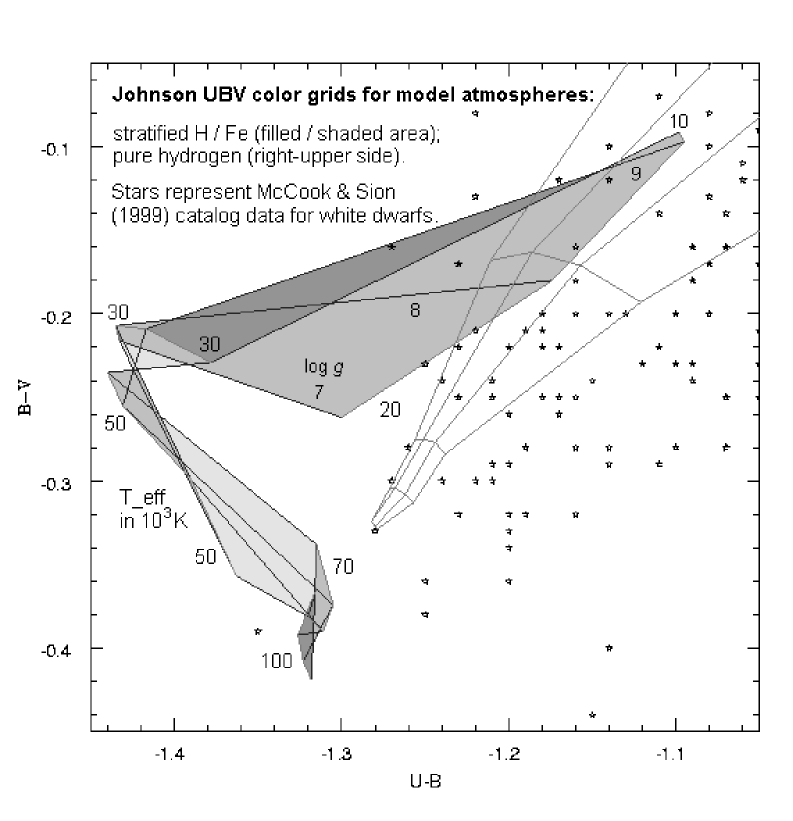
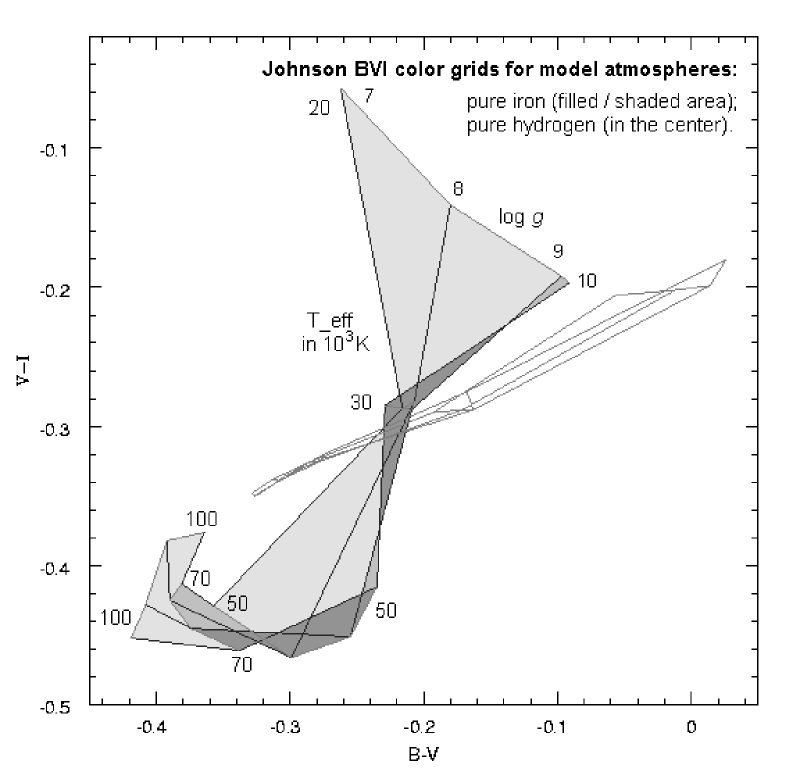
Figs. 8 and 10 show positions of various model atmospheres on the theoretical vs. diagram, whereas Figs. 9 and 11 display colors of the models on the vs. diagram. The Figures present colors of both pure and stratified atmospheres. For these models, we obtained , and colors which depend on changes of and in a rather complex way (cf. Tables 3–4). One can clearly see that the colors of iron-containing models may overlap, causing them to be a non-unique function of the set of parameters , . Pure hydrogen models are also subject to this feature (at least on the vs. diagram), but the complexity for the iron models is much higher. This complicate dependence of the colors is due to a noisy structure of the TOPS grids of iron monochromatic opacities. Consequently, all these Figures present shaded areas, where atmospheres containing pure iron are located. We do not highlight lines of constant or for those models. One can see, that the region occupied by pure iron model atmospheres significantly differs from the region corresponding to pure hydrogen models in all the analysed cases.
The latter observation shows that it would be possible to distinguish pure iron WD atmospheres from pure hydrogen DA atmospheres with K by means of the broadband Johnson UBV photometry, at least in principle. Our analysis and Figures include neither possible admixture of helium or other heavier elements in DA white dwarf atmospheres, nor the influence of their opacities on spectra and theoretical colors of mostly hydrogen white dwarf atmospheres. Admixture of heavier elements in hot WD atmospheres seems very common in real stars. For example, Barstow et al. (1993) showed that most of the hot DA white dwarfs with effective temperatures K have some abundance of elements heavier than He in their atmospheres. This can explain their generally low X-ray luminosity, as it is found in the all-sky catalog of white dwarfs.
There exist many and color measurements available for isolated white dwarfs, which were published in the catalogue by McCook & Sion (1999). Therefore we have plotted colors for individual white dwarfs in both Figs. 8 and 10 as asterisks, in order to search for possible white dwarfs with pure or stratified Fe atmospheres. Unfortunately, one can note that the observed stars generally do not fall into shaded areas of each Figure, but rather avoid them. Most of the observed and colors mostly overlap the area of pure hydrogen atmospheres.
The above observation proves that the set of white dwarfs with color indices predicted for iron atmospheres is almost empty, except for a few cases of marginal significance.
Figs. 9 and 11 do not include observed colors of real WDs. Measurements of near infrared luminosity (and therefore color) are extremely rare for hotter isolated white dwarfs. Also the newest catalogs of and of hot objects, which are known to us (Renzini 2001; Zoccali et al. 2001) do not distinguish hydrogen DA and other types of white dwarfs. Existing surveys of colors of white dwarfs concentrate on the search of infrared excess presumably in binary stars, and are not useful in this research.
5 Search for iron core white dwarf candidates
5.1 Listing by Provencal et al. (1998)
It is interesting to search for possible iron core white dwarf stars among the existing WD catalogs. The first such effort has been done by Provencal et al. (1998), who compared masses and radii of white dwarf stars with theoretical mass-radius relations for various WD core compositions. Their mass and radius determinations were based mostly on the Hipparcos parallaxes, thus suggesting higher accuracy. Mentioned paper includes also Procyon B as a candidate for iron core star, however, this star has been classified as a normal white dwarf based on precise Hubble spectral measurements (Provencal et al. 2002).
Based on the first quoted paper we have selected 7 white dwarfs, for which best determined masses and radii place them closest to the theoretical mass-radius relation for iron core white dwarf stars (cf. Fig. 3 in Provencal et al. 1998). Neglecting possible errors of and determinations we suggest that these stars are promising candidates for comparing them with our theoretical UBVRI color indices (see Table 5). Some of these stars were also indicated by Panei et al. (2000), who placed them on their theoretical mass-radius relation for iron core white dwarfs.
Unfortunately, stars listed in our Table 6 are rather cold. The hottest of them, EG 50 ( K) and GD 140 ( K), are located practically at the border of the grid presented in this paper. Color indices and the position of both stars in our two-color diagrams places them far from the region occupied by pure iron atmospheres. Moreover, they are located in the region occupied by pure hydrogen atmospheres. Therefore we conclude that even if those stars have iron cores, they are covered by a thick hydrogen layer of a large optical depth. This conclusion is supported by the fact that McCook & Sion (1999) classified all the stars from Table 5 as pure hydrogen DA white dwarfs.
| WD | |||||
|---|---|---|---|---|---|
| EG 21 | 0.554 | 8.06 | 0.0115 | -0.55 | 0.05 |
| EG 50 | 0.497 | 8.10 | 0.0104 | -0.91 | -0.08 |
| G 238-44 | 0.417 | 7.90 | 0.0120 | -0.86 | -0.09 |
| G 181-B55 | 0.50 | 8.05 | 0.0110 | -0.55 | 0.17 |
| GD 140 | 0.797 | 8.48 | 0.0085 | -0.95 | -0.06 |
| GD 279 | 0.411 | 7.83 | 0.0129 | -0.60 | 0.10 |
| WD 2007-303 | 0.433 | 7.86 | 0.0128 | -0.66 | 0.07 |
5.2 Other catalogs of WD masses and surface gravities
In order to search for candidate iron core stars we have performed search of papers listing mass and surface gravity determinations of white dwarfs carried out in the recent surveys (Vennes et al. 1997; Finley et al. 1997; Homeier et al. 1998; Napiwotzki, Green & Saffer 1999; Vennes 1999; Bergeron et al. 2001).
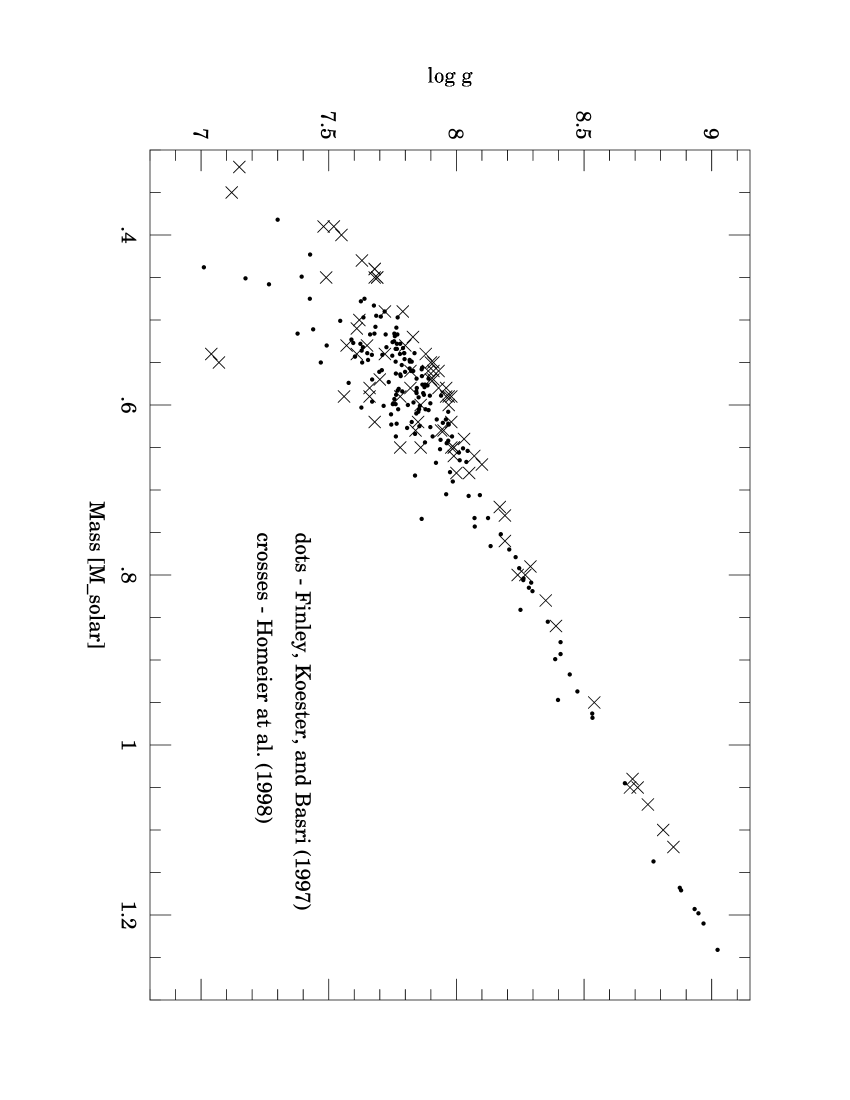
The above papers discuss mostly DA white dwarfs, i.e. those with hydrogen-rich atmospheres and therefore strong Balmer lines (cf. Figs. 2–3). Grids of theoretical colors of Fe-abundant atmospheres given in Tables 3–4 are not useful here. Therefore we attempted to identify stars of exceptionally high (and hence a small radius) in those papers. Unfortunately, several trial figures displaying vs. relations have shown that there are no stars which exhibit large for a given mass as compared with the general trend.
As an example, we plot two such relations in Fig. 12, which are based on the data from Finley et al. (1997), and Homeier et al. (1998). The former paper presents a table with mass and surface gravity determinations for 90 hot DA white dwarfs from the Extreme Ultraviolet Explorer () all-sky survey.
Surface gravity and are usually determined by fitting of the observed Balmer line profiles and therefore this method makes direct to observable quantities. One should necessarily note, however, that in all the above papers masses of DA white dwarfs were obtained using the theoretical mass-radius relations for carbon-core stars with hydrogen or helium envelope (see Wood 1995). We are aware that if masses were determined with the most new mass-radius relation for iron-core WDs by Panei et al. (2000), then the above Figure would change significantly.
6 Summary
The most important areas of concern of our paper can be summarized as follows.
1. We have computed and presented here LTE model atmosphere computations of hot white dwarfs, which atmospheres consist either of pure iron, stratified iron/hydrogen layers, or pure hydrogen. Model atmospheres are in both radiative and hydrostatic equilibrium. Computations use exclusively the equation of state for nonideal Fe and H gases, obtained by the OPAL project, and the extensive tables of the TOPS monochromatic opacities from the Los Alamos National Laboratory. The latter opacities are fully compatible with the nonideal EOS for both gases.
2. This paper presents calibration of colors , , and of the broadband Johnson photometry, for pure Fe, pure H and stratified Fe/H atmospheres. These colors were computed from theoretical spectra of our model atmospheres with a nonideal EOS.
3. The paper investigates the influence of nonideal equation of state on the photometric colors of the broadband Johnson system, both in pure H and pure Fe model atmospheres. We showed that effects of nonideal EOS for pure iron model atmospheres are substantial in the investigated models, contrary to pure H WD atmospheres.
4. We have also computed colors of the models and determined the area on the vs. and vs. planes, occupied by both pure Fe and pure H model atmospheres of WD stars.
The importance of our paper is that we have determined the area on two-color diagrams in which colors of the hypothetical pure iron or stratified H/Fe atmospheres should be located. Colors of the above hypothetical atmospheres are distinctly different from colors of pure hydrogen DA WSs with K. We are aware, however, that our paper does not predict colors of iron core WDs in case, if the core is covered by a hydrogen layer of significant optical thickness.
Acknowledgements.
We thank I. Hubeny for his agreement to use the tlusty195 code and related discussions. We appreciate also comments by P. Bergeron and A. Renzini regarding photometric properties of DA white dwarfs. Our thanks are also due to L.G. Althaus for providing us with his theoretical relations for various white dwarfs. This work has been supported by the Polish Committee for Scientific Research grant No. 2 P03D 021 22.References
- (1) Althaus, L.G., 2003, personal communication
- (2) Barstow, M.A., Fleming, T.A., Diamond, C.J., Finley, D.S., Sansom, A.E., Rosen, S.R., Koester, D., Holberg, M.C., Marsh, J.B., Kidder, K., 1993, MNRAS, 264, 16
- (3) Bergeron, P., Wesemael, F., Beauchamp, A., 1995, PASP, 107, 1047
- (4) Bergeron, P., Leggett, S.K., Ruiz, M.T., 2001, ApJS, 133, 413
- (5) Bessell, M.S., 1990, PASP, 102, 1181
- (6) Castelli, F., Kurucz, R.L., 1994, A&A, 281, 817
- (7) Finley, D.S., Koester, D., Basri, G., 1997, ApJ, 488, 375
- (8) Girard, T.M., Wu, H., Lee, J.T., Dyson, S.E., van Altena, W.F., Horch, E.P., Gilliland, R.L., Schaefer, K.G., Bond, H.E., Ftaclas, C., Brown, R.H., Toomey, D.W., Shipman, H.L., Provencal, J.L., Pourbaix, D., 2000, AJ, 119, 2428
- (9) Girardi, L., Bertelli, G., Bressan, A., Chiosi, C., Groenewegen, M.A.T., Marigo, P., Salasnich, B., Weiss, A., 2002, A&A, 391, 195
- (10) Hayes, D.S., 1985, Calibration of fundamental stellar quantities, IAU Symposium 111, eds. D.S. Hayes, L.E. Pasinetti, and A.G.D. Philip (Dordrecht, Reidel), 225
- (11) Homeier, D., Koester, D., Hagen, H.-J., Jordan S., Heber, U., Engels, D., Reimers, D., Dreizler, S., 1998, A&A 338, 563
- (12) Hubeny, I., 1988, Comput. Phys. Comm., 52, 103
- (13) Hubeny, I., Lanz, T., 1992, A&A, 262, 501
- (14) Hubeny, I., Hummer, D.G., Lanz, T., 1994, A&A, 282, 151
- (15) Hubeny, I., Lanz, T., 1995, ApJ, 439, 875
- (16) Lanz, T., Hubeny, I., 1995, ApJ, 439, 905
- (17) Lemke, M., 1997, A&AS, 122, 285
- (18) Madej, J., 1991, ApJ, 376, 161
- (19) Madej, J., 1994, Acta Astron. 44, 191
- (20) Madej, J., 1998, A&A, 340, 617
- (21) Madej, J., Różańska, A., 2000, A&A, 356, 654
- (22) Magee, N.H., Abdallah, J., Jr., Clark, R.E.H., Cohen, J.S., Collins, L.A., Csanak, G., Fontes, C.J., Gauger, A., Keady, J.J., Kilcrease, D.P., Merts, A.L., 1995, Astrophysical Applications of Powerful New Databases. Joint Discussion No. 16 of the 22nd. General Assembly of the I.A.U., ASP Conference Ser., Vol. 78, 51 eds. S.J. Adelman & W.L. Wiese
- (23) McCook, G.P., Sion, E.M., 1999, ApJS, 121, 1
- (24) Mihalas, D. 1978, Stellar Atmospheres, 2nd Ed., W.H. Freeman & Co., San Francisco
- (25) Napiwotzki, R., Green, P.J., Saffer, R.A., 1999, ApJ, 517, 399
- (26) Panei, J.A., Althaus, L.G., Benvenuto O.G., 2000, A&A, 353, 970
- (27) Provencal, J.L., Shipman, H.L., 1999, 11th European Workshop on White Dwarfs, ASP Conference Series, Vol. 169, 293, eds. J.-E. Solheim & E.G. Meistas
- (28) Provencal, J.L., Shipman, H.L., Hog, E., Thejll, P., 1998, ApJ, 494, 759
- (29) Provencal, J.L., Shipman, H.L., Koester, D., Wesemael, F., Bergeron, P. 2002, ApJ, 568, 324
- (30) Renzini, A., 2001, personal communication
- (31) Rogers, F.J., 1994, in “The Equation of State in Astropyhsics”, IAU Colloquium 147, eds. G. Chabrier and E. Schatzman (Cambridge University Press), p. 16
- (32) Rogers, F.J., 2002, personal communication
- (33) Rogers, F.J., Swenson, F.J., Iglesias, C.A., 1996, ApJ, 456, 902
- (34) Rohrmann, R.D., Serenelli, A.M., Althaus, L.G., Benvenuto, O.G., 2002, MNRAS, 335, 499
- (35) Stage, M.D., Joss, P.C, Madej, J., 2002, Neutron Stars in Supernova Remnants, ASP Conference Series, Vol. 271, 327, eds. Patrick O. Slane & Bryan M. Gaensler
- (36) Vennes, S., 1999, ApJ, 525, 995
- (37) Vennes, S., Thejll, P.A., Galvan, R.G., Dupuis, J., 1997, ApJ, 480, 714
- (38) Wesemael, F., Auer, L.H., Van Horn, H.M., Savedoff, M.P., 1980, ApJS, 43, 159
- (39) Wood, M., 1995, Lecture Notes in Physics, 443, White Dwarfs, eds. D. Koester & K. Werner (Berlin: Springer), 41
- (40) Zoccali, M., Renzini, A., Ortolani, S., Bragaglia, A., Bohlin, R., Carretta, E., Ferraro, F.R., Gilmozzi, R., Holberg, J.B., Marconi, G., Rich, R.M., Wesemael, F., 2001, ApJ, 553, 733