22email: pasquali@phys.ethz.ch 33institutetext: University of Wisconsin, Department of Astronomy, 475 N. Charter St., Madison WI 53706, USA
33email: jsg@astro.wisc.edu 44institutetext: University of Sheffield, Department of Physics and Astronomy, Hicks Building, Hounsfield Road, Sheffield S3 7RH, UK, 44email: R.deGrijs@sheffield.ac.uk
Nuclear star formation in NGC 6240
We have made use of archival HST BVIJH photometry to constrain the nature of the three discrete sources, A1, A2 and B1, identified in the double nucleus of NGC 6240. STARBURST99 models have been fitted to the observed colours, under the assumption, first, that these sources can be treated as star clusters (i.e. single, instantaneous episodes of star formation), and subsequently as star-forming regions (i.e. characterised by continuous star formation). For both scenarios, we estimate ages as young as 4 million years, integrated masses ranging between 7 106 M⊙ (B1) and 109 M⊙ (A1) and a rate of 1 supernova per year, which, together with the stellar winds, sustains a galactic wind of 44 M⊙ yr-1. In the case of continuous star formation, a star-formation rate has been derived for A1 as high as 270 M⊙ yr-1, similar to what is observed for warm Ultraluminous Infrared Galaxies (ULIRGs) with a double nucleus. The A1 source is characterised by a mass density of about 1200 M⊙ pc-3 which resembles the CO molecular mass density measured in cold ULIRGs and the stellar density determined in “elliptical core” galaxies. This, together with the recent discovery of a supermassive binary black hole in the double nucleus of NGC 6240, might indicate that the ongoing merger could shape the galaxy into a core elliptical.
Key Words.:
Galaxies:evolution, Galaxies:individual: interactions, starburst, star clusters1 Introduction
The importance of starbursts associated with major mergers between galaxies became clear when IRAS revealed populations of luminous and ultraluminous infrared galaxies (LIRGs and ULIRGs) in the nearby universe (cf. Neugebauer et al. 1984, Soifer et al. 1984). Interest therefore remains high in understanding how these starbursts are structured. While LIRGs are characterised by an infrared (IR; m) luminosity L 1011 L⊙, ULIRGs exceed L 1012 L⊙ (Sanders & Mirabel 1996). ULIRGs contain M⊙ of molecular gas (Evans et al. 2001) and are typically the merger of two or more disk galaxies of nearly equal mass ( 3:1, Sanders 2001). Indeed, NGC 4038/39 (the Antennae), Arp 220 and NGC 7252 are not only classical examples of LIRGs and ULIRGs, but also are key benchmarks in the Toomre sequence of galaxy mergers (Toomre 1977).
HST/WFPC2 and NICMOS imaging has revealed that 5% – 20% of the known ULIRGs are multiple mergers, probably descending from compact groups of galaxies (Cui et al. 2001, Bushouse et al. 2002). Independently of their multiplicity, ULIRGs show circumnuclear bright knots usually identified with concentrations of stars younger than years (e.g., Zepf & Ashman 1993, Scoville et al. 2000, Surace et al. 2000, Farrah et al. 2001). At optical wavelengths, ULIRGs are characterised by a nuclear spectrum which is either Seyfert-like consistent with the presence of an AGN or QSO, LINER-like or HII-region-like. In these last two cases, star clusters and/or HII regions seem to be the dominant source of ionization (Veilleux et al. 1999).
NGC 6240 is one of the closest member of the class of ULIRGs, being at a distance of Mpc (for km s-1 Mpc-1). Its far-IR luminosity is L⊙ (Wright et al. 1984) and it places NGC 6240 at the faint (or “warm”) limit of the ULIRGs class. ¿From the point of view of morphology, NGC 6240 is classified as a merger of two massive disk galaxies (Zwicky et al. 1961, Fosbury & Wall 1979, Tacconi et al. 1999); the colours of the nuclear and circumnuclear stellar populations indicate that the merger has possibly been ongoing for the past 1 Gyr (Genzel et al. 1998, Tecza et al. 2000). The gravitational interactions as well as disturbances induced by star formation are responsible for large-scale dust lanes, loops, shells and tails extending out to kpc (cf. Pasquali et al. 2003, hereafter Paper I). The central region of the merger is characterised by a double nucleus, with the two optically visible nuclei separated by on average with their apparent separation increasing at shorter wavelengths (Bryant & Scoville 1999, Scoville et al. 2000). The H2 and CO emission is found to peak in between the nuclei, possibly in a thick disk structure, and slightly closer to the Southern nucleus (van der Werf et al. 1993, Tacconi et al. 1999, Ohyama et al. 2000). This off-set is believed to be the result of interactions between the molecular gas and an expanding shell centered on the southern nucleus (Rieke et al. 1985), or to the gravitational settling of gas into a nuclear disk as the interaction evolves (Tacconi et al. 1999).
A remarkable feature of the NGC 6240 nuclei is the three discrete sources, A1, A2 and B1 located in the southern “A” and the northern “B” nucleus, respectively. They were first resolved in HST/FOC B-band images by Barbieri et al. (1993) who measured an enhanced blue continuum emission corresponding to these sources. In a subsequent analysis based on [OII]/[OIII]/H line ratios, Rafanelli et al. (1997) suggested that B1 is a LINER, and A2 a LINER or a HII region (cf. Veilleux et al. 1995). The authors also pointed out that the line ratios derived for A1 are typical of a Seyfert galaxy or a high-excitation HII region. A Seyfert-like nature would imply the presence of an AGN in the A core. These nuclear sources are believed to drive a large-scale outflow (Heckman et al. 1987).
K-band imaging of NGC 6240 reveals the presence of red supergiants in the double nucleus (Tecza et al. 2000) from which an age between 15 and 25 Myr is inferred for the galaxy nuclei. In the radio, 70 of the flux at 20 cm is emitted by A and B, of which half comes from two unresolved sources and half is diffuse emission (Colbert et al. 1994). These compact sources do not align up with B1 and A1A2, but are shifted westward and less separated, probably because of obscuration effects. Their spectrum is quite flat ( = 0.6) suggesting that their radio emission is powered by the local starburst.
Beswick et al. (2001) observed neutral hydrogen in absorption against the two nuclei of NGC 6240 using MERLIN with an angular resolution of 0.2 arcsec. The nuclei appear as slightly extended sources at a frequency of 5 GHz with a resolution of 0.1020.055 arcsec and are separated by 1.52 arcsec. The radio continuum emission is attributed to a combination of AGNs and starburst activity. The HI absorption appears to be associated with the gas disk that is also seen in CO. Hagiwara, Diamond, & Miyoshi (2003) present radio maps of the H2O masers in NGC 6240, and show that the masers are concentrated in the southern A1 nucleus, which evidently contains dense gas.
ISO data have revealed OIV emission from the nuclei which is attributed to an AGN (Genzel et al. 1998, Lutz et al. 2003). AGN-like hard X-ray emission is observed below 10 keV (Iwasawa & Comastri 1998, Vignati et al. 1999). High-resolution follow-up observations with Chandra and the HRC camera in the keV band have been performed by Lira et al. (2002). In the high resolution X-ray map, the emission peaks coincide with B1 and A1. Lira et al. used the X-ray fluxes together with optical-to-radio luminosities measured for the galaxy’s double core and fitted the resulting spectral energy distribution (SED) with a combination of starburst, QSO and blackbody continuum spectra. It then turns out that the starburst component dominates the observed SED at most wavelengths and the dust associated with the starburst is responsible for the K-band emission. The AGN accounts mainly for the hard X-ray emission and is completely absorbed in the near IR, optical and soft X-ray bands. Very recently, Komossa et al. (2003) imaged the A and B nuclei with Chandra ACIS-S and clearly detected an AGN in each nucleus, so that the existence of a binary system of supermassive black holes in the core of NGC 6240 has now been firmly established.
In this paper, we aim to estimate the age, mass and reddening of the stellar content of the nuclear sources in NGC 6240 and compare these with their properties at radio and X-ray wavelengths, in order to: i) discuss the star formation mode ongoing in the core of such a gas-rich and dynamically extreme system, and ii) possibly shed some light on the nature of the end-product of the merging process at work in NGC 6240.
2 Data processing
2.1 Observations
NGC 6240 was observed with HST at several wavelengths. Here, we have collected the data acquired with WFPC2 as part of the GO proposal 6430 (PI van der Marel, cf. Gerssen et al. 2001) and NICMOS/NIC2 for the GO proposals 7219 (PI Scoville) and 7882 (PI van der Werf). The image rootnames with their corresponding filters and exposure times are listed in Table 1.
| Dataset | Filter | Exp. Time in s |
|---|---|---|
| u4ge010.. | F450W - broad B | 3 700.00 |
| u4ge010.. | F547M – medium V | 400.00 800.00 |
| u4ge010.. | F814W – I | 3 400.00 |
| n48h09w.. | F110W – J | 4 39.95 |
| n48h09… | F160W – H | 4 47.95 |
| n48h09x.. | F222M – K short | 4 55.94 |
We retrieved the WFPC2 and NICMOS images already pipeline-processed, i.e. corrected for bias, dark current and flat field. We registered the WFPC2 frames to the same spatial grid of the images taken with the F450W filter, by simply measuring the position of several point sources in common and their relative shifts in (X;Y) among the available datasets. The (X;Y) shifts were then applied with the IRAF routine IMSHIFT. Once aligned, the images acquired with the same filter were combined with the STSDAS task CRREJ to clean them from cosmic rays and have them median-combined to improve their S/N ratio.
The NICMOS pipeline-reduced images were aligned to the frames acquired with the F110W filter with the same technique as above. Since they were obtained with Camera 2 (FOV of 22 22′′ at 0.075′′/pix) they essentially overlap with the central area of the PC images containing the galactic double nucleus.
2.2 Multiband photometry
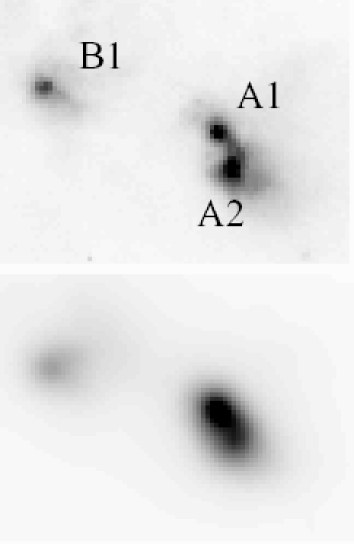
The high spatial resolution of the Planetary Camera has made possible to detect three discrete sources in the nuclei of NGC 6240 which were labelled A and B by Barbieri et al. (1993). On the basis of their coordinates, our sources have counterparts in Barbieri et al.’s FOC images, namely A1, A2 and B1, and in the Chandra images at keV obtained by Lira et al. (2002). Figure 1 shows the F814W and F160W images of these nuclear sources, where the NIC2 image in H has been scaled to the resolution of the PC I image.
| Cluster | B | V | I | J | H |
|---|---|---|---|---|---|
| A1 | 23.27 0.05 | 20.82 0.04 | 18.73 0.02 | 17.49 0.02 | 16.96 0.02 |
| A2 | 21.59 0.03 | 19.77 0.04 | 18.56 0.05 | 17.73 0.03 | 17.33 0.03 |
| B1 | 21.19 0.01 | 19.84 0.01 | 19.24 0.03 | 18.66 0.04 | 18.49 0.04 |
Their positions were measured with the IRAF routine IMEXAMINE, and were used as the input coordinates for PHOT in DAOPHOT. Photometry of the nuclear sources was performed assuming an aperture radius of 3 pixels in the PC images. A median, local background of diffuse emission underlying the nuclear sources was computed over an annulus of 4-to-6 pixels.
Aperture fluxes were corrected for the camera’s charge transfer (in)efficiency (CTE) following Whitmore & Heyer (1998). Aperture corrections to the standard 0′′.5 aperture were determined from two bright and point-like isolated objects in the PC, and subsequently applied to the measured fluxes. Only at this stage, fluxes were first transformed into the WFPC2 synthetic magnitude system and subsequently into the Johnson magnitude system using the zero points and the colour equations listed in Holtzman et al. (1995).
Because it becomes very difficult to clearly identify the A1, A2 and B1
sources in the K band, where emission from dust dominates the stellar emission
from the nuclei (cf. Gerssen et al. 2003), we performed aperture photometry
only on the F110W and F160W images. We set the aperture radius to 2 pixels and
measured a median sky in an annulus of 5-to-8 pixels. Subsequently,
background-corrected aperture fluxes were scaled first to those corresponding
to the fluxes in a 0′′.5 radius aperture and then to the flux of an infinite
radius aperture following the prescription given in the NICMOS Photometry
Cookbook (cf. http:/www.stsci.edu/hst/nicmos/performance/
photometry/cookbook.html).
The BVIJH magnitudes of the nuclear sources and their uncertainties are listed in Table 2.
3 The stellar populations in the nuclear sources
The A1, A2 and B1 sources have a mean FWHM of 5.2, 9.6 and 4.2 pixels respectively, a factor of 3 to 6 larger than the PC stellar PSF, therefore they are resolved. From their FWHM we can derive estimates for their tidal radii, which vary between 47 and 108 pc. Such values have also been estimated for some of the younger and intermediate-age star clusters in the Antennae (Whitmore et al. 1999): knot S and cluster 430 have a tidal radius of 450 pc and 73 pc, respectively, while the intermediate-age cluster 225 has a tidal radius of 50 pc. In comparison, all the globular clusters in M31 are characterized by R 100 pc (Cohen & Freeman 1991, Grillmair et al. 1996), and only two Galactic globular clusters have R 200 pc (Djorgovski 1993). In addition, young and massive star clusters are quite often found in the nuclei of late-type spiral and barred spiral galaxies (cf. Sect. 5). On the other hand, the nuclear sources in NGC 6240 possibly show spectra typical of HII regions (Veilleux et al. 1995, Rafanelli et al. 1997) and may well be extended clumps of star formation. This option would also be more consistent with the findings of an underlying, 1 Gyr-old stellar population (Genzel et al. 1998, Tecza et al. 2000), so that the light of the newly born OB stars is now dominating the colours of the nuclear sources.
We have fitted the colours observed for the nuclear sources [(B-V), (V-I), (V-J) and (V-H) corrected for the Galactic E(B-V) = 0.076 mag (Schlegel et al. 1998)] to STARBURST99 (Leitherer et al. 1999) tracks, which were computed:
i) for instantaneous star formation in a star cluster with a mass of 105 M⊙ and solar metallicity (cf. Sect. 3.1);
ii) for continuous star formation with a rate (SFR) of 10 M⊙ yr-1 and solar metallicity (cf. Sect. 3.2).
Indeed, colours depend mainly on reddening and age once the metallicity is fixed. In massive clusters stochastic effects in the stellar population are minmized and so the colors become insensitive to the total mass so long as the stellar mass function is fixed (Lançon & Mouchine 2000, Cerviño et al. 2002). No metallicity has so far been measured for NGC 6240, but McCall et al. (1985) predicted a metallicity of about 20 solar. The computed STARBURST99 tracks also assume a Salpeter IMF from 0.1 M⊙ to 100 M⊙, a (Type II) supernova cut-off mass of 8 M⊙, standard stellar mass loss and theoretical wind models.
The theoretical colours at each time mesh point were reddened according to Calzetti’s (2001) extinction law, and a value was computed as the sum of the differences between the reddened theoretical and the observed colours, weighted by the observational uncertainties. For each time mesh-point, the reddening was varied from E(B-V) = 0.0 to 5.0 mag with a step of 0.01 mag and a set of reddening, absolute V magnitude and colours have been saved corresponding to the minimum derived from the fit to the observed colours. The lowest value among the minima () obtained along the age sequence of the evolutionary track has been selected together with its relative set of best-fitting reddening, colours and absolute magnitudes. The latter represent our best-fitting model SED to each of the three discrete sources. In addition, the reddened theoretical apparent V magnitude was scaled to the observed one and the initial track mass or SFR was multiplied by this scaling factor in order to estimate either the integrated mass or the total SFR of the discrete sources.
In order to assign a confidence interval to age, mass and reddening, we have extracted from the previous fits all the (reddening, age, absolute magnitudes, mass) solutions associated with a 1.5 times the value. These are selected to obtain the range of acceptable suboptimal fits to the photometry. We have used these intervals to construct the probability functions of age, mass and reddening for A1, A2 and B1 in the same way as done in Paper I for the clusters in the main body and tails of NGC 6240. In summary, we combined the ranges spanned by the fits to age, reddening and mass into histograms, where the value of each bin is the number of acceptable solutions. Each bin was then normalized by the total number of model solutions for the nuclei of NGC 6240, so that a probability function is obtained for the age, mass and reddening of the sources. A word of caution applies here, whereby a photometry measured through larger apertures might give somewhat higher masses and SFRs and might negligibly affect ages.
3.1 The cluster hypothesis

The best-fitting SEDs obtained under the assumption that the nuclear sources in NGC 6240 are star clusters are plotted, as solid lines, in the left-hand panels of Fig. 2. Superposed are the sources observed, apparent magnitudes, represented by filled dots. The observational uncertainties (cf. Table 2) are smaller than the symbol sizes. The obtained for each colour for minimum is plotted in the right-hand panels of Fig. 2 with the aim of showing which colours agree better with the evolutionary tracks and which are discrepant. The lowest ( 6) occurs for the A1 source, whose theoretical SED agrees with the observations to within the photometric errors (except for the J band). The B1 and A2 best-fitting SEDs deviate from the observed B band by 0.3 and 0.5 mag respectively, and this discrepancy could in part be due to contamination by nebular emission (see, e.g., Anders & Fritze-von Alvensleben 2003 for possible contaminants and their effects on broad-band fluxes as a function of age of the dominant stellar population). We have estimated a line-contribution of 0.1 mag in the F450W filter from the integrated central spectrum published by Fosbury & Wall (1979) and 0.07 - 0.05 mag in the F110W and F160W filters from the spectra in Simpson et al. (1996). Uncertainties in the colour equations used to transform WFPC2 magnitudes to the Johnson system may also contribute. The best-fitting age, reddening and mass of A1, A2 and B1 are listed in Table 3. Adopting Calzetti’s (2001) extinction law, we estimate for the double nucleus of NGC 6240 an AV extinction between 4 and 9 mag, in agreement with the value 3 A 5 initially derived by Fosbury & Wall (1979) and DePoy et al. (1986). The estimate given by Lutz et al. (2003) is larger, A mag, which has been derived from the flux ratio of the Br to the [NeII] 12.81m lines. The authors themselves consider their estimated AV very uncertain because of the difficulty to measure the Br line of the underlying gas against the stellar component.
| Source | Age (Myr) | E(B-V) (mag) | Mass (M⊙) |
|---|---|---|---|
| A1 | 4.4 0.05 | 2.3 0.05 | 1.2 ( 0.2) 109 |
| A2 | 3.9 0.10 | 1.7 0.02 | 4.2 ( 0.5) 108 |
| B1 | 4.0 0.05 | 1.0 0.02 | 2.9 ( 0.2) 107 |
The probability functions (for the sources’ age, mass and reddening) are plotted in Fig. 3 as dashed histograms, together with those derived in Paper I for the clusters in the main body and tails of NGC 6240. A caveat applies here, as discussed extensively in Paper I: the histograms in Fig. 3 simply give the most probable value(s) for the clusters’ age, mass and reddening, but do not represent the true cluster parameters. Indeed, when the mass ranges spanned by the clusters are combined in a probability function, their width (i.e. the error bar on the mass value most consistent with the data for each cluster) has the effect of smearing any intrinsic relationship between apparent luminosity and cluster mass, and the probability function may show a peak. In addition to this, evolutionary effects, such as those associated with a non-coeval population of star clusters, also broadens power law luminosity functions (cf. Meurer 1995, Fritze-von Alvensleben 1998, 1999, de Grijs et al. 2001, 2003a). Moreover, luminosity selection effects (i.e. limiting magnitude of 25 mag) prevent the detection of clusters at any age that are less massive than 4 104 M⊙ and allow only ever more massive clusters to be revealed at gradually older ages. Therefore, the mass distribution of the NGC 6240 clusters (middle panel in Fig. 3) is heavily compromised by the limiting magnitudes for masses lower than 4 104 M⊙, even among the very young star clusters.
Because the fits for the nuclear sources are based on four independent colours, instead of two as for the other NGC 6240 star clusters (cf. Paper I), the confidence intervals for A1, A2 and B1 are well determined and narrow: they do not overlap, except in age. The discrete sources in the nuclei of NGC 6240 certainly stand out because of their young ages with respect to the overall cluster population, but, while B1 and A2 fall on the tail of the cluster mass and reddening distributions, A1 shows extreme values for both of these parameters. It is interesting to note the increase in E(B-V) from B1 in the northern nucleus to A1 and A2 in the southern one which is consistent with the 3D geometry of the double nucleus as derived by Ohyama et al. (2003).

3.2 The hypothesis of continuous star formation
Only a very small number of compact coeval star-forming events with masses like those inferred for the nuclei of NGC 6240 in the previous Section have been observed (e.g., NGC 7252 cluster W3: Schweizer & Seitzer 1998, Maraston et al. 2001; NGC 6745: de Grijs et al. 2003b); spectroscopic mass confirmation has only been obtained for cluster W3 in NGC 7252 to date. The presence of an AGN within both nuclei also points to complex evolutionary histories where we expect circumnuclear stars to span a range in age. We further hypothesize that the circumnuclear SFR is likely to have increased during the ongoing merger in NGC 6240. Therefore we have to consider a continuous star formation scenario, such as described by STARBURST99 models with a SFR of 10 M⊙ yr-1 and solar metallicity. The resulting best-fitting model SED is shown in Fig. 4 for each source, where we also indicate the associated with the observed colours for minimum , and the best-fitting properties of the three nuclear regions are listed in Table 4. Similarly as for the cluster scenario, we determine for the galaxy double core an AV extinction ranging from 3 to 9 mag.
| Source | Age (Myr) | E(B-V) (mag) | SFR (M⊙ yr-1) | Integrated Mass (M⊙) |
|---|---|---|---|---|
| A1 | 4.4 0.9 | 2.4 0.07 | 266 109 | 1.3 ( 1.0) 109 |
| A2 | 4.3 0.4 | 1.5 0.05 | 21.5 5.7 | 9.6 ( 3.4) 107 |
| B1 | 4.3 0.7 | 0.8 0.08 | 1.5 0.6 | 7.2 ( 3.7) 106 |
The minimum is particularly large for B1 and A2 as it is dominated by the large discrepancy in the (B-V) colour (0.7 and 0.5 mag, respectively). As already suggested, this deviation could in part be produced by contamination from nebular emission in the B band; uncertainties in the colour equations used to transform WFPC2 magnitudes to the Johnson system may also contribute. In the case of B1 and A2, the minimum is a factor of 2 worse than obtained under the assumption that these sources are star clusters. The SEDs derived for A1 for the two scenarios are similar ( of 5.91 for a cluster SED against 6.56 for a continuous star-forming region). The difference in (B-V) and (V-I) between the evolutionary tracks employed so far (with a fixed cluster mass of 105 M⊙ and for a SFR of 10 M⊙ yr-1) are within the observational errors for ages of few million years. Therefore, given the observed colours of A1, A2 and B1, we are not able to discriminate between a cluster and a sharp SBST model.
Probability functions have also also derived and are plotted as dashed histograms in Fig. 5, together with the probability functions computed for the NGC 6240 clusters (from Paper I).
Once again, the discrete sources in the nuclei of NGC 6240 are among the youngest stellar systems in the galaxy, with ages between 3.5 to 5.4 106 years, thus implying that young stars dominate the circumnuclear regions in optical. The integrated mass of A1, A2 and B1 overlaps with the high-mass tail of the overall NGC 6240 cluster distribution, with A1 showing an extreme value once again. This same trend can be recognized in the reddening histogram.

3.3 Dependences on metallicity
To test the robustness of our results against metallicity, we have repeated the above analysis using STARBURST99 tracks computed under the same assumptions, but with the metallicity set to Z = 0.008 (LMC-like). Tables 5 and 6 summarize the best-fitting parameters obtained for the cluster and the continuous star formation scenarios, respectively.
| Source | Age (Myr) | E(B-V) (mag) | Mass (M⊙) | |
|---|---|---|---|---|
| A1 | 4.7 2.0 | 2.4 0.2 | 2.6 ( 1.4) 109 | 6.39 |
| A2 | 4.3 1.5 | 1.6 0.2 | 4.2 ( 2.8) 108 | 18.87 |
| B1 | 4.6 1.6 | 0.9 0.2 | 2.0 ( 1.2) 107 | 57.05 |
| Source | Age (Myr) | E(B-V) (mag) | SFR (M⊙ yr-1) | Integrated Mass (M⊙) | |
|---|---|---|---|---|---|
| A1 | 6.1 2.5 | 2.4 0.08 | 412 219 | 2.5 ( 1.8) 109 | 5.86 |
| A2 | 6.2 2.7 | 1.5 0.13 | 33.4 21.6 | 2.1 ( 1.7) 108 | 33.64 |
| B1 | 6.5 3.6 | 0.8 0.21 | 2.8 2.3 | 1.8 ( 1.6) 107 | 85.73 |
We conclude that the properties derived for a solar- and a LMC-like metallicity are well within the uncertainties of the best fits for each of the scenarios modelled. A better overall agreement between the solar and LMC-like metallicity cases is achieved for the cluster hypothesis. In the case of continuous star formation, the sources’ ages and star-formation rates are systematically larger for Z = 0.008 than for Z = Z⊙. Although the values of the best fits are comparable, an LMC-like metallicity introduces larger uncertainties on the parameters than a solar chemical composition. Hereafter, we will adopt the results of the evolutionary tracks with Z = Z⊙.
4 Discussion
4.1 Nuclear stellar populations
A starbust can be modeled either as a single and instantaneous event of star formation, or as an act of continuous star formation extended over a short period of time. We have computed a STARBURST99 model for both scenarios, and assuming a total cluster mass of 105 M⊙ in the case of a single stellar burst and a SFR of 10 M⊙ yr-1 for the continuous star formation hypothesis. We have fitted the photometry measured for the multiple nuclei of NGC 6240 A1, A2 and B1 to the synthetized populations, hoping that the observed colours could discriminate between the two scenarios. Within the observational uncertainties, the results almost overlap and do not support either of the two models more strongly than the other.
4.1.1 Ages
Both models indicate that the optical SEDs of A1, A2 and B1 are dominated by light from stellar populations with ages of 4 Myr and moderate-to-heavy obscuration. As already discussed by Lira et al. (2002), these optical SEDs are not uniquely tied to the presence of the AGN in either B1 or A1.
We notice that all three nuclear condensations in NGC 6240 resemble other Starburst/AGN systems, where large contributions to the light come from young stellar populations. Indeed, González Delgado et al. (2001) found that young and intermediate-age stars are present in the nuclear and circumnuclear regions of 45 of Seyfert 2 galaxies. The contribution of young and intermediate-age stars to the nuclear stellar population in Seyfert 2 galaxies can be as high as 50 and 40 respectively (e.g. NGC 5135 and NGC 7130; González Delgado et al. 2001).
4.1.2 Stellar Mass Estimates and Star Formation Rates
Under the assumption of a single and instantaneous burst of star formation, we have derived stellar masses of about 1 109, 4 108 M⊙ and 3 107 M⊙ for A1, A2 and B1, respectively. If the cluster hypothesis were correct, these nuclei would be the most massive known, exceeding by a factor the most massive globular clusters. In particular, B1 would be the counterpart of the W3 cluster in NGC 7252 (at a distance of 15′′ from the galactic centre; Whitmore et al. 1993) for which Maraston et al. (2001) estimate a total mass of 3.7 107 M⊙ and an age of about 300 Myr, using high-resolution spectroscopy. Another massive cluster has been detected in NGC 1316 with a mass of about 1.4 107 M⊙ and an age of 3 Gyr (Goudfrooij et al. 2001). In addition, de Grijs et al. (2003b) have extended the cluster mass function in the interacting galaxy NGC 6745 up to masses of several M⊙, although their mass estimates are thus far only based on multi-passband HST photometry. The masses of A1, A2 and B1, combined with the clusters mass distribution in the outer (tails) and inner regions of the galaxy (cf. Paper I), would point to a radial gradient in the cluster mass, whereby less massive clusters would preferentially form far from the galactic centre and more massive clusters closer. In the assumption that the dynamical timescale of the merger is larger than the age of the nuclear sources, we would expect to find more massive clusters in the galactic nuclei not as the result of mass segregation, but as a consequence of larger amounts of gas funneled towards the galactic centre by the merger dynamics. Indeed, the central location of such massive clusters as A1, A2 and B1 is particularly interesting. So far, there have been a number of detections of a single massive cluster in the centre of a galaxy. For example, Carollo et al. (1997) resolved compact sources in the nuclei of 18 spiral galaxies (with an exponential bulge) in a total sample of 35 galaxies, for which a mass of M⊙ and an age 1 Gyr are inferred (Carollo et al. 2001). More recently, Böker et al. (2002) identified a compact cluster at the centre of 59 late-type spiral galaxies in a sample of 77 galaxies. For example, the cluster at the centre of NGC 4449 was dated between 6 and 10 Myr old and as massive as 4 105 M⊙ (Böker et al. 2001). Colina et al. (2002) identified a cluster of 4 Myr old and as massive as 105 M⊙ in the nucleus of NGC 4303, which is a barred spiral and thought to be a low-luminosity AGN. By analogy to what is observed for NGC 6240 (cf. Lira et al. 2002), this nuclear cluster dominates the optical emission of the galaxy core. Additional clusters, although slightly younger ( Myr) and less massive ( M⊙), have been detected in the circumnuclear regions of NGC 4303 (Colina et al. 2002).

Assuming continuous star formation, we obtained for A1, A2 and B1 a SFR of 266, 21.5 and 1.5 M⊙ yr-1, respectively, which gives an integrated mass of about 1 109, 1 108 and 7 106 M⊙ respectively. Star formation appears to be by far more active in the southern nucleus, A, which is consistent with the southern nucleus being brighter at radio and X-ray wavelengths, in H2, CO and H2O maser (Hagiwara et al. 2003) emission. This might point to a larger reservoir of gas in the southern nucleus compared to the northern on (see Sect. 4.2 for a discussion on the relation between the star formation history and gas supply in NGC 6240). In particular, the SFR estimated for A1 in the optical is of the same order as the SFR derived from the integrated IR luminosity of NGC 6240 ( 140 M⊙ yr-1, Heckman et al. 1990), thus indicating that the nuclear sources dominate the galaxy’s IR emission and star formation activity. For these integrated masses and for the cluster masses derived above, we estimate a total bolometric luminosity of 1012 L⊙. Lutz et al. (2003) have computed L 5 1011 L⊙ from comparison with starburst template spectra in the [NeIII] 15.55m [NeII] 12.82m, with the caveat that this may be an underestimate since NGC 6240 is more obscured than the template starbursts.
The SFR in the double nucleus of NGC 6240 has also been measured at radio wavelengths by Beswick et al. (2001). They have derived, from the 1.4 GHz luminosity, a SFR of about 83 M⊙ yr-1 adopting a Salpeter IMF and assuming that stars initially more massive than 8 M⊙ become supernovae (SNe) with significant radio emission. This value is a factor of 2 to 5 lower than what we have estimated for A1, using BVIJ photometry and STARBURST99 models based on a Salpeter IMF with only stars more massive than 8 M⊙ exploding as type II SNe. This discrepancy could have a variety of possible sources, including the calibration of the techniques, possible impact of rapid evolution in NGC 6240, and the offset between regions that are bright in the optical and the radio, as evidenced by the radio centres being shifted westward and having a smaller projected separation than the optical. This smaller distance optical light and radio wavelengths, with the radio centres being shifted westward and less separated. This smaller distance is probably an effect of extinction increasing in between A1 and B1 (cf. the 3D structure of the double nucleus as modeled by Ohyama et al. 2003). Therefore, eventual star-forming regions between A1 and B1 would be hidden from detection at optical wavelengths and become visible only at radio wavelengths. As a caveat, the radio SFR could in principle be associated with star-forming regions different from A1, A2 and B1, which are not detected at optical wavelengths because of their high extinction. However, despite these uncertainties, the point remains that NGC 6240 has a prodigious SFR in its double nuclei.
In terms of SFRs and ages, the nuclear sources in NGC 6240 closely resemble those detected in Arp 299. The latter appear to be Myr old, with SFRs between 40 and 140 M⊙ yr-1 and integrated masses in the range M⊙ (i.e. 1 to 2 orders of magnitude more massive than star clusters and HII regions in Arp 299, Alonso-Herrero et al. 2000). According to Ballo et al. (2003), Arp 299 harbours an active AGN in both nuclei and would be, with NGC 6240, the only merging system with two AGNs. Although the statistics are very poor, it would seem that the more powerful AGNs may be coupled to larger nuclear SFRs and larger total nuclear masses in newly born stars ( 4 Myr old), as already pointed out by González Delgado et al. (1998).
4.1.3 The High Energy Budget
Irrespective of the scenario adopted (star clusters or continuous star formation), the STARBURST99 code computes, for the inferred ages and total masses of A1, A2 and B1 a SN rate of about 1 SN yr-1, in agreement with what Colbert et al. (1994) and Beswick et al. (2001) estimated from the nuclear radio emission at 20 cm and 1.4 GHz, respectively. The largest contribution to this SN rate comes from A1. These SN explosions would power a galactic superwind which manifests itself as a gas outflow in the H and Br images (cf. Heckman et al. 1987, Paper I).
The predicted mechanical energy flux released by the stellar winds and SN explosions in A1, A2 and B1 is 6 1043 ergs s-1 from both the continuous and instantaneous star-formation scenarios. This value is in agreement with the predictions of Heckman et al. (1990). Indeed, if a total IR luminosity of L⊙ is assumed for NGC 6240, equation (11c) in Heckman et al. gives an energy flux from SN explosions and stellar winds in the range ergs s-1. According to the superbubble model by Mac Low & McCray (1988), a conversion factor of total wind/SN energy flux to kinetic energy of the gas of 30 implies a kinetic energy of 2 1043 ergs s-1. Adopting a velocity spread of the H filaments of 1000 km s-1 (Heckman et al. 1990), we have computed a galactic wind, mass-loss rate of about 44 M⊙ yr-1.
How do the STARBURST99 models compare with the observed, soft X-ray emission in NGC 6240? Schulz et al. (1998) determined, from ROSAT observations, a soft X-ray luminosity of about 1042 ergs s-1. Based on the superwind model by Mac Low & McCray (1988) and Heckman et al. (1996), Schulz et al. suggested that this luminosity is due to an input energy flux of 1044 ergs s-1, equivalent to 3 SNe per year. Such a flux can expand a superbubble out to a radius of 10 kpc in 3 107 yr. The calculations assumed an ISM density of 0.1 cm-3 and a filling factor of the X-ray emitting gas of about 0.2. We have repeated the exercise of Schulz et al. by assuming an input energy of 6 1043 ergs s-1 (from the STARBURST99 fits to the observed photometry of A1, A2 and B1 with Z = Z⊙) and a kinetic energy of 2 1043 ergs s-1. From Schulz et al.’s equation (3), we estimate a soft X-ray luminosity of 6 1041 ergs s-1, which agrees with the observed X-ray luminosity within a factor of 2. The agreement strongly depends on the uncertainties in the observations and the model assumptions. However, it could be improved if, for example, the conversion factor of input energy flux to kinetic energy were higher than 27 (up to perhaps 50) and/or the filling factor of the superbubble were smaller than 0.2, by perhaps a factor of 2.
4.2 Star Formation Lifetimes and Histories
The nuclear condensations A1, A2 and B1 appear to be “embedded” in a circumnuclear population of 1 Gyr old (Genzel et al. 1998, Tecza et al. 2000), possibly implying that the NGC 6240 nuclei have been undergoing a large spread in the star formation activity. This co-existence of old and young stellar populations has also been seen in the Antennae nuclei, where Berta et al. (2003) have been able to date two star-formation episodes; one occurred about 1 Gyr ago and the other is still ongoing. The authors suggest that the bimodal star-formation history in the Antennae nuclei is the result of a double encounter in the dynamical evolution of the galaxies’ merger. Similar star formation patterns are seen in other classes of interacting galaxies; e.g. the Seyfert 1 NGC 3227 (Schinnerer et al. 2001). However, it is also possible that the pre-merger systems could provide a substantial fraction of the older stars seen in NGC 6240. The correlation between nuclear black hole mass and the stellar mass of the bulges of non-interacting galaxies implies that the pre-merger galaxies in NGC 6240 both had significant bulges (Kormendy & Richstone 1995, Marconi & Hunt 2003).
The data also indicate that substantial variations in SFRs occur over very short time spans, 10 Myr, in mergers. For example, in Arp 299 Alonso-Herrero et al. (2000) detected an extended period of star formation that began 7 Myr before the most recent episodes with ages of 4 Myr. The extremely young stellar population ages of 4 Myr that we find for the three NGC 6240 nuclei is another indication of this effect. Rapid variations in SFRs might be expected to be associated with the compact, high density central gas concentrations that are characteristic of ULIRGs and related classes of starburst galaxies (e.g. Solomon et al. 1997). These circumnuclear regions have sizes of kpc and internal velocities of 100 km s-1 and associated dynamical scales of only 107 yr. It should be no surprise that star formation near the centres of merging galaxies is dynamic, but given the huge gas concentrations in these regions, typically 109 M⊙, the effects of SFR fluctuations are spectacular. Given that our mass estimates for A1, A2 and B1 are comparable to within a factor of between the instantaneous and continuous star formation scenarios, our results are fairly robust with respect to the star formation history adopted.
The time to produce the stellar mass in a system if the current SFR remains constant is an useful indicator of evolutionary rates. From Table 4 we see that this scale is 107 yr for all the three nuclear condensations. Another estimate of the expected time scales for the evolution of the NGC 6240 nuclei can, in principle, be obtained by examining the mass balance of the nuclear interstellar medium,
where is the gas accretion rate into each nucleus and is the mass loss rate out of each nuclear region fueling the galactic wind. Using nucleus A1 as an example, we have 40 M⊙ yr-1 (cf. Sect. 4.1.3 and Heckman et al. 1990) and SFR 270 M⊙ yr-1. The major unknown is the accretion rate into the nucleus. We can estimate this rate by where 107 yr. Adopting a nuclear gas mass of 109 M⊙ from Tacconi et al. (1999), we then estimate 100 M⊙ yr-1.
The characteristic time scale for the starburst in nucleus A1 is then / 107 yr. The combination of high SFRs, large flow velocities, and small sizes of the relevant regions demand rapid variations in SFRs. Even if one invokes a maximal estimate of the total mass of interstellar gas in NGC 6240 of 3 1010 M⊙ (Georgakakis et al. 2000, allowing for the mass of 4He) and a short dynamical time scale of 100 Myr for the entire system, we see that the current starburst can be sustained for 100 Myr. The actual lifetime of a burst with the current SFR is probably considerably shorter under more realistic assumptions as to how much gas actually can fuel the nuclear starburst region.
4.3 Evolution of the Nuclei
4.3.1 Compact Disks and the AGN
While the two AGN in NGC 6240 and their associated star clusters appear to be simple objects at our angular resolution, kinematic studies supply a glimpse of their true complexity. Observations of the central stellar velocity field by Tecza et al. (2000) from the ground in the K-band show pronounced and organized radial velocity gradients around nuclei A1 and B1. They interpret these velocity patterns as resulting from the rotation of inclined stellar objects, such as disks or flattened bulges, and by applying this model derive dynamical masses of 109 M⊙. High angular resolution observations of emission line velocities and widths by Gerssen et al. (2003) show more complexity. Their results could arise from some combination of nuclear disks and large-scale gas flows associated with the starbursts and ongoing interaction. Disturbed large-scale flows in the gas that are largely decoupled from the nuclei are also consistent with what is seen in CO emission (Tacconi et al. 1999), H2 IR emission lines (Ohyama et al. 2000, Ohyama et al. 2003) and in HI absorption against the AGNs (Beswick et al. 2001).
Despite the complex gas kinematics seen towards A1 and B1, it is likely that both AGNs are surrounded by compact gas disks that have substantial rotational support. This model is consistent with the K-band stellar kinematics, and also with the presence of OH maser emission from B1 (Hagiwara, Diamond, & Miyoshi 2003). Nuclear maser emission in ULIRGs is thought to occur in rotating disks of dense gas with sizes of a few hundred pc, which provide the large column densities of gas at near constant velocity that are required for masers (cf. Philström et al. 2001). When other nuclear starbursts with AGNs are studied with sufficient precision, molecular gas disks with radii of 100 pc and masses 108 M⊙ are found (e.g., Mrk 231; Bryant & Scoville 1996, Arp 220; Scoville et al. 1997, NGC 4303; Colina & Arribas 1999). While such structures seem to be generic features of strong interactions involving gas-rich galaxies, it is not clear which physical properties determine their size and mass scales (e.g., Downes & Solomon 1998, Jogee et al. 2002).
4.3.2 AGN and Pre-Merger Bulge Masses
The combined total luminosity of the two AGNs in NGC 6240 is estimated by Lira et al. (2002) to be 5 1045 erg s-1, comparable to what is produced by the starburst (see also Lutz et al. 2003). We therefore assume that each nucleus produces 1012 L⊙. A lower bound estimate for the black hole masses of 107.5 M⊙ then follows from the Eddington limit argument. Assuming that most of this mass was deposited in the black holes before the present merger, we can estimate properties of the pre-merger system bulges on the basis of empirical correlations between and host galaxy bulge properties. Thus we find that the pre-merger bulge velocity dispersion would have been 150 km s-1 and the bulge B-band luminosities about 109.5 L⊙ corresponding to a stellar mass near 1010 M⊙. The presence of dual AGN in NGC 6240 is consistent with it being a major merger involving two giant spiral galaxies.
The similarity between conditions in Arp 299 and those in NGC 6240 suggests another possible evolutionary trend. NGC 6240 and Arp 299 are the only two merging systems known to contain dual AGNs. In both cases, it appears that the amount of mass going into the circumnuclear starbursts considerably exceeds that being accreted by the nuclear black holes. Since energy production from accretion onto a black hole is more than order of magnitude more efficient than what is provided by nuclear energy in stars, and the AGN and starburst luminosities are comparable in NGC 6240, we predict a black hole accretion rate of M⊙ yr-1 in nucleus A1. From our earlier discussion of the lifetime of the starburst, we take 30 Myr as a generous estimate of the main starburst lifetime. We then see that if the system continues in its present state, the black holes could grow in mass by 108 M⊙ prior to the eventual merger of the binary nuclei into a single object. Our analysis thus suggests the nucleus of the final NGC 6240 merger will have 2108 M⊙.
4.3.3 The A2 Cluster
Our photometric study demonstrates that nucleus A2 is also a huge concentration of young stars. However, it shows no evidence for being an AGN, and therefore could be an example of an extraordinarily luminous star cluster. For example, young super star clusters with similar masses are found in the centre of the Arp 220 merger, where the extraordinary N2 and N3 clusters described by Shioya, Taniguchi, & Trentham (2001) are not necessarily associated with nuclei. The fate of such clusters is somewhat uncertain. However, due to their high masses, these clusters likely will have short lifetimes driven by the dynamical friction time scale for them to spiral into the centres of their host galaxies, where they will merge with the AGNs/nuclear star clusters. This type of event can help to populate the bulge of the remnant galaxy (cf. Noguchi 1999, Kim, Morris, & Lee 1999).
4.3.4 The Fate of NGC 6240
The B1, A1 and A2 integrated masses give a mass density of about 16.0, 1.2 103 and 19.0 M⊙ pc-3, respectively, as measured in a circular aperture of radius 0′′.1, and assuming continuous star formation. For a single and instantaneous burst of star formation, the cluster mass density increases to 67.0, 1.4 103 and 80.0 M⊙ pc-3. In either scenario, these values are similar to the mass density of the molecular gas ( M⊙ pc-3) integrated over the central R kpc of most nearby ULIRGs (Sanders & Mirabel 1996), where 0.5 kpc translates into 1′′ at the distance of NGC 6240, i.e. the entire double core of NGC 6240. Evans et al. (2002) estimated the core mass density in molecular gas for a sample of ULIRGS with double nuclei and obtained values of 970 to 8.6 103 M⊙ pc-3 per nucleus. Compared with this sample, A1 is similar to IRAS 121120305SW and IRAS 143481447SW. In addition, the mass density of A1 falls in the low-mass density tail of the distribution of early-type galaxies, whose masses were measured in an aperture with a radius of 0′′.1 by Faber et al. (1997). Specifically, A1 appears to fit in with the “core” galaxies of Faber et al.’s sample. Faber et al. (1997) separate early-type galaxies into two categories: the power-law galaxies with a fairly steep surface profile in their surface brightness, extending inward to the smallest resolvable radius, and the core galaxies showing a broken power-law profile which changes to a significantly shallower slope at a specific break radius. Core galaxies are bright objects with M (H0 = 80 km s-1 Mpc-1) and are found in clusters as well as in the field.
The mass densities derived for B1, A1 and A2 suggest that, whatever the nature of the burst is, if their fate is to merge together, then B1, A1 and A2 would likely form the core of an elliptical or at least a large bulge of an early-type spiral galaxy, which NGC 6240 could evolve into, once the merger of the parent galaxies is completed. The findings of Komossa et al. (2003) support this scenario. The presence of a heavily obscured AGN in the A nucleus has long been known, but the definitive detection of an AGN in the B nucleus, hence of supermassive binary black holes, comes from the very recent Chandra ACIS-S data. According to Milosavljević & Merritt (2001) and Milosavljević et al. (2002), during a galactic merger the two black holes fall to the centre of the merger and form a bound pair. Their spiraling towards each other releases their binding energy to the surrounding stars, modifying the central stellar density of the merger. Consequently, the initial central cusp in the stellar density evolves into a shallower distribution, , similar to the luminosity profile observed at the centre of elliptical core galaxies. This evolution occurs within yr after the binary black hole has formed; the cusp continues to flatten thereafter as the binary ejects stars via gravitational kicks away from the nucleus of the merger. The process should terminate when the binary reaches a separation of between 0.01 and 1 pc.
The black holes detected in the double nucleus of NGC 6240 are about 1.5 arcsec apart (Komossa et al. 2003), which translates into 700 pc at a distance of 98 Mpc, therefore NGC 6240 may be at the beginning of the “cusp coalescence” defined by Milosavljević & Merritt (2001) and may transform into an elliptical core galaxy. This agrees with the conclusion by Genzel et al. (2001) who measured a rotational velocity and a velocity dispersion in NGC 6240 consistent with the properties of elliptical and lenticular systems.
5 Summary
We have analysed HST data available for three discrete sources identified in the double nucleus of NGC 6240. We have fitted the observed colours to STARBURST99 models to estimate their ages, masses and intrinsic reddenings. Our fitting technique (cf. Paper I) relies on observed colours corrected for the Galactic extinction in the direction of NGC 6240 and develops through five steps: i) the synthetic colours at each time mesh-point of the model are reddened by E(B-V) increasing from 0.0 to 5.0 mag in steps of 0.01 mag; ii) at each step in E(B-V), a is computed as the sum of the colour differences between observations and evolutionary tracks weighted by the observational errors and squared; iii) for each time mesh-point of the model, a minimum is extracted from all the values obtained by varying the reddening and the model age, magnitudes and colours; iv) once all the time mesh-points of the model have been fitted, the smallest () is identified among all minima and its corresponding E(B-V), model age, magnitudes and colours are assigned to the cluster concerned; v) the selected model magnitudes are reddened by the final selected E(B-V), corrected for the distance modulus to NGC 6240 and scaled to the observed apparent magnitudes. The assumed SFR is multiplied by this magnitude scaling factor to derive the actual SFR of the sources. We have made use of two sets of STARBURST99 models, computed for two different metallicities, solar- and LMC-like. The results obtained from these two sets of evolutionary tracks agree reasonably well and are within the uncertainties of our fitting procedure. Therefore, the subsequent analysis and discussion of the properties of the nuclear sources have been based on the STARBURST99 models with solar metallicity. The nuclear condensations in NGC 6240 have four independent colours available, (B-V), (V-I), (V-J) and (V-K), which allow us to determine a unique combination of age, reddening and SFR with relatively small uncertainties.
The probability distributions for the nuclear sources in NGC 6240 have been derived from the fits with 1.5 times the value of the fitting procedure. Under the assumption that these sources are clusters, they are dated as young as 4 Myr and are heavily obscured, with E(B-V) = or A in agreement with spectroscopic measurements. Their mass estimates, however, are extremely high, from 3 107 to 109 M⊙. A mass of 107 M⊙, as found for B1, has been so far determined and confirmed spectroscopically only for cluster W3 in NGC 7252, while a lower mass of a few 105 M⊙ has been estimated for the nuclear clusters in NGC 4303 and NGC 4449. On the other hand, the tidal radius of the nuclear sources in NGC 6240 is larger than measured for bona-fide compact clusters and thus this favours the earlier suggestion that these sources are giant Hii regions instead. In this case, a STARBURST99 model with continuous star formation is probably more appropriate, which results in:
1) young ages of about 4.3 106 yr and reddenings in the range 0.8 E(B-V) 2.4 mag;
2) SFRs between 1.5 (B1) and 266 (A1) M⊙ yr-1, which define integrated masses from 7 106 to 109 M⊙;
3) mass densities from 16 (B1) to 1200 (A1) M⊙ pc-3.
4) a SN rate of 1 SN yr-1 and a galactic wind of 44 M⊙ yr-1. Comparison with previously determined SN rates and galactic wind estimates based on NGC 6240’s LIR indicates that the nuclear sources dominate the galaxy’s total IR luminosity and star formation activity.
Irrespective of the scenario assumed, the properties of the nuclear sources are such to likely sustain the observed soft X-ray emission. They can also be used to estimate a mass of 1010 M⊙ for the bulge of the parent galaxies and a black-hole mass of 2 108 M⊙ for the end-product of the coalescence of the binary black hole.
Star formation rates such as those found for B1 and A2 are commonly observed in nearby blue compact galaxies such as NGC 7673 and Lyman break galaxies, while the SFR value derived for A2 is typical of warm ULIRG galaxies with double nuclei. Similarly, the mass density in A1 is consistent with the mass densities of molecular gas in ULIRGs and the stellar mass densities measured in elliptical core galaxies. The supermassive binary black holes recently discovered in NGC 6240 (Komossa et al. 2002) could in time transfer energy to the stars in A1, A2 and B1, thus lowering the central stellar density in NGC 6240 nuclei to a flat profile, typical of elliptical core galaxies (cf. Milosavljević & Merritt, 2001). The balance between the relative efficiencies of star formation, dynamical friction, and the slingshot effect of the coalescing binary black hole will ultimately determine whether the merger in NGC 6240 will produce a cusp or a core elliptical.
Acknowledgements.
It is a pleasure to thank Claus Leitherer whose valuable comments improved the paper. AP would like to thank F. van den Bosch and M. Carollo for stimulating discussions. JSG thanks the University of Wisconsin Graduate School for partial support of this research and the European Southern Observatory for its hospitality while working on this project. This paper is based on observations made with the NASA/ESA Hubble Space Telescope, obtained from the data archive at the Space Telescope Science Institute (STScI). STScI is operated by the association of Universities for Research in Astronomy, Inc. under NASA contract NAS 5-26555. This research has made extensive use of NASA’s Astrophysics Data System Abstract Service.References
- (1) Alonso-Herrero, A., Rieke, G.H., Rieke, M.J., Scoville, N.Z., 2000, ApJ, 532, 845
- (2) Anders, P., Fritze-von Alvensleben, U., 2003, A&A, 401, 1063
- (3) Ballo, L., Braito, V., Della Ceca, R., Maraschi, L., Tavecchio, F., Dadina, M., 2003, MNRAS, 335, 1176
- (4) Barbieri, C., Rafanelli, P., Schulz, H. et al. 1993, A&A, 273, 1
- (5) Berta, S., Fritz, J., Franceschini, A., Bressan, A., Pernechele, C., 2003, A&A, 403, 119
- (6) Beswick, R.J., Pedlar, A., Mundell, C.G., Gallimore, J.F., 2001, MNRAS, 325, 151
- (7) Böker, T., van der Marel, R.P., Mazzuca, L., Rix, H.-W., Rudnick, G., Ho, L.C., Shields, J.C., 2001, AJ, 121, 1473
- (8) Böker, T., Laine, S., van der Marel, R.P., Sarzi, M., Rix, H.-W., Ho, L.C., Shields, J.C.,, 2002, AJ, 123, 1389
- (9) Bryant, P.M., Scoville, N.Z., 1999, AJ, 117, 2632
- (10) Bushouse, H.A., Borne, K.D., Colina, L., Lucas, R.A., Rowan-Robinson, M., Baker, A.C., Clements, D.L., Lawrence, A., Oliver, S., 2002, ApJS, 138, 1
- (11) Calzetti, D., 2001, PASP, 113, 1449
- (12) Carollo, C.M., Stiavelli, M., de Zeeuw, P.T., Mack, J., 1997, AJ, 114, 2366
- (13) Carollo, C.M., Stiavelli, M., de Zeeuw, P.T., Seigar, M., Dejonghe, H., 2001, ApJ, 546, 216
- (14) Cerviño, M., Valls-Gabaud, D., Luridiana, V., Mas-Hesse, J.M., 2002, A&A, 381, 51
- (15) Cohen, J.G., Freeman, K.C., 1991, AJ, 101, 483
- (16) Colbert E.J.M., Wilson A.S., Bland-Hawthorn J., 1994, ApJ, 436, 89
- (17) Colina, L., Arribas, S. 1999, ApJ, 514, 637
- (18) Colina, L., González Delgado, R., Mas-Hesse, J.M., Leitherer, C., 2002, ApJ, 579, 545
- (19) Cui, J., Xia, X.-Y., Deng, Z.-G., Mao, S., Zou, Z.-L., 2001, AJ, 122, 63
- (20) de Grijs, R., Bastian, N., Lamers, H.J.G.L.M., 2003a, ApJ, 583, L17
- (21) de Grijs, R., Anders, P., Bastian, N., Lynds, R., Lamers, H.J.G.L.M., O’Neil Jr., E.J., 2003b, MNRAS, 343, 1285
- (22) de Grijs, R., O’Connell, R.W., Gallagher, J.S., 2001, AJ, 121, 768
- (23) DePoy D.L., Becklin E.E., Wynn-Williams C.G., 1986, ApJ, 307, 116
- (24) Djorgovski, S.G., 1993, in Structure and Dynamics of Globular Clusters, eds. S.G. Djorgovski & G. Meylan (San Francisco: ASP), p. 373
- (25) Dowens, D., Solomon, P.M., 1998, ApJ, 507, 615
- (26) Evans, A.S., Frayer, D.T., Surace, J.A., Sanders, D.B., 2001, AJ, 121, 3286
- (27) Evans, A.S., Mazzarella, J.M., Surace, J.A., Sanders, D.B., 2002, ApJ, 580, 749
- (28) Faber, S.M., Tremaine, S., Ajhar, E.A., Byun, Y.-I., Dressler, A., Gebhardt, K., Grillmair, K., Kormendy, J., Lauer, T.R., Richstone, D., 1997, AJ, 114, 1771
- (29) Farrah, D., Rowan-Robinson, M., Oliver, S., Serjeant, S., Borne, K., Lawrence, A., Lucas, R.A., Bushouse, H., Colina, L., 2001, MNRAS, 326, 1333
- (30) Fosbury R.A.E., Wall J.V., 1979, MNRAS, 189, 79
- (31) Fritze-von Alvensleben, U., 1998, A&A, 336, 83
- (32) Fritze-von Alvensleben, U., 1999, A&A, 342, L25
- (33) Georgakakis, A., Forbes, D.A., Norris, R.P., 2000, MNRAS, 318, 124
- (34) Genzel, R., Lutz, D., Sturm, E., et al., 1998, ApJ, 498, 579
- (35) Genzel, R., Tacconi, L.J., Rigopoulou, D., Lutz, D., Tecza, M., 2001, ApJ, 563, 527
- (36) Gerssen, J., van der Marel, R. P., Axon, D. J., Mihos, C., Hernquist, L., & Barnes, J. E. 2001, in The Central Kiloparsec of Starbursts and AGN: The La Palma Connection, ASP Conference Proceedings Vol. 249. eds. J. H. Knapen, J. E. Beckman, I. Shlosman, & T. J. Mahoney, p. 665 (San Francisco: Astronomical Society of the Pacific)
- (37) Gerssen, J., van der Marel, R.P., Axon, D., Mihos, C., Hernquist, L., Barnes, J., 2003, AJ, submitted (astro-ph/0310029)
- (38) González Delgado, R.M., Heckman, T., Leitherer, C., 2001, ApJ, 546, 845
- (39) González Delgado, R.M., Heckman, T., Leitherer, C., Meurer, G., Krolik, J., Wilson, A.S., Kinney, A., Koratkar, A., 1998, ApJ, 505, 174
- (40) Goudfrooij, P., Victoria Alonso, M., Maraston, C., Minniti, D., 2001, MNRAS, 328, 237
- (41) Grillmair, C.J., Ajhar, E.A., Faber, S.M., Baum, W.A., Holtzman, J.A., Lauer, T.R., Lynds, C.R., O’Neil Jr., E.J., 1996, AJ, 111, 2293
- (42) Hagiwara, Y., Diamond, P.J., Miyoshi, M., 2003, A&A, 400, 457
- (43) Heckman, M.T., Armus, L., Miley, G.K., 1987, AJ, 92, 276
- (44) Heckman, M.T., Armus, L., Miley, G.K., 1990, ApJS, 74, 833
- (45) Heckman, M.T., Dahlem, M., Eales, S.A., Fabbiano, G., Weaver, K., 1996, ApJ, 457, 616
- (46) Holtzman, J.A., Burrows, C.J., Casertano, S., Hester, J.J., Trauger, J.T., Watson, A.M., Worthey, G., 1995, PASP, 107, 1065
- (47) Iwasawa, K., Comastri, A., 1998, MNRAS, 297, 1219
- (48) Jogee, S., Baker, A. J., Sakamoto, K., Scoville, N. Z., Kenney, J. D. P. 2001 in The Central kpc of Starbursts and AGN, ASP Conf. Ser., Vol. 249, eds. J. H. Knapen, J. E. Beckman, I. Shlosman, T. J. Mahoney, p. 612
- (49) Kim, S. S., Morris, M., Lee, H. M., 1999, ApJ, 525, 228
- (50) Komossa, St., Burwitz, V., Hasinger, G., Predehl, P., Kaastra, J.S., Ikebe, Y., 2003, ApJ, 582, L15
- (51) Kormendy, J., Richstone, D., 1995, ARA&A, 33, 581
- (52) Lançon, A., Mouhcine, M., 2000, in Massive Stellar Clusters, ASP Conf. er. 211, eds. A. Lançon & . M. Boily, p. 34
- (53) Leitherer, C., Schaerer, D., Goldader, J.D., et al., 1999, ApJS, 123, 3
- (54) Lira, P., Ward, M.J., Zezas, A., Murray, S.S., 2002, MNRAS, 333, 709
- (55) Lutz, D., Sturn, E., Genzel, R., Spoon, H.W.W., Moorwood, A.F.M., Netzer, H., Sternberg, A., 2003, A&A, 409, 867
- (56) Mac Low, M.-M., McCray, R., 1988, ApJ, 324, 776
- (57) Maraston, C., Kissler-Patig, M., Brodie, J.P., Barmby, P., Huchra, J.P., 2001, A&A, 370, 176
- (58) Marconi, A., Hunt, L.K., 2003, ApJ, 589, L21
- (59) Meurer, G.R., 1995, Nature, 375, 742
- (60) McCall, M.L., Rybski, P.M., Shileds, G.A., 1985, ApJS, 57, 1
- (61) Milosavljević, M., Merritt, D., 2001, ApJ, 563, 34
- (62) Milosavljević, M., Merritt, D., Rest, A., van den Bosch, F.C., 2002, MNRAS, 331, L51
- (63) Neugebauer, G., Soifer, B.T., Beichman, C.A., Aumann, H.H., Chester, T.J., Gautier, T.N., Lonsdale, C.J., Gillett, F.C., Hauser, M.G., Houck, J.R., 1984, Science, 224, 14
- (64) Noguchi, M. 1999, ApJ, 514, 77
- (65) Ohyama Y., et al., 2000, PASJ, 52, 563
- (66) Ohyama, Y., Yoshida, M., Takata, T. 2003, AJ, in press (astro-ph/0307517)
- (67) Pasquali, A., de Grijs, R., Gallagher, J.S., 2003, MNRAS, 345, 161 (Paper I)
- (68) Pettini, M., Shapley, A.E., Steidel, C.C., Cuby, J.-G., Dickinson, M., Moorwood, A.F.M., Adelberger, K.L., Giavalisco, M., 2001, ApJ, 554, 981
- (69) Philström, Y. M., Conway, J. E., Booth, R. S., Diamond, P. J., Polatidis, A G. 2001, A&A, 377, 413
- (70) Pisano, D., Kobulnicky, H., Guzmán, R., Gallago, J., Bershady, M., 2001, AJ, 122, 1194
- (71) Rafanelli, P., Schulz, H., Barbieri, C., Komossa, S., Mebold, U., Baruffolo, A., Radovich, M., 1997, A&A, 327, 901
- (72) Rieke, G.H., Cutri, R.M., Black, J.H., Kailey, W.F., McAlaray, C.W., Lebofsky, M.J., Elston, R., 1985, ApJ, 290, 116
- (73) Sanders, D.B., 2001, IAU Coll. 184, eds. R.F. Green, E.Ye. Khachikian & D.B. Sanders
- (74) Sanders, D.B., Mirabel, I.F., 1996, ARA&A, 34, 749
- (75) Schinnerer, E., Eckart, A., Tacconi, L.J., 2001, ApJ, 549, 254
- (76) Schlegel, D.J., Finkbeiner, D.P., Marc, D., 1998, ApJ, 500, 525
- (77) Schulz, H., Komossa, S., Berghöfer, T.W., Boer, B., 1998, A&A, 330, 823
- (78) Schweizer, F., Seitzer, P., 1998, AJ, 116, 2206
- (79) Scoville, N.Z., Evans, A.S., Thompson, R., Rieke M., Hines, D.C., Low, F.J., Dinshaw, N., Surace, J.A., Armus, L., 2000, AJ, 119, 991
- (80) Simpson, C., Forbes, D.A., Baker, A.C., Ward, M.J., 1996, MNRAS, 189, 7904
- (81) Shioya, Y., Taniguchi, Y., Trentham, N., 2001, MNRAS, 321, 11
- (82) Soifer, B.T., Neugebauer, G., Helou, G., Lonsdale, C.J., Hacking, P., Rice, W., Houck, J.R., Low, F.J., Rowan-Robinson, M., 1984, ApJ, 283, L1
- (83) Solomon, P.M., Dowens, D., Radford, S.J.E., Barrett, J.W., 1997, ApJ, 478, 144
- (84) Surace, J.A., Sanders, D.B., Evans, A.S., 2000, ApJ, 529, 170
- (85) Surace, J.A., Sanders, D.B., Vacca, W.D., Veilleux, S., Mazzarella, J.M., 1998, ApJ, 492, 116
- (86) Tacconi, L.J., Genzel, R., Tecza, M., Gallimore, J.F., Downes, D., Scoville N.Z., 1999, ApJ, 524, 732
- (87) Tecza, M., Genzel, R., Tacconi, L.J., Anders, S., Tacconi-Garman, L.E., Thatte, N., 2000, ApJ, 537, 178
- (88) Toomre, A., 1977, in The Evolution of Galaxies and Stellar Populations, eds. B. Tinsley & R. Larson (New Haven: Yale Univ. Press), p. 401
- (89) Veilleux, S., Kim, D.-C., Sanders, D.B., 1999, ApJ, 522, 113
- (90) Veilleux, S., Kim, D.-C., Sanders, D.B., Mazzarella, J.M., Soifer, B.T., 1995, ApJS, 98, 171
- (91) Vignati, P. et al., 1999, A&A, 349, L57
- (92) van der Werf, P.P., Genzel, R., Krabbe, A. et al., 1993, ApJ, 405, 522
- (93) Whitmore, B.C., Heyer, I., 1998, ISR WFPC2 97-08
- (94) Whitmore, B.C., Schweizer, F., Leitherer, C., Borne, K., Robert, C., 1993, AJ, 106, 1354
- (95) Whitmore, B.C., Zhang, Q., Leitherer, C., Fall, M.S., Schweizer, F., Miller, B.W., 1999, AJ, 118, 1551
- (96) Wright, G.S., Joseph, R.D., Meikle, W.P.S., 1984, Nature, 309, 430
- (97) Zepf, S.E., Ashman, K.M., 1993, MNRAS, 264, 611
- (98) Zwicky, F., Herzog, E., Wild, P., 1961, Catalogue of Galaxies and of Clusters of Galaxies (Pasadena: Caltech), vol. 1