Parameter study of the diamagnetic relativistic pulse accelerator (DRPA) in slab geometry I: Dependence on initial frequency ratio and slab width
Abstract
Two-and-a-half-dimensional particle-in-cell plasma simulations are used to study the particle energization in expanding magnetized electron-positron plasmas with slab geometry. When the magnetized relativistic plasma with high temperature (initial electron and positron temperature are ) is expanding into a vacuum, the electromagnetic (EM) pulse with large amplitude is formed and the surface plasma particles are efficiently accelerated in the forward direction owing to the energy conversion from the EM field to the plasma particles. We find that the behavior of the DRPA (Diamagnetic Relativistic Pulse Accelerator) depends strongly on the ratio of the electron plasma frequency to the cyclotron frequency and the initial plasma thickness. In the high case, the EM pulse is rapidly damped and the plasma diffuses uniformly without forming density peaks because the initial thermal energy of the plasma is much larger than the field energy. On the contrary, in the low case, the field energy becomes large enough to energize all the plasma particles, which are confined in the EM pulse and efficiently accelerated to ultrarelativistic energies. We also find that a thicker initial plasma increases the maximum energy of the accelerated particles.
I Introduction
In astrophysical, solar and space plasmas, the acceleration of high energy particles is an intriguing and unsolved problem. Magnetic reconnection, wave turbulence and collisionless shocks are often invoked for the acceleration of plasma particles, from cosmic rays, solar flares to gamma-ray burstspira00 and astrophysical jets.
A new mechanism of particle energization by freely expanding, hot, strongly magnetized collisionless plasmas was recently discovered by Liang et al. using two-and-a-half dimensional (2-1/2D) particle-in-cell (PIC) simulations lian03 . This mechanism, called the diamagnetic relativistic pulse accelerator (DRPA), is able to convert most of the initial magnetic energy into the ultra-relativistic directed kinetic energy of a small fraction of the surface particles. Moreover, Liang and Nishimuralian032 have found that the late-time plasma pulse of the DRPA reproduces many unique features of cosmic gamma-ray bursts. Hence the DRPA may shed important new light on the unsolved problem of gamma-ray bursts. When a hot, strongly magnetized (=thermal pressure/plasma pressure ) collisionless plasma expands into a vacuum or low-density surrounding, an electromagnetic pulse is formed at the expansion surface, which traps and accelerates a small fraction of surface particles via the pondermotive forcelian03 ; mill59 , and the magnetic energy is efficiently converted into directed particle energy .
In our previous Letterslian03 ; nish03 , the DRPA was studied by performing 2-1/2D PIC simulations for both electron-positron (mass ratio is ) and electron-ion () plasmas with a specific set of initial parameters, and only carried out to 1000 (where is the electron cyclotron frequency defined by the initial magnetic field). In this paper, we will study the parameter dependence and the long-term evolution of the DRPA of electron-positron plasmas by means of a series of large-scale PIC simulations.
The outline of this paper is as follows. Section II describes the simulation model and the simulation parameters. The benchmark results of Liang et al.lian03 are reviewed and summarized in Section III.1 for comparison with other cases. The long-term evolution of the DRPA is described in Sec. III.2. The initial parameter dependence of DRPA is discussed in Secs. III.3 and III.4. Section IV gives a summary of our results.
II Simulation model
In our particle simulation codenish02 , we use a 2-1/2D explicit simulation scheme based on the PIC method for time advancing of plasma particles. In this method, spatial grids are introduced to calculate the field quantities, and the grid separations are uniform, , where is the electron Debye length defined by ( is the speed of light and the electron plasma frequency is ; is elementary charge, is the initial electron density, and is the dielectric constant of vacuum). In our simulations, the thermal speed of electrons is almost equal to because the plasma temperature is , where the subscripts and refer to electrons and positrons. The simulation domain on the plane is and .
We treat plasma particles as superparticles, with 20 superparticles per cell (if the superparticles are spread uniformly on the entire simulation domain) for each component (electrons and positrons). Most of the particle densities, however, concentrate on the expanding surface in our study and we are mainly interested in particle behaviors near the surface. Thus, this number of superparticles is enough to accurately resolve the physics of surface particle acceleration. To prevent large violations of Gauss’s law due to numerical noises, the Marder’s method for the electric field correctionmard87 is adopted at every time step in the code.
We use a doubly periodic system in and directions, and the system length is (Run A), (Run B), (Run C), and (run D) and (for all four Runs). Initially, the electron and positron distributions are assumed to be relativistic Maxwellian with spatially uniform temperature, . The spatial distribution of initial plasmas is assumed to be a uniform slab with the lengths ,(runs A,B,C) and (run D) and the plasmas are located in the center of the system. The background magnetic field initially exists only inside the plasma.
We will first compare three simulation results by changing the frequency ratio . The values are (Run A), 1.0 (Run B), and 0.01 (Run C). At the end we will also discuss the result of changing the initial slab thickness (Run D).
III Results
III.1 Diamagnetic relativistic pulse accelerator
First, we illustrate the mechanism of the diamagnetic relativistic pulse accelerator (DRPA) by reviewing the early () results of the benchmark Run A (Liang et al., 2003lian03 ). In Run A, the magnetic field energy is initially almost equal to the thermal energy of plasma particles, i.e., electron and positron beta is (, where is the magnetic permeability of vacuum).
In Figure 1(a), the system-integrated energies of the magnetic field (line 1), electric field (line 2), electrons (line 3), and positrons (line 4) are shown as functions of time. The initial static magnetic field rapidly transforms into two oppositely propagating electromagnetic pulses, which propagate towards the vacuum region. The plasma simultaneously begins to expand.
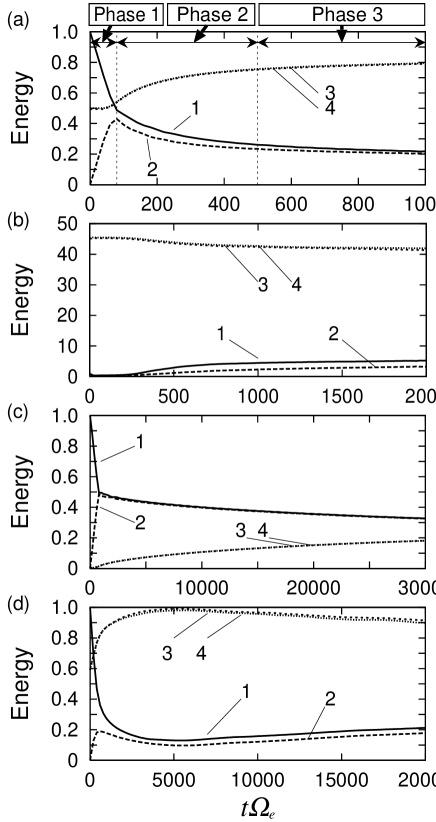
We see the rapid decrease of the magnetic energy and the increase of the electric field energy due to the generation of the electromagnetic (EM) pulse during the period shown as Phase 1 in Fig. 1(a). In Phase 2, both the magnetic and electric field energies begin to decrease and they are converted into the electron and positron kinetic energies. Also, the EM pulse with the amplitude is formed at the expansion surface during this period. In Phase 3, the energy conversion from the field energies to the particle kinetic energies still continues although the conversion rate becomes slower compared with that in Phase 2.
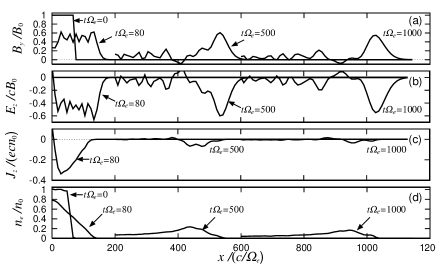
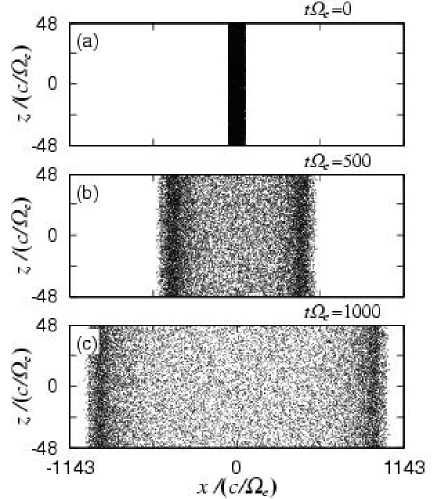
Figure 2 illustrates the spatial profiles of the (a) magnetic field , (b) electric field , (c) current density , and (d) electron density at , 80, 500, and 1000 for Run A. The magnetic field and the electron density for are identical, on the other hand, the electric field and the current density become antisymmetric about . The values of and are zero at . Only the profiles near the expansion surface are drawn at and 1000 to avoid making the figure cluttery. At , the EM pulse is formed and begin to expand with plasmas into the vacuum. The gradient drift in the z-direction induces a current density. At , the EM pulse has been formed at the expansion surface. Most of the plasma particles follow the EM pulse propagation and the plasma density has a peak corresponding to particles trapped by the pondermotive force of the pulse. The amplitude of the EM pulse is gradually damped as EM energy is transformed into particle energy.
The configuration of electrons is plotted at three different times in Figure 3. The electron-positron slab with the internal magnetic field expands rapidly into the vacuum region. The behavior of positrons is identical with that of electrons. The expansion speed of the plasma surface in the direction is almost the speed of light, . Several simulation studies of non-relativistic plasma expansion across an initially uniform magnetic field have been carried outsydo83 ; wins88 ; sgro89 ; gisl89 , and the lower hybrid drift instability has been found to deform the structure of the expanding plasma surface. As shown in Fig. 3, there appears no instability at the plasma surface in our result. There are two main differences between our simulation and the previous studiessydo83 ; wins88 ; sgro89 ; gisl89 : (a) in their studies, an initial magnetic field exists uniformly all over the simulation plane and the plasma expands (or diffuses) across the field, (b) the electron-ion plasma was considered in their studies. Thus, the charge separation due to the large mass ratio causes the different drift speed between electrons and ions, which makes the lower hybrid drift wave unstable. These differences may explain the absence of instability in our simulation. In addition, the effective Larmor radius of relativistic plasmas given by is larger than our system length in the direction at late times. Thus, any effect of the Larmor radius play no important role in our simulations, and we cannot see any effect caused by the Larmor motion of relativistic plasmas.
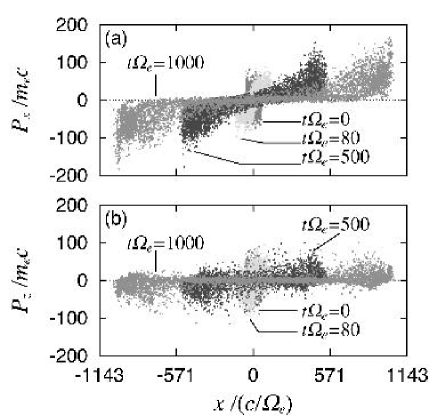
Figure 4 shows phase plots of electrons at four different times in the space (a) and (b) for Run A. It is found that most of the electron population moves to the expansion surface and the momentum of the surface electrons increases as time elapses. The averaged momentum reaches and the maximum momentum of energetic particles reaches at . On the other hand, the momentum indicates no dramatic increase even at late times. This means that the plasma particles are effectively accelerated into the direction rather than the direction.
III.2 Long-term evolution of the DRPA
Let us focus on the long-term evolution of the DRPA in Run A. Figure 5 shows the spatial profiles of the (a) magnetic field , (b) electric field , (c) current density , (d) electron density , and (e) the phase plots of electrons for Run A at , 10000, 14000, and 18000.
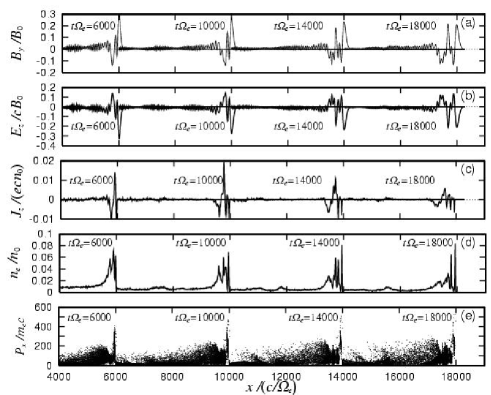
Only the portion near the expansion front at each time has been displayed in each panel. In Figs. 5(a) and 5(b), the wave packet is dispersively spreading and the EM pulse amplitude gradually decreases as time elapses. The reduction of the pulse amplitude corresponds to the conversion of the EM energy into the kinetic energy of the expanding plasma. In Fig. 5(e), we recognize the electron momentum near the first pulse of the wave packet dramatically increases as time goes on. The maximum value of reaches more than at .
Another significant feature of the late time behavior in Run A is the bifurcation of plasma density. In the initial phase of the DRPA, the electron density near the wave packet has only one peak as shown in Fig. 2(d). At late times in Fig. 5(d), the peak has been split into several peaks. The bifurcation of the plasma density profile results from the development of new transverse current and reverse currents behind the front, which forms new traps for particles in the pondermotive potential.
Figure 6(a) shows the momentum distributions of electrons which are located in the vicinity of the EM pulse at , 6000, and 10000. The momentum peak at which the distribution takes a maximum value tends to increase as time elapses, i.e., at , at , and at in Fig. 6(a). Also in Figure 7(a), the temporal evolution of this momentum is shown until for Run A. This temporal increment of the momentum verifies that the average electon near the pulse is gradually accelerated. In addition, we can see in Fig. 6(a) that the tail part of the distribution develops into a quasi-power-law. At , a second peak of the distribution appears at a high value , which is consisted of non-thermal electrons. In short, some of the surface electrons is more accelerated than other surface electrons. This multi-peak structure of the momentum distribution may be related to the bifurcation of the electron density shown in Fig. 5(d).


III.3 Frequency ratio dependence of the DRPA
In the previous sections, we summarize the results of Run A (with the frequency ratio ). Next, we examine the frequency ratio dependence of the DRPA. The frequency ratios discussed here are (Run B) and (Run C). Other fundamental simulation parameters are exactly same as those of Run A.
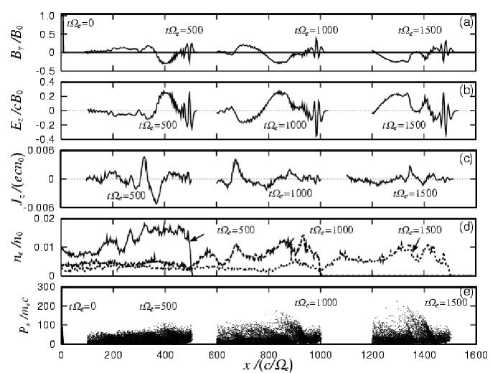
Figure 8 displays the spatial profiles of the same quantities shown in Fig. 2, in the case of Run B, at different times. Figs. 8(a), (b), (c), and (e) mainly show the region near the EM pulse at each time, and the values of and are zero at . The electron density at is not shown in Fig. 8(d) since the initial density is much larger than the values at the other three times. Compared with the results of Run A, no apparent EM pulse with large amplitudes can be formed at the expansion surface in Figs. 8(a) and 8(b). In Fig. 8(d), we find that the electrons are distributed in a broad region, rather than confined in the EM pulse. We see no sign of bifurcation of the density pulse like in Run A. In Run B, initially the thermal energy of plasma particles is much larger than the magnetic field energy because of . Temporal evolution of each energy component is shown in Fig. 1(b). In Run A, the field energy is converted into the kinetic energy of surface particles by the DRPA, thus the total field energy decreases as time elapses. In Run B, however, the field energy continues to increase as shown in Fig. 1(b). This increase of the EM field energy is mainly caused by the field fluctuation in the regions away from the expansion surface.

We focus on the amplitude of the propagating magnetic field formed at the expansion surface. Temporal evolution of the peak value of the magnetic field pulse is shown in Figure 9(a). As for Run A, the peak value dramatically decreases during (this period corresponds to Phase 1 in Fig. 1) and then continues to decrease at a constant damping rate (this period corresponds to Phases 2 and 3 in Fig. 1). We can see the similar tendency in the temporal evolution of the peak value for Run B during , but the damping rate of the peak value is much larger than that of Run A. At , the peak value becomes . This means that the magnetic field energy in Run B is dissipated much faster than that in Run A. Although the magnetic field energy is rapidly converted into particle energy, the total kinetic energy of Run B hardly changes since the initial plasma beta is very high. Therefore, the evolution can be described as the free-expansion of the plasma rather than the expansion accompanied by the acceleration of the EM pulse. The electron momentum peak of Run B, at which the momentum distribution takes a maximum, is shown as a function of time in Fig. 7(b). The momentum remains around even when the amplitude of the magnetic field pulse becomes at because the converted magnetic field energy is too small to accelerate all the plasma particles via the DRPA. Thus, the electrons at late times exhibit almost uniform distribution by the free-expansion and the density pulse is not formed in Run B, as shown in Fig. 8(d). We see the evolution of the electron momentum distribution for Run B in Fig. 6(b). The distribution keeps a Maxwellian form even at late times. This means that the plasma is consisted almost only of the thermal component.
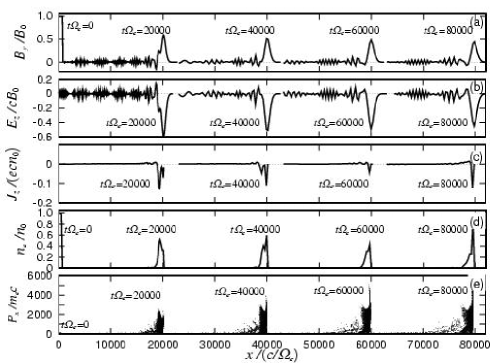
Figure 10 shows the results of Run C ( and ). In this run the initial magnetic field energy is much greater than the thermal energy of plasma particles. The converted energy of the EM pulse can be effectively used for the particle acceleration [see Fig. 1(c)]. In Fig. 10(d), most of the electrons has been accelerated owing to the EM pulse and the electron density is much more concentrated at the expanding surface. Temporal evolution of the maximum amplitude of the pulse magnetic field in Run C is also plotted in Fig. 9(a). The period during represents an initial relaxation phase in Run C, which corresponds to Phase 1 in Fig. 1(a) of Run A. After that, the peak value stays almost constant, . For comparison, the result of a vacuum EM pulse without plasma is shown in Fig. 9(a). In this run without plasma, we set up the initial magnetic field to be for and for , and the electric field is initially zero everywhere. The EM pulse generated by the spatial gradient of the initial magnetic field propagates according to the wave equation in a vacuum. It is found that the amplitude of the EM wave is almost unchanged after the initial relaxation phase () in Fig. 9(a). The EM pulse in Run C is very similar to the pulse without plasma since the initial plasma beta is small, , and only a small portion of the total magnetic field energy is converted into the plasma kinetic energy.
The evolution of the electron momentum distribution for Run C is shown in Fig. 6(c). Since most of electrons are accelerated by the DRPA, the tail part of the distribution exhibits a power-law with sharp slope. In Fig. 7(c), the peak momentum of the surface electrons increases rapidly as time elapses, compared to Runs A and B with higher frequency ratios. The average momentum of electrons reaches at .
III.4 Dependence on the initial plasma width
In this section, we examine how the width of the initial plasma can affect the DRPA. The widths of the density pulse of expanding plasmas tend to scale with the width of the initial plasma, as we expect from causality. The propagating EM pulses have the same tendency since the initial magnetic field has the same width as the plasma density. We have carried out Run D, in which the frequency ratio is and the initial width of plasma is five times that of Run A.
The temporal evolution of each energy is shown in Fig. 1(d). The apparent energy conversion from field energies into particle energies due to the DRPA can be seen until , which is similar to the evolution in Fig. 1(a). After that time, the total EM energy slightly increases and the total particle energies tends to decrease. These slight energy changes against the DRPA is caused by the local energy changes in the regions away from the expansion surface. In those regions, the particle acceleration due to the DRPA hardly works efficiently. Even though the total particle energies slightly decreases, we will show that the plasmas near the propagating EM pulse continue to be energized after .
The electron momentum distributions for Run D are displayed in Fig. 6(d) at three different times. As time elapses, the average momentum of surface electrons increases, and we recognize a lot of peaks in the high momentum part at . As we will show later in Figure 11, these peaks correspond to a repeated bifurcation of electron density at the expansion surface. In Fig. 7(a), the results of Run D are also plotted. There is no big difference between the peak electron momenta of Runs A and D, except in D the acceleration seems more delayed due to the prolific early bifurcations. However the maximum energy achieved by the most energetic particles is higher in D than in A. This is likely caused by the larger coherence length for acceleration in D due to the wider EM pulse.
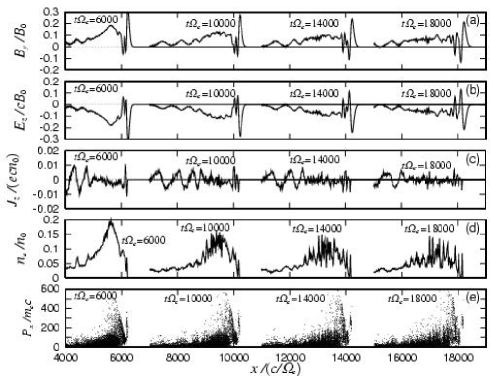
Fig. 11 shows the spatial profiles of the (a) magnetic field and (b) electron density , and (c) the phase plots of electrons for Run D at , 10000, 14000, and 18000. Only the portion near the expansion surface at each time has been displayed in each panel. Compared with the electron density of Run A in Fig. 5(b), the width of the density of the expanding electrons becomes larger, e.g., at in Fig. 11(b). We also recognize many more bifurcations of the electron density at late times.
IV Summary
We have used two-and-a-half-dimensional large-scale particle-in-cell plasma simulations to investigate the particle energization of expanding relativistic electron-positron plasmas. When magnetized plasmas with high temperature expand into a vacuum, the particles at the expansion surface are accelerated in the expansion direction. This energization mechanism is called DRPA (diamagnetic relativistic pulse accelerator)lian03 .
In this paper, we mainly discuss the long-term evolution and the initial parameter dependences of DRPA. In the case of the electron-positron plasma with the frequency ratio and the temperature , an electromagnetic (EM) pulse with large amplitude is generated and propagates into a vacuum. The plasma particles are trapped and accelerated by the pondermotive force. As time elapses, since the magnetic field energy is converted into the kinetic energy of the particles, the amplitude of the EM pulse is decreased and the particles near the expansion surface are energized. The expanding plasma density is concentrated on the vicinity of the expansion surface at the early phase of the expansion. And at the late phase, we observe the bifurcation of plasma density due to the formation of new transverse currents.
The properties of DRPA strongly depend on the frequency ratio . In the case of a high frequency ratio (), the EM pulse is rapidly damped and the plasma is expanding freely with little acceleration since the energy of the plasma is much larger than the magnetic energy. On the other hand, in the case of a low frequency ratio (), the magnetic energy is much higher than the plasma thermal energy. Most of the expanding plasma is trapped by the EM pulse and the plasma is efficiently energized at late times, achieving higher Lorentz factors than in the other cases.
In addition to the frequency ratio, we have studied the effect of varying the initial width of the plasma slab. As expected, the width of the asymptotic EM pulse tends to be proportional to the initial width of the plasma slab. Both the EM pulse and the plasma density are broadened, and the density pulse develops many more peaks at late times due to prolific bifurcations. We also find that the maximum energy of the accelerated particles is higher in this case due to the longer pulse length.
Finally, we note the system length in the direction in our two-dimensional simulation domain. As we mentioned in Sec. III.1, the effective Larmor radius of relativistic electron-positron plasmas becomes comparable or larger than at late times. Thus, the present system length will be insufficient to fully cover the physical phenomena scaled by the Larmor radius if there exist some instabilities which can develop along on that scale. However, to our knowledge, previously observed instabilities in non-relativistic simulationssydo83 ; wins88 ; sgro89 , such as the lower hybrid drift instability, do not grow in our electron-positron relativistic plasmas. Future advanced simulations will be able to give the clear answer to this problem through further simulation studies with larger system lengths.
Acknowledgements.
The work of K.N. was performed under the auspices of the U. S. DOE and was supported by the DOE Office of Basic Energy Sciences, Division of Engineering and Geosciences, the LDRD Program at Los Alamos, and the Sun-Earth Connections Theory Program of NASA. E.L. was partially supported by NASA grant NAG5-7980 and LLNL contract B510243.References
- (1) T. Piran, Phys. Reports 333, 529 (2000).
- (2) E. Liang, K. Nishimura, H. Li, and S. P. Gary, Phys. Rev. Lett. 90, 085001 (2003).
- (3) E. Liang and K. Nishimura, (to appear in Phys. Rev. Lett., 2003).
- (4) M. A. Miller, Radio Phys. 2, 438 (1959).
- (5) K. Nishimura, E. Liang, and S. P. Gary, (to appear in Phys. Plasmas, 2003), astro-ph/0307456.
- (6) K. Nishimura, S. P. Gary, and H. Li, J. Geophys. Res. 107, 1375, doi:10.1029/2002JA009250 (2002).
- (7) B. Marder, J. Comp. Phys. 68, 48 (1987); D. E. Nielsen and A. T. Drobot, ibid. 89, 31 (1990); A. B. Langdon, Comp. Phys. Comm. 70, 447 (1992).
- (8) R. D. Sydora, J. S. Wagner, L. C. Lee, E. M. Wescott, and T. Tajima, Phys. Fluids 26, 2986 (1983).
- (9) D. Winske, J. Geophys. Res. 93, 2539 (1988).
- (10) A. G. Sgro, S. P. Gary, and D. S. Lemons, Phys. Fluids B1, 1890 (1989).
- (11) G. Gisler, IEEE Trans. Plasma Sci. 17, 210 (1989).