Chandra Observation of the Edge-on Galaxy NGC 3556 (M 108):
Violent Galactic Disk-halo Interaction Revealed
Abstract
We present a 60 ks Chandra ACIS-S observation of the isolated edge-on spiral NGC 3556, together with a multiwavelength analysis of various discrete X-ray sources and diffuse X-ray features. Among 33 discrete X-ray sources detected within the mag arcsec-2 isophote ellipse of the galaxy, we identify a candidate for the galactic nucleus, an ultraluminous X-ray source that might be an accreting intermediate-mass black hole, a possible X-ray binary with a radio counterpart, and two radio-bright giant HII regions. We detect large amounts of extraplanar diffuse X-ray emission, which extends about 10 kpc radially in the disk and kpc away from the galactic plane. The diffuse X-ray emission exhibits significant substructures, possibly representing various blown-out superbubbles or chimneys of hot gas heated in massive star forming regions. This X-ray-emitting gas has temperatures in the range of K and has a total cooling rate of . The energy can be easily supplied by supernova blast-waves in the galaxy. These results demonstrate NGC 3556 as being a galaxy undergoing vigorous disk-halo interaction. The halo in NGC 3556 is considerably less extended, however, than that of NGC 4631, in spite of many similarities between the two galaxies. This may be due to the fact that NGC 3556 is isolated whereas NGC 4631 is interacting. Thus NGC 3556 presents a more pristine environment for studying the disk-halo interaction.
1 Introduction
The galactic disk-halo interaction is believed to play an essential role in the evolution of galaxies. The best way to investigate the interaction is to observe nearby edge-on disk galaxies, especially those “normal” ones, in which activity is not dominated by galactic nuclear regions. X-ray observations, in particular, are essential to the study of high-energy phenomena and processes that are likely responsible for much of the disk-halo interaction. The Chandra X-ray Observatory with its arcsecond resolution provides a uniquely effective tool to trace massive star end-products, both stellar and interstellar (neutron stars, black holes, and the hot interstellar medium) and allows for a clean separation of point-like X-ray sources from diffuse emission, a step critical for reliably determining both the content and the physical state of diffuse hot gas.
The Chandra observation of the nearby edge-on spiral NGC 4631 (type Sd) provided the first unambiguous evidence for a hot gaseous galactic corona around that galaxy (Wang et al. 2001). The overall X-ray emission from the galaxy morphologically resembles the well-known radio halo of the galaxy (e.g., as seen at 1.49 GHz; Hummel, Beck, & Dahlem 1991; Wang et al. 1995), indicating a possible close link between outflows of hot gas and cosmic ray/magnetic field from the galactic disk. However, NGC 4631 may not be a “typical” normal disk galaxy because of its interaction with companions, as manifested by the galaxy’s extended HI tidal tails. This interaction could have triggered the current high level of star formation as well as the outflows of the galaxy. It is difficult to determine by studying NGC 4631 alone the relative importance of the external interaction and internal activity in producing the radio/X-ray-emitting halo.
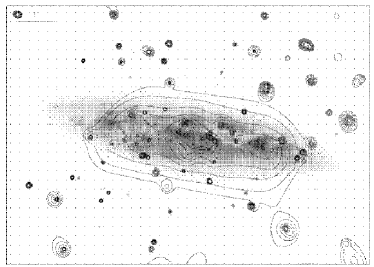
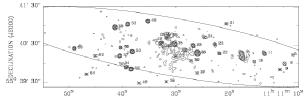
Here we present our Chandra observation of NGC 3556 (M108; Table 1) — an isolated edge-on galaxy, which shows strong evidence for extraplanar radio emission (Fig. 1; e.g., Irwin et al. 1999). Similar to NGC 4631, this galaxy is also located in a region of low Galactic X-ray-absorbing gas column density, important for observing soft X-ray emission expected from the galactic halo. Thus a comparison between these two galaxies allows for probing the potential environmental effects on the structure of the disk/halo interaction.
2 Data Calibration and Analysis
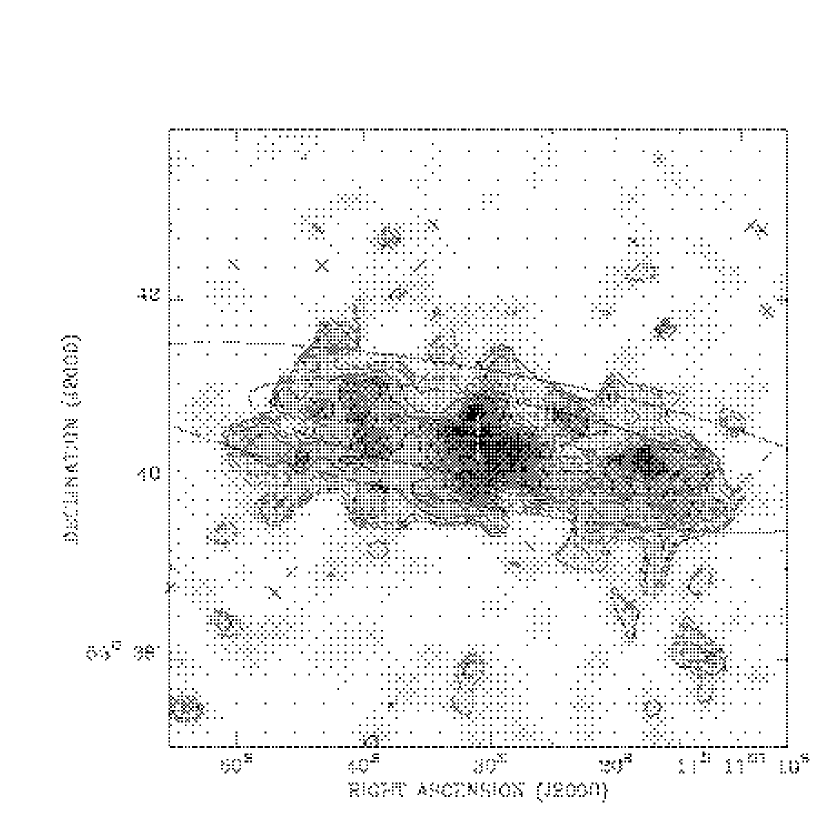
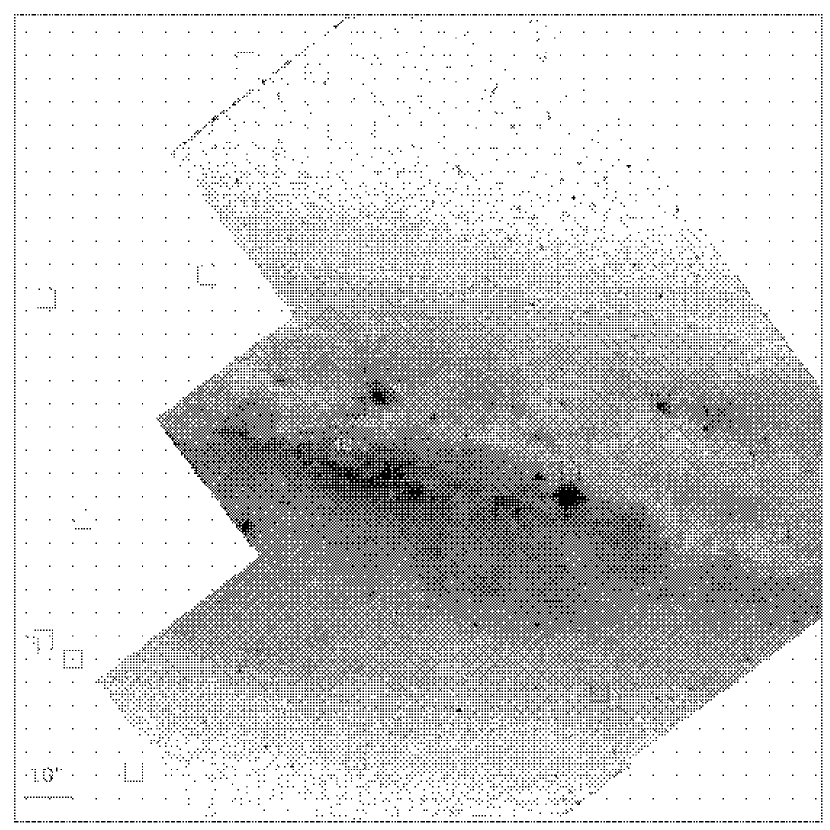
Our Chandra observation of NGC 3556 (Ob. ID. 2025) was taken between Sept. 8-9, 2001 for an exposure of 60 ks. The instrument ACIS-S was at the focal plane of the telescope. The galactic center was placed off the telescope aim-point for an optimal coverage of the galaxy in the S3 chip (Fig. 2). Although data from six chips (CCD ID # 2, 3, 5, 6, 7, and 8) were recorded, this work was based on the data from the latter three only, in particular the on-axis S3 (# 7) chip (Fig. 2).
We reprocessed the level 1 (raw) event data to generate a new level 2 event file. This allowed us to capitalize on the latest Chandra Interactive Analysis of Observations software package (CIAO; version 2.3), including an improved absolute astrometry of the observation (nominally better than ). We further removed time intervals with significant background flares — peaks with count rates and/or a factor of off the mean background level of the observation, using Maxim Markevitch’s light-curve cleaning routine “lcclean” 111available at http://hea-www.harvard.edu/ maxim/axaf/acisbg/. This cleaning, together with a correction for the dead time of the observation, resulted in a net 58,111 s exposure (livetime) for subsequent analysis.
Most of the remaining events are still not related to NGC 3556, however. A large portion of the events is due to charged cosmic-ray particles and to background/foreground X-rays of various origins. The X-ray background/foreground varies from one part of sky to another. Particularly in the very soft band ( keV), such variation is primarily due to the patchy contribution from the hot interstellar medium in our Galaxy. The intensity of particle-induced events, which dominate in the energy range above 1.5 keV, varies with time, depending on solar activities and on the orbit location of the telescope. To estimate the average background spectrum and intensity, we used the so-called blank-field data222available at http://cxc.harvard.edu/contrib/maxim/acisbg/data/README. The data with an effective livetime of 350 ks were re-projected to mimic our observation. Unfortunately, our observation of NGC 3556 was taken in the ‘FAINT TIMED’ mode, whereas the blank-field data were a compilation of source-excised observations taken in the “VERY FAINT” mode, which allowed for a better software rejection of particle-induced events. For the back-illuminated chips (e.g., # 7), the rejection could yield a significant background reduction at low or high energies, for examples, by a factor of at keV or a factor of above 6 keV (A. Vikhlinin’s online article333available at http://cxc.harvard.edu/cal/Acis/Calprods/vfbkgrnd/index.html). Therefore, the use of the blank-field data underestimates particle-induced events in our observation.
For imaging analysis, we constructed exposure maps in four bands: 0.3-0.7, 0.7-1.5, 1.5-3, and 3-7 keV. These maps were used for flat-fielding, accounting for bad pixel removal as well as correcting for the telescope vignetting and the quantum efficiency variation across the detector. We further corrected for the low energy CCD quantum efficiency degradation with time444as discussed in the article available at http://cxc.harvard.edu/cal/Acis/Calprods/qeDeg/index.html. For our observation this degradation caused a fractional sensitivity reduction of 0.45 (or 0.14) in the 0.3-0.7 (or 0.7-1.5) keV band for the back-illuminated (BI) chips and a slightly smaller fraction for the front-illuminated (FI) chips. Accounting for the degradation is important for correctly converting a count rate to an energy flux or comparing hardness ratios of an X-ray source with a spectral model (see later discussion). Our corrections assumed a power law spectrum with a photon index 1.7 (a mean value for most known AGNs) as the weight within the individual bands.
The effective energy-dependent spatial variation is weak within the S3 chip. A comparison between the 0.3-0.7 keV and 3-7 keV bands, for example, shows a relative variation of . The energy dependency is stronger (up to a factor of ) for multiple chips, because of different CCD types (BI vs. FI) and largely different off-axis locations. An intensity map is simply the background subtracted count map divided by the corresponding exposure map in each band. Combinations of these maps can then be used to obtain intensity maps in broader energy bands (e.g., Figs. 1-3).
We searched for X-ray sources in three broad bands, 0.3-1.5 keV (S), 1.5-7 keV (H), and 0.3-7 keV (B). A combination of source detection algorithms were applied: wavelet, sliding-box, and maximum likelihood centroid fitting. First, we constructed the ‘Mexican cap’ wavelet images on scales of 1, 2, 4 and 8 pixels (pixel size= 0492). On each scale we obtained a signal-to-noise (S/N) ratio map, which is the ratio of the wavelet image and its uncertainty image. Local S/N maxima were detected as source candidates. Next, we applied a map detection (‘sliding box’ method) with a background map produced by removing sources detected with the wavelet method and smoothed adaptively to achieve a local count-to-noise ratio greater than 10. Finally, the sources detected with the map method were analyzed by a maximum likelihood algorithm, using both the background map and an approximate Gaussian point spread function corresponding to the respective off-axis angle. The estimation of the count rate of a source was based on the data within the 90% energy-encircled radius (EER) determined with the calibrated point spread function of the instrument, whereas the source removal adopted a larger source region (twice the 90% EER). Sources detected with a false detection probability were finally accepted.
For sources with count rates greater than , we conducted spectral fits with the XSPEC analysis software. We extracted a source spectrum from a radius that is twice the 90% EER and a corresponding local background spectrum in a concentric annulus with the inner and outer radii roughly 2.5 and 6 times the 90% EER. Sources within this annulus, if present, were removed.
Excluding the source regions (circles in Fig. 2, upper panel) from the data allowed for the analysis of the remaining “diffuse” emission from the galaxy. We estimated the X-ray intensity in the source removed “holes”, using both event and exposure data in the surrounding bins (in swiss-cheese-like maps). This interpolation resulted in a smoothed diffuse X-ray intensity map for visualization. But all quantitative measurements (surface brightness profiles, spectra, and luminosities) were based on unsmoothed data.
We analyzed the ACIS-S spectrum of the diffuse X-ray emission from the galaxy. The on-galaxy region (outlined by the dashed box in the upper panel of Fig. 2), covering essentially only the southeastern portion of the optical galaxy, was chosen to minimize the complication of X-ray absorption by the slightly tilted galactic disk on the northwestern part of the galaxy (see §3.2 for further discussion). For the background subtraction, we extracted an off-galaxy spectrum from the two dash-dotted boxes of Fig. 2. To see whether or not this off-galaxy spectrum could actually be used to estimate the background contribution in the on-galaxy region, we compared the on-galaxy and off-galaxy spectra extracted from the simulated blank-field data. The spectral shapes and intensities of these two blank-field spectra were found to be statistically consistent with each other in the energy range of 0.3-7 keV, indicating no significant differences in the background property between the on- and off-galaxy regions. Therefore, we used the off-galaxy spectrum from our data for the background subtraction of the on-galaxy spectrum. We further obtained weighted effective area and response matrices, using the CIAO program “ACISSPEC” and a diffuse X-ray weight map constructed in the 0.5-1.5 keV range to maximize the signal-to-noise ratio of the diffuse soft X-ray emission.
3 Results
3.1 Discrete X-ray Sources
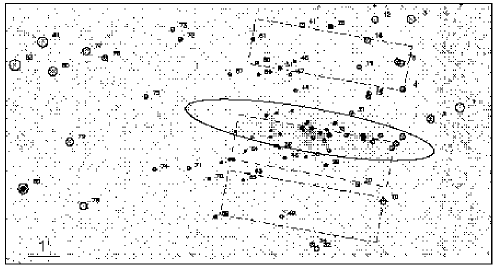
Figs. 1 - 3 present complementary global views of NGC 3556, based on the Chandra data. Table 2 summarizes the results from our source detection. The note to this table explains various parameters listed. The hardness ratios, in particular, provide simple source spectral characteristics, which may be compared with spectral models (e.g., Fig. 4). The detected sources are marked in Fig. 2, where a broad-band X-ray intensity image of the observation is presented together with an exposure map for ease of comparison. Fig. 3 presents a close-up of the galaxy. There is a clear concentration of X-ray sources, particularly ones with high count rates, within the ellipse of NGC 3556. A total of 33 detected sources are located inside the ellipse, which encloses a field of 10 arcmin2. Our source detection is complete down to a flux limit of in the 2-10 keV band. The expected number of interlopers within the ellipse is only (e.g., Moretti et al. 2003). The following discussion concentrates on bright sources within the ellipse and we will assume that they are located within the galaxy.
The source closest to the optical centroid of NGC 3556 (Table 1) is J111131.3+554044 (Source 35 in Table 2). The kinematic center of the galaxy is = , = (King & Irwin 1997) and coincides with the optical center of = , = from the 2MASS extended objects catalog (Jarrett et al. 2003). The ACIS-S spectrum of this source is too flat to be fitted with an one-temperature thermal plasma (XSPEC model “MEKAL”; , where d.o.f. is degrees of freedom). Similarly, we can also reject statistically () a multi-color disk black body (“DISKBB”), which is often used to characterize spectra of accreting disks around black holes in X-ray binaries. But a power law model, multiplied by a photon absorption model, gives a statistically satisfactory fit (Fig. 5; Table 3). The fitted high X-ray-absorbing gas column density indicates that source is deeply embedded in the galaxy’s disk. The 0.5-10 keV luminosity is . Interestingly, a plume-like diffuse X-ray emission feature seems to inflate from the source and extend toward the south, more or less along the minor axis of the galaxy (Fig. 3). Such a diffuse X-ray feature is typically associated with an AGN or a nuclear starburst. Therefore, source 35 with the second highest count rate in Table 2 may represent the nucleus of NGC 3556.
The source with the highest count rate is source 26 (Table 2), which is also projected in the disk of the galaxy (Fig. 3). A power law fit to the spectrum of this source can be rejected statistically at a confidence of (). On the other hand, the disk blackbody model fits well to the spectrum (Table 3, Fig. 5). The inner disk temperature of keV and the 0.5-10 keV luminosity of are well within the ranges for so-called ultraluminous X-ray sources (e.g., Makishima et al. 2000).
Table 3 also includes the results from a satisfactory power law fit to the spectrum of source 25, with the third highest count rate in the field. The photon index is characteristic of an AGN. The source is projected nearly 4′ north of the center of NGC 3556, approximately on its minor axis, and is probably unrelated to the galaxy (Fig. 2, left panel).
A Kolmogorov-Smirnov test yields a positive variability detection of source 31, projected at from the center of the galaxy (Fig. 3). We can statistically reject at a confidence greater than 3 the null hypothesis that the source flux was constant during the ACIS-S observation. This variability was confirmed by a test (Fig. 6); the null hypothesis gives a /d.o.f = 56/7. The hardness ratios, HR and HR2, of the source (as defined in the notes to Table 2) can be characterized by a power law spectrum of a photon index and a high absorption . The luminosity of the source is about a few . Therefore, the source is likely to be an X-ray binary.
For relatively faint X-ray sources, we have little spectral constraint. A useful, though crude, conversion factor from a count rate to an energy flux in the 0.3-7 keV band is for a relatively hard X-ray source with a power law of a photon index or a plasma of a temperature of a few times K. The conversion of the same 0.3-7 keV count rate to the 2-10 keV flux is about a factor of 2 lower. These conversions are insensitive (within a factor ) to the absorbing gas column density, as long as it is smaller than a few times . For soft X-ray sources (e.g., SNRs with a characteristic temperature keV), the conversion factor is a factor smaller for a column density . In §4, we will further explore the nature of various X-ray sources by cross-correlating them with objects observed at other wavelengths.
3.2 Diffuse X-ray Emission
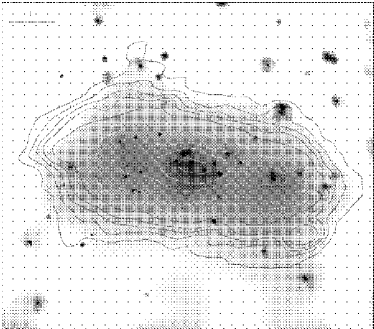
Fig. 7 presents the intensity distribution of the diffuse X-ray emission from the NGC 3556 field. Relative to the major axis of the galaxy, the emission appears substantially more extended to the south than to the north. This is an indication of X-ray absorption by cool gas in front of the X-ray-emitting region to the north, if the intrinsic distribution of the emission is more-or-less symmetric in respect to the major axis. (Note that the galaxy’s dust lane extends along the north side of the disk.) The projected emission region extends vertically (in the minor axis direction) beyond the isophote mag arcsec-2 ellipse, which defines an intrinsic disk radius . Along the major axis, however, the outer most intensity contour extends to only about 3/5 (“tangential” points), which may be considered approximately as the radial extent of the diffuse X-ray emission region in the disk. At these “tangential” points, there should be little line-of-sight projection confusion. Therefore, the vertical height of X-ray emission at these points is most likely intrinsic.
The diffuse emission shows substantial amounts of substructure. The lumpy morphology of the emission indicates that it does not arise from a smoothed galactic corona in a hydrostatic equilibrium with the galaxy’s gravity. There are apparent vertical X-ray “spurs”, toward both the north and the south. Particularly at the east tangential points, such spurs extend vertically from the major axis. This extent indicates a physical height kpc. Some of the spurs might represent parts of larger-scale X-ray loops or rim-brightened blown-out bubbles, as indicated by faint diffuse X-ray structures in the halo of the galaxy (Fig. 7). However, deeper observations are required to draw any firm conclusion about these features. We further suspect that much of the diffuse emission from the galaxy may represent a composite of such discrete features.
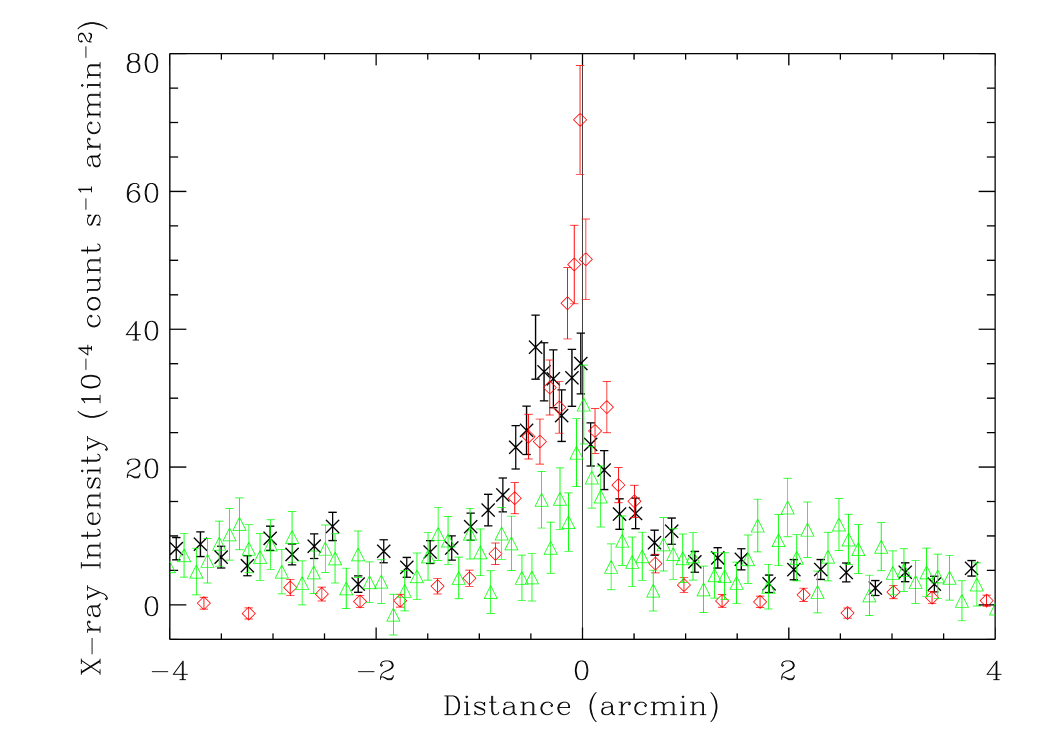
Fig. 8 compares the diffuse X-ray intensity distribution along the galaxy’s minor axis and in different bands. In addition to the evident intensity enhancement associated with the galaxy, there are apparent excesses (above the subtracted blank-field background) at distances far away from the disk, in both the 0.3-0.7 keV and 1.5-7 keV bands. In particular, the intensity in the 0.3-0.7 keV band appears considerably stronger in the southeast than in the northwest of the disk. This difference may not be related to NGC 3556 and may instead represent an intensity gradient in the Galactic foreground soft X-ray emission. The excess seen in the harder 1.5-7 keV band is likely due to the expected, relatively high rate of particle-induced events in our observation (recall § 2).
The diffuse emission intensity enhancement associated with NGC 3556 is predominantly in the 0.3-1.5 keV range and has a full width of about 2′. The enhancement in the 0.3-0.7 band does not show a sharp peak at the galaxy’s major axis as in the 0.7-1.5 keV band, but has a distribution considerably broader than in the 0.7-1.5 keV band. The intensity enhancement also shows an apparent asymmetry in both bands, but it is particularly strong in the 0.3-0.7 keV band. This energy dependence suggests that the asymmetry is caused mainly by soft X-ray absorption by the galactic disk, which presumably has its near side tilted to the north. With the projected gas column density of of the disk (King & Irwin 1997), much of soft X-rays from the northern low halo or high disk are likely absorbed by the near-side part of the galaxy’s disk. The emission from the southern halo (southeast to the major axis) is not as much affected by the disk.
The spectral properties of the diffuse X-ray emission are characterized by simple-minded models available in XSPEC (Fig. 9). The overall soft spectral characteristics indicate that the emission is primarily due to hot gas. However, an one-temperature, optically-thin, ionization equilibrium plasma does not give a statistically acceptable fit (). A thermal model of two-temperature components, on the other hand, produces a statistically satisfactory fit, not perfect though (Fig. 9; Table 4). There are apparent systematic deviations, especially an excess over the high energy part of the spectrum. This deviation is at least partly due to the presence of residual point-like sources in the disk of the galaxy. However, the counting statistics and spectral resolution of the present data are too limited to be used for quantifying this plausible component. The metal abundances are also not tightly constrained. Assuming independent abundances for the two components does not significantly improve the fit.
4 Multiwavelength Comparison
We have correlated our X-ray source positions (Table 2) with six data sets from other wavelength bands of similar spatial resolution, including an H image taken with the Apache Point Observatory (Collins et al. 2000), Two Micron All-Sky Survey data, infrared data taken with the Infrared Space Observatory (ISO), Digitized Sky Survey (DSS) data, archival images from the Hubble Space Telescope WFPC2 (4678-7352 Å, broad V-band), and a 20 cm radio continuum image taken with the Very Large Array (Irwin et al. 2000). We concentrate our discussion on the multiwavelength information that we have actually used to delineate the nature of the observed X-ray emission from NGC 3556.
4.1 Discrete Sources
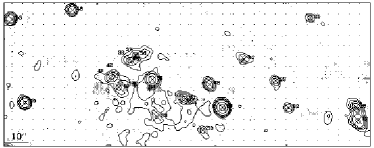
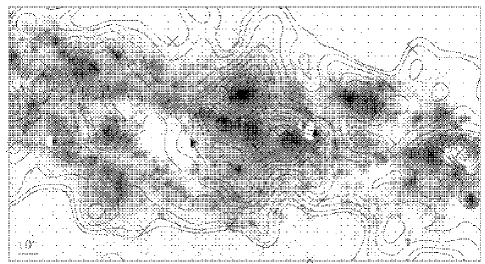
Fig. 10 shows an overlay of X-ray intensity contours on the 20 cm radio image. We conducted an elliptical Gaussian fitting to measure the centroids and integrated emission intensities of radio objects (or peaks of extended emission) that show positional coincidences with X-ray sources. In Table 5, we list four such coincidences with the position offsets between radio and X-ray centroids smaller than their combined 3 position uncertainty radii. Of course, there is a chance that a positional coincidence may simply represent a random chance superposition. Assuming both the radio and X-ray sources are randomly distributed in the entire radio image, which is bigger than that shown in Fig. 10, we estimate the probability to be or for one or two chance superpositions. The realistic probability should be somewhat higher, however, because both radio and X-ray sources show a correlation with the galaxy. Nevertheless, most of the coincidences listed in Table 5 seem to represent real associations.
We have explored the nature of the radio/X-ray position coincidences, based on their X-ray spectral characteristics. Source 18 has a hard X-ray spectrum, as indicated by its hardness ratios (Table 2). Fig. 4 suggests that the source is subject to heavy X-ray absorption (). For a typical line-of-sight absorption in the disk of the galaxy, the spectral characteristics of the source are probably inconsistent with a thermal plasma with a temperature of a couple of keV, as expected for a young SNR, but appear to be consistent with a power law of a photon index . The inferred luminosity of the source is , for the distance of the galaxy (Table 1). The strong and extended radio emission (Table 5), however, is not expected for a typical X-ray binary. The only other suggested radio counterpart of a bright X-ray binary in nearby galaxies is an X-ray source with a luminosity of in the dwarf irregular galaxy NGC 5408 at the distance of 4.8 Mpc (Kaaret et al. 2003). Even in this case, the radio flux is only mJy, a factor of lower than that inferred for source 18 here, accounting for the distance difference between the two galaxies. Therefore, the radio and X-ray association of source 19, if real, would be quite unusual.
Interestingly, the other three X-ray sources with radio counterparts in Table 5 are all best detected in the soft (S) band (Table 2). This means that the X-ray fluxes of these sources are primarily in the energy range keV. In fact, these three are the only such sources projected within the ellipse of the galaxy (Fig. 3). There are three other such soft X-ray sources in Table 2 but they are all located far away from the galaxy (Fig. 1 left panel). Both source 24 and source 36 are relatively faint and appear to be extended morphologically (Fig. 3). Therefore, these two sources may represent giant HII regions such as the 30 Doradus nebula (Wang 1999). Indeed, the substantially brighter radio counterpart of source 36 also appears correlated with objects seen in the H, ISO and HST images.
Source 53 has a luminosity of and is apparently point-like. The offset from the radio-bright object (Table 5; Fig. 10) is greater than . So the X-ray source and the radio object may not be related. If physically associated, however, they could represent a very young SNR. Clearly, more information is needed to firmly establish the nature of all these sources. For example, radio spectral indexes, as can be afforded by a high-resolution radio observation at another wavelength, will be particularly useful.
In order to compare the optical image with our X-ray data, two archival HST images, both in the same V-band but at slightly different observing times, were first averaged together. Next, we aligned three bright sources in the 2MASS H-band image with their counterparts in the HST image. Fig. 11 presents the combined HST image which covers the central region of the galaxy. There are three X-ray sources, 24, 36, and 42, which appear to coincide with optical sources within the astrometry offset error of . Sources 24 and 36 again appear correlated with bright, somewhat extended objects in the V-band. They have absolute magnitudes of and , respectively. In a study of 145 HII regions in M33, Jiang et al. (2002) found an average absolute magnitude in the V-band of -8.4. Thus, we are seeing emission in 3 bands, the X-ray, radio continuum and optical, from sources 24 and 36, likely related to giant HII regions. Source 42 also appears correlated with a more point-like optical object and has a slightly fainter magnitude of at the galaxy’s distance. But the counting statistics of this X-ray source is too limited to provide useful constraints on its spectral properties.
4.2 Diffuse Emission
We compare the diffuse X-ray emission with observations in optical blue (Fig. 1, left panel), radio continuum (Fig. 1, right panel), and H line intensity (Fig. 12). Clearly, there is a good overall morphological similarity between the radio and X-ray emissions. The elongation along the galactic disk is in sharp contrast to the vertical orientation (along the minor axis) typically seen in the diffuse X-ray emission from a nuclear starburst galaxy (e.g., M82 and NGC 253). While the vertical morphology is a sign of galactic nuclear superwind, the large-scale disk-oriented extraplanar diffuse X-ray emission from NGC 3556 suggests an active disk/halo interaction. The limited vertical extent of the emission probably indicates that the hot gas is confined by the gravity of the galaxy.
From the spectral parameters in Table 4, we may estimate the physical parameters of the diffuse X-ray-emitting gas. We assume that the gas is located within a cylinder with its axis aligned with the rotation axis of the galaxy. This cylinder has an angular radius 26 (3/5) and a height 2′, which gives a total volume of . The best-fit integrated emission measures (Table 4), multiplied by a factor of 2 to account for the contribution from the northern halo, suggest a mean electron density of and for the low and high temperature components with the volume filling factors, and , respectively. The total volume filling factor is . Assuming that there is a thermal pressure balance between the two components, we find . We further infer the mean pressure and total thermal energy of the hot gas as and . The total cooling rate of the gas is . The cooling time of the gas is years.
It is interesting to compare the thermal pressure of the hot gas (equivalent to from above) with the magnetic field pressure in the galaxy. Irwin et al. (1999) show resolved maps of the magnetic field strength in NGC 3556 using the minimum energy assumption. The mean magnetic field, adjusting to the currently adopted distance, is 6.7 G, with a range from 5.1 to 10.2 G. The magnetic field pressure, assuming isotropy and uniform filling, is 1.8 10-12 dyne cm-2 (ranging from 1.0 to 4.1 10-12 dyne cm-2). This, together with the accompanied contribution of cosmic-rays, may be comparable to the thermal pressure at the galactic disk. The projected region over which the magnetic field has been determined is actually smaller than the region over which the thermal pressure has been determined (see Fig. 12 of Irwin et al.), i.e. the magnetic pressure calculation applies to a region more confined to the disk. Therefore, a more realistic comparison must account for the pressure variation in both the radio- and X-ray-emitting materials.
What is the origin of the X-ray-emitting gas? Fig. 12 shows some correlation between the diffuse X-ray and H emissions, indicating that massive stars are responsible for the heating of the gas in the galactic disk. Massive stars tend to form in clusters or associations. The concentrated mechanical energy input in the form of fast stellar winds and supernovae (SNe) can naturally generate superbubbles of hot gas. Such superbubbles, if energetic, can break out from the disk into the halo, which may explain the various X-ray “spurs” observed. There do appear to be some high latitude HI extensions (from data in King & Irwin 1997) associated with X-ray spurs, but the spatial scales are not similar enough to draw firm conclusions. It would be interesting to have a detailed study of the correlation between optical and X-ray emission structures, although the optical appearance of these structures may be affected severely by the extinction/absorption in the disk. Dust lanes are clearly seen in the northern part of the optical disk and appear to coincide with regions of relatively low diffuse X-ray intensity or high intensity gradient (Fig. 12). Similar effects can also been seen on larger scales in Fig. 1 (left panel).
NGC 3556 is an isolated galaxy (e.g., Davis & Seaquist 1983). It is thus unlikely that the HI supershells observed in this galaxy are produced from impacting clouds (Irwin et al. 1999). As seen in other galaxies, some such shells are clearly associated with massive star forming regions, as traced by H II regions. Thus, the energy may be provided by SNe and stellar winds from massive stars. Our estimated X-ray-emitting gas cooling rate corresponds to a SN rate of per 1000 years, assuming a thermal energy input of per SN. The SN rate for NGC 3556 is per 1000 years (Irwin, English & Sorathia, 1999). Therefore, the thermal energy of the diffuse hot gas observed could be easily supplied by SNe in the disk of the galaxy. We caution, however, that there are other very large and energetic HI extensions in NGC 3556 which do not seem to be explained via underlying star formation (King & Irwin 1997), so although there may be a connection between massive star formation and X-ray spurs in the inner galaxy, star formation alone may not explain all of the energetic features in this galaxy.
Finally, let us compare the results on NGC 3556 and NGC 4631. Both galaxies show a similar overall morphology of extraplanar emission in radio continuum and diffuse X-ray, indicating that there is a close link between the outflows of hot gas and cosmic-rays/magnetic fields in galaxies (Wang et al. 1995 and reference therein). Furthermore, H images of NGC 4631 show a prominent “double worm” structure plus a forest of faint vertical filaments (or loops) emanating from the galactic disk of NGC 4631 toward its northern halo, where the extraplanar emission is most extended (Rand et al. 1992; Wang et al. 2001). This again argues for the extraplanar emission to be linked to underlying processes. Furthermore, NGC 4631 and NGC 3556 have nearly identical ratios of the total far-infrared flux to the blue light flux as well as dust temperatures (Rice et al. 1988), indicating comparable star formation rates in the two galaxies. If we wish to consider how concentrated the star formation is in the two galaxies, the best indicator for edge-on dusty systems is the radio continuum emission. NGC 3556 shows an increase in its radio continuum emission within its central 14 (5.9 kpc; Irwin et al. 1999) indicative of a centrally enhanced region of star formation. Similarly, NGC 4631 (7.6 Mpc) also shows increasing radio continuum emission within the central 3 to 35 (6.6 to 7.7 kpc; e.g., Dumke et al. 1995). Both galaxies also have rotation curves that peak at 150 km s-1, relative to their systemic velocities (Rand 1994; King & Irwin 1997) indicating that they have similar mass and therefore similar abilities to retain gas that has been ejected into the halo. Yet the emission in both radio and X-ray is considerably more extended in NGC 4631 along the minor axis than in NGC 3556. What might be the cause of this difference? At the present time, the only obvious difference between NGC 3556 and NGC 4631 is that the latter is involved in a galaxy-galaxy interaction whereas the former is isolated. A larger sample of galaxies is required to see whether galaxy halos are more prominent in interacting systems, but this result is interesting. NGC 3556 probably presents a cleaner case for studying the disk-halo interaction driven by galactic internal processes than interacting galaxies like NGC 4631.
5 Summary
We have presented a detailed analysis of the Chandra ACIS-S observation of the edge-on galaxy NGC 3556. Together with existing observations at other wavelengths, we have explored the nature and physical state of various X-ray sources and features as well as large-scale diffuse soft X-ray emission from the galaxy. Our main results and conclusions are as follows:
-
•
We have detected 83 X-ray sources in the field of NGC 3556 (Table 2; Fig. 2). Among them, 33 are within the R25 ellipse of the galaxy. One source shows strong timing variability during the observation.
-
•
We have identified source 35 (J111131.3+554044) as a candidate for the nucleus of the galaxy. This source, with the second highest count flux detected here, has a power law X-ray spectrum typical for an AGN (Table 3). In addition, the source is possibly associated with an X-ray-emitting plume pointing toward the southern halo.
-
•
The brightest X-ray source detected (Source 26), with a 0.5-10 keV luminosity of , has a spectrum well characterized by a multi-color disk blackbody (Table 3). This ultraluminous X-ray source may thus represent an accreting intermediate-mass black hole.
-
•
We have found possible radio counterparts for four X-ray sources (Table 5). One of them (Source 18) has a hard X-ray spectrum and may thus be an X-ray binary. The radio counterpart, however, is unusually bright and extended. The other three sources are the only ones detected primarily in the 0.3-1.5 keV band and within the R25 ellipse. Two of them (Sources 24 and 36) have extended and relatively faint counterparts in the radio and extended and relatively bright counterparts in the optical, most likely representing hot gas in giant HII regions.
-
•
We have detected large amounts of diffuse soft X-ray emission from the galaxy (e.g., Fig. 7). This emission is confined within a radius of kpc (3/5) in the galactic disk, but extends beyond kpc into the halo of the galaxy. The overall morphology of the emission suggests an active disk-halo interaction throughout much of the galaxy.
-
•
The diffuse X-ray emission morphology shows a significant asymmetry relative to the major axis of the galaxy. This is most likely due to the X-ray absorption by the nearly edge-on galactic disk that is tilted with the northern side closer to us than the southern one.
-
•
The diffuse X-ray emission shows substructures such as vertical “spurs”, which may represent breaking out superbubbles from the galactic disk. There is a good spatial correlation between diffuse X-ray emission and H features within the disk, indicating that X-ray-emitting gas originates primarily in recent massive star forming regions.
-
•
The spectrum of the diffuse emission can be characterized approximately by a two-temperature thermal plasma with a total luminosity of . This energy loss is likely balanced by SN heating in the disk.
-
•
In spite of many similarities between NGC 3556 and NGC 4631, the halo of NGC 4631 is much more extended than in NGC 3556. This may be due to the fact that NGC 4631 is interacting whereas NGC 3556 is isolated and therefore offers a more pristine environment for studying disk-halo interactions.
In short, this study demonstrates that NGC 3556 is a fine example for a wealth of high-energy phenomena and processes in an active starforming disk galaxy. In particular, the extensive extraplanar diffuse X-ray emission and its substructure revealed here are clearly a manifestation of the intense disk-halo interaction in NGC 3556.
References
- (1)
- (2) Collins, J. A., Rand, R. J., Duric, N., & Walterbos, R. A. M. 2000, ApJ, 536, 645
- (3) Davis, L. E., & Seaquist, E. R. 1983, ApJS, 53, 269
- (4) Dickey, J. M., & Lockman, F.J. 1990, ARA&A, 28, 215
- (5) Dumke, M., Krause, M., Wielebinski, R. & Klein, U. 1995, A&A, 302, 691
- (6) Ho, L. C., Filippenko, A. V, Sargent, W. L. W. 1997, ApJS, 112, 315
- (7) Hummel, E., Beck, R., & Dahlem, M. 1991, A&A, 248, 23
- (8) Immler, S., Wang, Q. D., Leonard, D. C., & Schlegel, E. M. 2003, ApJ, in press
- (9) Irwin, J. A., English, J., & Sorathia, B. 1999, AJ, 117, 2102
- (10) Irwin, J. A., Saikia, D. J., & English, J. 2000, AJ, 119, 1592
- (11) Jarrett, T. H., Chester, T., Cutri, R., Schneider, S. E., & Huchra, J. P. 2003, AJ, 125, 525
- (12) Jiang, L. et al. 2002, AJ, 124, 3179
- (13) Kaaret, P., et al. 2003, Science, 5605, 365
- (14) King, D. & Irwin, J. A. 1997, NewA, 2, 251
- (15) Makishima, K., et al. 2000, ApJ, 535, 632
- (16) Moretti, A., Campana, S., Lazzati, D., & Tagliaferri, G. 2003, ApJ, 588, 696
- (17) Rand, R. J. 1994, A&A, 285, 833
- (18) Rand, R. J., Kulkarni, S. R., & Hester, J. J. 1992, ApJ, 396, 97
- (19) Rice, W., et al. 1988, ApJS, 68, 91
- (20) Wang, Q. D., 1999, ApJL, 510, 139
- (21) Wang, Q. D., et al. 1995, ApJ, 439, 176
- (22) Wang, Q.D., Immler, S., Walterbos, R., Lauroesch, J.T., & Breitschwerdt, D. 2001, ApJL, 555, 99
| Parameter | Value | Ref. |
|---|---|---|
| Type | SB(s)cd | 1 |
| 435 | 1 | |
| Inclination angle | 1 | |
| Position angle | 1 | |
| Center position | R.A. | 2 |
| (J2000) | Dec. | 2 |
| Blue Magnitude | 10.7 mag | 1 |
| Distance | Mpc | 3 |
| ( kpc) | ||
| Galactic foreground | cm-2 | 4 |
References. — (1) NED; (2) Jarrett et al. (2003) (3) Ho et al. (1997) and references therein; (4) Dickey & Lockman (1990)
| Source | CXOU Name | (′′) | log(P) | CR | HR | HR1 | HR2 | Flag |
|---|---|---|---|---|---|---|---|---|
| (1) | (2) | (3) | (4) | (5) | (6) | (7) | (8) | (9) |
| 1 | J111054.09+554113.2 | 1.6 | – | – | – | B | ||
| 2 | J111101.25+554049.5 | 0.6 | – | B | ||||
| 3 | J111106.00+554416.7 | 1.1 | – | – | – | B | ||
| 4 | J111108.15+554151.4 | 0.7 | – | – | – | B | ||
| 5 | J111108.22+554013.5 | 1.4 | – | – | – | B | ||
| 6 | J111108.50+554245.6 | 0.7 | – | – | – | B | ||
| 7 | J111109.37+554248.7 | 0.4 | B | |||||
| 8 | J111109.77+553959.7 | 0.6 | – | – | – | B | ||
| 9 | J111110.67+553950.5 | 1.0 | – | – | – | B | ||
| 10 | J111112.85+553759.9 | 0.7 | – | – | – | B | ||
| 11 | J111113.54+554016.0 | 0.5 | – | B | ||||
| 12 | J111114.82+554416.2 | 1.3 | – | – | – | B | ||
| 13 | J111115.41+554002.8 | 0.7 | – | – | – | B | ||
| 14 | J111116.36+554142.4 | 0.3 | – | B | ||||
| 15 | J111116.55+554135.8 | 0.4 | – | B | ||||
| 16 | J111116.66+554333.8 | 1.0 | – | – | – | B | ||
| 17 | J111117.70+554009.9 | 0.2 | B | |||||
| 18 | J111117.80+554016.7 | 0.2 | B | |||||
| 19 | J111118.69+554238.1 | 1.1 | – | – | – | S | ||
| 20 | J111119.13+553835.4 | 0.5 | – | – | – | B | ||
| 21 | J111120.62+554103.1 | 0.6 | – | – | – | B | ||
| 22 | J111121.94+554016.4 | 0.5 | – | – | B | |||
| 23 | J111122.76+554030.4 | 0.4 | – | – | – | B | ||
| 24 | J111124.70+554041.8 | 0.4 | – | – | – | S | ||
| 25 | J111125.72+554401.4 | 0.2 | B | |||||
| 26 | J111126.02+554016.7 | 0.1 | B | |||||
| 27 | J111126.13+553945.1 | 0.6 | – | – | – | B | ||
| 28 | J111126.80+554028.6 | 0.2 | B | |||||
| 29 | J111126.87+553914.7 | 0.2 | B | |||||
| 30 | J111127.23+554004.9 | 0.6 | – | – | – | B | ||
| 31 | J111128.30+554021.2 | 0.3 | – | B | ||||
| 32 | J111129.23+553621.2 | 1.1 | – | – | – | B | ||
| 33 | J111130.05+554011.6 | 0.4 | – | – | – | B | ||
| 34 | J111130.23+553629.9 | 0.6 | – | – | – | B | ||
| 35 | J111130.32+554031.1 | 0.1 | B | |||||
| 36 | J111131.34+554044.0 | 0.3 | – | – | – | S | ||
| 37 | J111131.61+554041.0 | 0.4 | – | – | – | B | ||
| 38 | J111131.80+553931.6 | 0.6 | – | – | – | B | ||
| 39 | J111131.81+554041.3 | 0.4 | – | – | – | B | ||
| 40 | J111132.39+554027.0 | 0.3 | – | – | – | B | ||
| 41 | J111132.63+554405.0 | 0.8 | – | – | – | S | ||
| 42 | J111132.64+554032.8 | 0.3 | – | – | B | |||
| 43 | J111132.91+554032.0 | 0.3 | – | B | ||||
| 44 | J111134.35+554149.1 | 0.5 | – | – | – | B | ||
| 45 | J111134.53+554249.8 | 0.2 | B | |||||
| 46 | J111135.24+554107.2 | 0.2 | B | |||||
| 47 | J111135.54+554222.8 | 0.5 | – | – | – | B | ||
| 48 | J111136.94+553929.5 | 0.9 | – | – | – | H | ||
| 49 | J111137.80+553728.3 | 0.8 | – | – | – | H | ||
| 50 | J111138.13+554019.1 | 0.1 | B | |||||
| 51 | J111138.19+554236.7 | 0.1 | B | |||||
| 52 | J111138.37+553951.6 | 0.1 | B | |||||
| 53 | J111138.99+554102.5 | 0.1 | – | S | ||||
| 54 | J111139.05+553955.5 | 0.4 | – | – | – | B | ||
| 55 | J111139.40+553954.1 | 0.2 | – | – | B | |||
| 56 | J111140.32+554025.5 | 0.2 | – | – | – | B | ||
| 57 | J111140.48+554012.5 | 0.1 | B | |||||
| 58 | J111141.39+554057.7 | 0.1 | B | |||||
| 59 | J111143.34+554221.9 | 0.4 | – | – | – | B | ||
| 60 | J111143.76+554246.9 | 0.3 | – | – | – | S | ||
| 61 | J111144.77+554335.8 | 0.4 | – | – | – | B | ||
| 62 | J111145.05+554012.7 | 0.5 | – | – | – | B | ||
| 63 | J111145.74+553857.0 | 0.3 | – | – | – | B | ||
| 64 | J111146.69+553943.6 | 0.6 | – | – | – | B | ||
| 65 | J111147.13+553843.9 | 0.3 | – | – | – | B | ||
| 66 | J111148.98+554024.4 | 0.1 | – | B | ||||
| 67 | J111150.41+554223.0 | 0.3 | – | – | – | B | ||
| 68 | J111152.39+553920.0 | 0.4 | – | – | – | B | ||
| 69 | J111153.96+553728.2 | 0.3 | B | |||||
| 70 | J111155.31+553846.7 | 0.2 | B | |||||
| 71 | J111200.43+553908.2 | 0.4 | – | – | – | B | ||
| 72 | J111202.53+554335.7 | 0.4 | – | – | – | B | ||
| 73 | J111204.47+554355.7 | 1.5 | – | – | – | B | ||
| 74 | J111208.84+553905.7 | 0.5 | – | – | – | B | ||
| 75 | J111210.95+554136.6 | 0.6 | – | – | – | B | ||
| 76 | J111220.99+554256.2 | 0.5 | – | – | B | |||
| 77 | J111225.58+554310.6 | 0.6 | – | – | B | |||
| 78 | J111226.16+553750.1 | 1.0 | – | – | – | B | ||
| 79 | J111229.59+554002.4 | 0.9 | – | – | – | B | ||
| 80 | J111233.80+554227.9 | 0.7 | – | B | ||||
| 81 | J111236.28+554329.5 | 1.3 | – | – | – | B | ||
| 82 | J111240.95+553825.0 | 0.5 | B | |||||
| 83 | J111243.11+554241.3 | 1.4 | – | – | – | B |
Note. — Column (1): Generic source number. (2): Chandra X-ray Observatory (unregistered) source name, following the Chandra naming convention and the IAU Recommendation for Nomenclature (e.g., http://cdsweb.u-strasbg.fr/iau-spec.html). (3): Position uncertainty (1) in units of arcsec. (4): The false detection probability P that the detected number of counts may result from the Poisson fluctuation of the local background within the detection aperture [log(P) smaller than -20.0 is set to -20.0]. (5): On-axis (exposure-corrected) source count rate in the 0.3-7 keV band. (6-8): The hardness ratios defined as , , and , where S1, S2, H1, and H2 are the net source count rates in the 0.3–0.7, 0.7–1.5, 1.5–3, and 3–7 keV bands, respectively, while S and H represent the sums, S1+S2 and H1+H2. The hardness ratios are calculated only for sources with individual signal-to-noise ratios greater than 4 in the broad band (B=S+H), and only the values with uncertainties less than 0.2 are included. (9): The label “B”, “S”, or “H” mark the band in which a source is detected with the most accurate position, as adopted in Column (2).
| Source | Model | Spectral parameters | N | /d.o.f. | ||
|---|---|---|---|---|---|---|
| 25 | Power law | 13.5/19 | 4.7 | 14 | ||
| 26 | Diskbb | 14(11-18) | 59.6/52 | 19 | 21 | |
| 35 | Power law | 30(21-47) | 38.5/31 | 8.2 | 24 |
.
Note. — is the photon index, whereas (in units of keV) is the effective inner temperature of the accretion disk. The uncertainty ranges of the parameters are included in the parentheses and are all at the 90% confidence. The unabsorbed flux is in units of
| Parameter | Value |
|---|---|
| Best-fit /d.o.f. | 43.8/35 |
| Low temperature (keV) | 0.166(0.158-0.175) |
| Integrated EM () | 1.2(0.5-2.5) |
| High temperature (keV) | 0.62(0.58-0.66) |
| Integrated EM () | 0.6(0.3-1.2) |
| Abundances (solar) | 0.33 (0.13-1.6) |
| Column Density () | 2 (fixed) |
Note. — The parameters are from the two-temperature thermal plasma model fit to the diffuse X-ray spectrum of NGC 3556 (see also Fig. 9). The uncertainty ranges of the parameters are included in the parentheses and are all at the 90% confidence. The integrated emission measure is defined as , where the integration is over a solid angle over which the data were collected and with being the electron density (all units in cgs).
| Source | Radio Flux (mJy) | Radio FWHM(′′) | Radio S/N | Offset (′′) |
|---|---|---|---|---|
| 18 | 0.72 0.06 | 2.4 0.6 | 34.5 | 0.6 0.4 |
| 24 | 0.30 0.05 | 2.0 0.3 | 14.4 | 1.1 0.7 |
| 36 | 2.13 0.07 | 2.8 0.6 | 101.5 | 0.6 0.5 |
| 53 | 0.42 0.05 | 2.1 0.4 | 20.0 | 0.7 0.3 |
Note. — Both the flux and the full width at half maximum (FWHM) of radio emission are calculated from a Gaussian fit to the 20 cm continuum data (Irwin et al. 2000, beam size = 17 14) de-convolved from the beam. The signal-to-noise ratios (S/N) are computed by taking the ratio of the flux to the rms noise (0.021 mJy/beam) of the radio data. The offset is between the X-ray source position (Column 2 of Table 2) and the centroid position of the Gaussian fit.