Envelope Structure of Starless Core L694-2 Derived from a Near-Infrared Extinction Map
Abstract
We present a near-infrared extinction study of the dark globule L694-2, a starless core that shows strong evidence for inward motions in the profiles of molecular spectral lines. The J,H, and K band data were taken using the European Southern Observatory New Technology Telescope. The best fit simple spherical power law model has index , over the –0.1 pc range in radius sampled in extinction. This power law slope is steeper than the value of for a singular isothermal sphere, the initial condition of the inside-out model for protostellar collapse. Including an additional component of extinction along the line of sight further steepens the inferred profile. A fit for a Bonnor-Ebert sphere model results in a super-critical value of the dimensionless radius . This unstable configuration of material in the L694–2 core may be related to the observed inward motions. The Bonnor-Ebert model matches the shape of the observed density profile, but significantly underestimates the amount of extinction observed in the L694–2 core (by a factor of ). This discrepancy in normalization has also been found for the nearby protostellar core B335 (Harvey et al. 2001). A cylindrical model with scale height pc () viewed at a small inclination to the axis of the cylinder provides an equally good radial profile as a power law model, and it also reproduces the asymmetry of the L694–2 core remarkably well. In addition, this model provides a possible basis for understanding the discrepancy in the normalization of the Bonnor-Ebert model, namely that L694–2 has prolate structure, with the full extent (mass) of the core being missed by analysis that assumes symmetry between the profiles of the core in the plane of the sky and along the line-of-sight. If the core is sufficiently magnetized then fragmentation may be avoided, and later evolution might produce a protostar similar to B335.
1 Introduction
Molecular line surveys of nearby dark clouds have identified a large sample of dense cores (e.g. Benson & Myers 1989), of which roughly half are associated with young stellar objects detected by the IRAS (Beichman et al. 1986). The properties of these cores have been adopted in the standard model of isolated star formation whereby a slowly rotating, nearly spherical core makes a star/disk system via “inside-out” collapse (Shu, Adams & Lizano 1987). In this picture, a “starless” dense core represents the earliest stage of the star formation process. The physical conditions in this early stage have a profound impact on the evolution of protostars towards the main sequence. The initial density structure, particularly in the innermost regions, affects the collapse dynamics and the time dependence of the mass accretion rate (Foster & Chevalier 1993), and therefore many of the observable properties of protostars, including luminosity.
While the standard theory has proved very successful in many predictions (see the review of Shu et al. 1993), its weakest foundation arguably lies in the adopted initial conditions (André, Ward-Thompson & Barsony 2000). In the simplest case where a spherical starless core loses turbulent and magnetic support and relaxes to a balance between gravity and thermal pressure, an density distribution is established and the core collapses from the inside-out with a constant mass accretion rate (Shu 1977). Alternatively, if collapse begins before the density distribution fully relaxes, then a central region of relatively constant density remains and the mass accretion rate is an order of magnitude larger at early times (Foster & Chevalier 1993). This phenomenon has been identified with the youngest “Class 0” protostars, which exhibit especially powerful outflows (Henriksen, Andre & Bontemps 1997; Andre, Ward-Thompson & Barsony 2000). In another case, a starless core with a logotropic equation of state develops a nearly density law and the mass accretion rate during collapse increases rapidly with time (McLaughlin & Pudritz 1997).
Better observations of starless cores are needed to measure appropriate initial conditions. Molecular hydrogen, the main mass constituent, cannot be observed directly in these cold (T10 K) dense regions. The most robust tracer of mass is provided by dust. (Molecular line emission is compromised by excitation effects and severe depletion.)
Most of the detailed information on starless core structure comes from observations of dust emission, using data from submillimeter bolometer cameras (e.g. Ward-Thompson, Motte & Andre 1999, Shirley et al. 2000, Visser, Richer & Chandler 2001). The intensity of the dust emission provides an integral along the line-of-sight of the product of the dust temperature and density. An important conclusion from these studies is that starless cores appear to show flat density profiles in their inner regions, with extended envelopes that fall off rapidly in power law fashion. However, the regions of relatively constant density are poorly resolved by the low angular resolution available in the submillimeter. Moreover, the interpretation of the flat central density gradients has been called into question: more sophisticated analysis including self-consistent temperature calculations predict much smaller regions of flattening, or no flattening at all, in large part because the cores are cooler in their deep interiors than assumed previously (Evans et al. 2001, Walmsley et al. 2001).
Observations of dust extinction provide a more reliable measure of column density than observations of dust emission, mainly because extinction is not sensitive to gradients of dust temperature. Historically, this method has been impossible to apply to small regions of high extinction because of poor sensitivity and a paucity of background stars, even in the infrared where the extinction is much less than in the optical (e.g. Bok & Cordwell 1973, Jones et al. 1980, 1984). The development of large format near-infrared array cameras has sparked renewed interest in the technique (Lada et al. 1994, Alves et al. 1998, Alves, Lada & Lada 1999, 2001, Harvey et al. 2001).
Harvey et al. (2001) describe deep near-infrared extinction measurements toward B355, arguably the best protostellar collapse candidate, using the Hubble Space Telescope (HST). The B335 system contains a deeply embedded young stellar object, and exhibits molecular line profiles well fit by inside-out collapse (Zhou et al. 1993, Choi et al. 1995). The shape of the density profile determined from the deep extinction data provide the best evidence yet in support of inside-out collapse theory. Alves, Lada & Lada (2001) used the color excess method to study the starless core B68 with data from the the European Southern Observatory (ESO) New Technology Telescope (NTT). The B68 system is much less centrally condensed than B335, with lower peak column density, and it was easily penetrated with the sensitivity available from the ground. The extinction map of B68 suggests a hydrostatic equilibrium structure, with density distribution best described by the equations of a pressure confined, self-gravitating, isothermal sphere (Ebert 1955, Bonnor 1956).
The examples of B68 and B335 represent milestones in the early evolution of low-mass stars, but they do not show the density structure of a forming dense core, or the density structure at the onset of collapse. The recent identification of contracting starless cores presents an opportunity to study this important intermediate evolutionary phase. There are now at least 7 “strong” infall candidates among the starless cores, based on observations of molecular line profiles with redshifted self-absorption in a systematic search of more than 200 targets (Lee, Myers & Tafalla 1999). Molecular line maps of these objects provide strong evidence of inward motions, with speed km s-1 over a radius of pc (Lee, Myers & Tafalla 2001). The physical basis for these motions is unclear. The speeds are subsonic and may be associated with condensation through ambipolar diffusion, or perhaps a magnetically diluted gravitational collapse (Ciolek & Basu 2000). Alternatively, pressure driven motions due to the dissipation of turbulence may be responsible (Myers & Lazarian 1998).
L694–2 is the best of these sources for extinction work, since it is viewed against a very high density of background stars near the Galactic plane (, ), and at the same time there is no significant reddening by additional clouds along this line-of-sight. This isolated, round, dense core is situated close to the protostar B335 in the sky, probably associated with the same molecular cloud complex. This association suggests a distance of 250 pc (Tomita, Saito & Ohtani 1979), consistent with recent estimates of pc (Kawamura et al. 2001). But unlike B335, L694–2 is starless, with no evidence of an embedded luminosity source from IRAS or any indication of bipolar outflow (Visser 2000, Harvey et al. 2002). Analysis of dust emission suggests a steep outer profile with flattening of the density gradient within a radius of a few thousand AU (Visser 2000), but suffers from the probably inaccurate assumption of an isothermal temperature distribution (Evans et al. 2001) In this paper we present a near-infrared color excess study of L694–2, using observations made at the ESO NTT. These data probe the density distribution between radii of pc (6000 AU) to the outer edge of the globule at pc, where the core merges into a more extended distribution of gas.
2 Observations and Data Reduction
2.1 The Near-Infrared Color Excess Technique
We provide here a brief review of the Near-Infrared Color Excess technique for measuring the structure of a dense core. For a more detailed description of the method, the reader is referred to Lada et al. (1994) and Harvey et al. (2001).
The basic method is to measure the near-infrared color excess for stars background to a dense core:
| (1) |
where is the intrinsic color of the star. The color excess is directly proportional to the dust column density. Thus color excess may be converted to gas column density via the near-infrared extinction law and an assumed gas-to-dust ratio. These column density estimates can be used to determine the overall density structure of the obscuring core.
In practice, the method does not require a knowledge of the intrinsic colors of the individual extincted stars. The proximity of the near-infrared filters to the Rayleigh-Jeans region of the spectrum for main sequence and giant stars means that the intrinsic colors are small, (Koornneef 1983). A statistical correction to their observed colors may be obtained empirically from the background stellar population (provided it is sufficiently spatially uniform).
2.2 NTT Observations
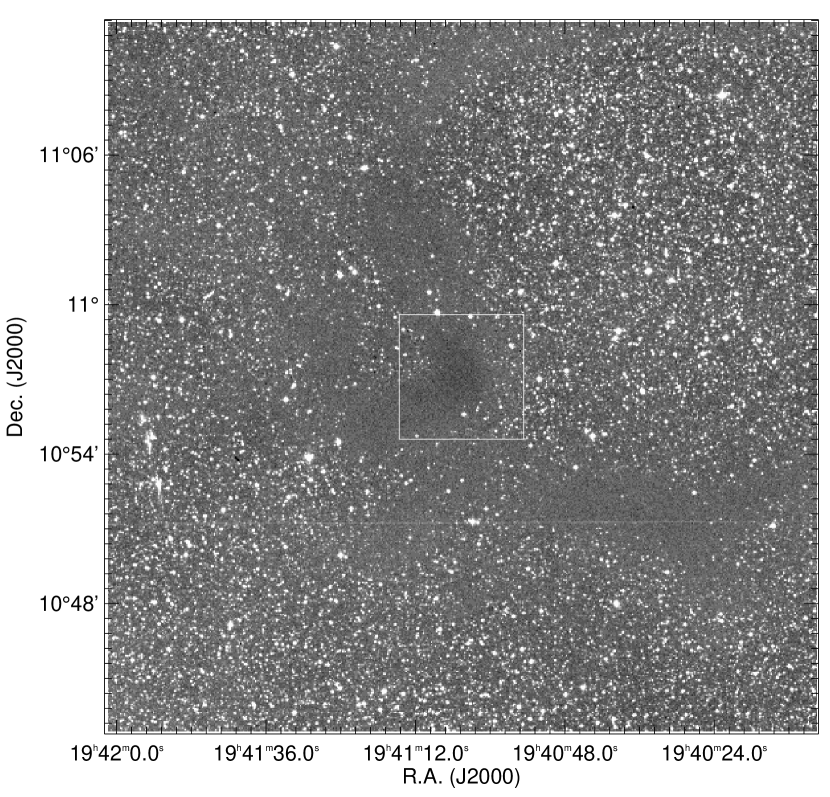
Observations of L694–2 were made on 2001 June 8 using the Son of Isaac (SofI) infrared camera on the ESO NTT. The SofI camera has pixels with size , giving a field of view. Each basic observation consisted of a mosaic of ten dithered sub-images, each with a total exposure time of 30 seconds, made up of 5 co-adds of 6 seconds. Dithering offsets were randomly chosen within a box. Observations were made with filters J, H, and Ks111 The Ks filter is medium-band version of the standard K filter, that avoids both the atmospheric absorption feature at 1.9 m and radiation from the thermal background beyond 2.3 m. Figure 1 shows a Digital Sky Survey (DSS) image of the L694–2 region with the NTT observed field indicated.
The data reduction and calibration was done in IRAF following the standard dark/flat/sky subtraction procedures, using a running flat. The typical seeing during the night was .
2.2.1 Photometry
Stars were identified in each image using the SExtractor program. Photometry was performed for all non-saturated stars using the apphot package in IRAF. A series of 3, 4, and 5 pixel apertures was used for every star. Aperture corrections were calculated for each aperture based on the seeing in the image using a regression to aperture corrections calculated for 23 previous observations with the NTT (Huard, private communication). While the 4-pixel aperture was used to produce the final photometry catalogues, the combination of the three measurements was used to eliminate spurious detections and blended stars (roughly 4% at H, Ks), based on whether the measurements were consistent with the predicted uncertainties at a 1.5 level.
Due to a not perfect alignment of the Large Field objective on the NTT, stellar images are radially elongated in the Northern part of the field of view. This elongation affects a strip of about 150 pixels and smoothly disappears moving toward the center of the field. Although this distortion does not create astrometric problems, it does mean that aperture photometry with a constant aperture correction will lead to systematic errors in the magnitudes of the stars in the affected region. We have dealt with this effect by applying additional spatially dependent aperture corrections. Each image was divided into a grid, and we calculated the ratio of the median FWHM in each region to the median FWHM in the Southern (bottom) half of the image. The results were consistent between the three filters, and the most conservative (smallest) value was taken for each region in the grid. The resulting grid of spatially dependent seeing FWHMs was used to calculate the appropriate additional aperture corrections in each region. The additional correction are zero in the Southern half of the images, and are largest in the four Northern-most regions, where the FWHM of the point-spread function is typically 20% larger. In all cases, the corrections are less than 0.06 magnitudes in size for the 4-pixel aperture, and the colors are even more robust, with largest correction of only .
The World Coordinate System in the images was fixed using the imwcs routine written by Doug Mink and stars from the US Naval Observatory A2.0 Catalog (Monet et al. 1998). The coordinate system is accurate to within an arcsec in RA and Dec. Finally, correct zeropoints were calculated using 182 matches in the 2 Micron All Sky Survey (2MASS) point source catalog. The registration with the 2MASS zeropoints is accurate to % in each filter. The 2MASS zeropoints are themselves accurate to a similar level.
The limiting magnitudes are 19.5 at J, 18.9 at H, and 18.5 at Ks, corresponding to a 0.25 magnitude error limit (signal to noise of 4) and a completeness of roughly 80%. The final photometry catalog contains 1451 stars detected at both H and Ks.
2.3 Reddening Law and Conversion between CIT and SofI/NTT Colors
Carpenter (2001) provides extensive conversion relations between 2MASS colors and magnitudes with those for other filter systems. Of particular interest to us here are the conversion to the ESO filter system (as used for our observations) and the California Institute of Technology (CIT) filter system (as used during our extinction study of B335). Conversion relations are also presented in Bessell & Brett (1988). Unfortunately, both the Carpenter and Bessell & Brett conversions are derived over a very small range in colors, generally , and perhaps can not be trusted for the reddest stars in our catalog.
For the purposes of the present study, we divide our attention to two issues concerning the photometric systems: 1) how the intrinsic colors of stars in our catalog relates to their on the CIT system; 2) how the color-excess is related to on the CIT system. The 2MASS conversion relations are sufficient to address (1), while (2) can be investigated by studying a color-color diagram of the stars in our study. At the low colors () intrinsic to main sequence and giant stars, the conversions from our instrumental colors to the 2MASS system are negligibly small compared to the systematic uncertainties (), due to our registration with 2MASS zeropoints. For the intrinsic colors (ie , ), the transformations between our colors and the CIT system are therefore:
| (2) | |||||
| (3) |
with an uncertainty of .
Figure 2 shows a color-color diagram for the subset of stars in the catalog with signal-to-noise of in each filter. The solid lines on the plot show the loci of unreddened main sequence and giant stars, while the two dashed lines show the expected reddening zone for these stars, using the standard reddening relations (Rieke & Lebofsky 1985), assuming and — an extrapolation of the low-color transformations. The reddening vectors follow the stellar colors remarkably well, even out to a color of . This suggests that the reddening law can be modified easily to a form using , while introducing little extra systematic error compared to that intrinsic to the reddening law itself.
3 Results and Analysis
3.1 The Background Population Mean Color and Dispersion
The DSS image of L694–2 in Figure 1 shows that the core is associated with an extended filamentary structure of extinction. This lower level extinction extends away from the core towards the South-East and the North. To characterize the background population, we therefore study the stellar properties in the Western half of the images, considering only stars that are more than from the peak of the mm-wave emission. This minimum radius was chosen on the basis of minimizing any remaining extinction, but retaining enough stars to draw reliable conclusions about the background properties. This “background” region contains a total of 221 stars detected at both H and Ks. These stars have mean color of and standard deviation of .
The mean color is somewhat larger than expected for an unreddened stellar population, since the intrinsic colors of main sequence and giant stars span the narrow range , and suggests that the stars in question are not entirely free from extinction. This conclusion is also supported by comparison with our results for the stellar background near B335, a globule that lies very close to L694 on the sky ( away), and is probably even associated with the same parent molecular cloud. The mean color and standard deviation for the stellar population at a distance of between and 3’ from the B335 center are and , which transform to and . Those values are very similar to the results found here. Off field images in the B335 vicinity showed that the true background properties became and , corresponding to and . As a test for similarity between the L694 and B335 background, we have compared the luminosity functions for the L694 “background” with the deep H-band luminosity function that was calculated in the B335 study ( stars arcmin-2, for ). The luminosity functions are entirely indistinguishable to within the counting noise. We therefore conclude that the B335 background properties represent a reliable measure of the background to L694, and adopt those properties in favor of the values calculated for the stars near the Western edge of the L694 image.
3.2 Color Excess Distribution near L694–2
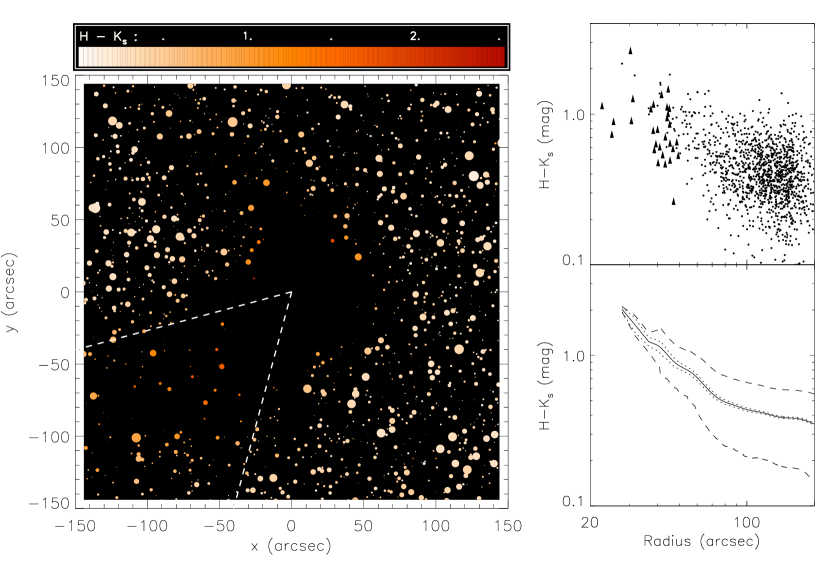
Figure 3 conveys much of the information from the NTT/SofI observations of L694–2. The left-hand plot is a pseudoimage in that the two axes are spatial, the apparent brightness of a star at H-band determines its “size”, and the value of its color determines its “color”. The upper right-hand plot displays the radial dependence of the colors out to (0.24 pc at 250 pc distance) from the center. The lower right-hand plot shows the radial colors convolved with an annular Kernel that is a Gaussian of logarithmic width 10% in radius, in order to better highlight the profile of the colors. Superposed are the standard deviation (dashed line), and standard error (dotted line) at each convolved point, the former indicating the spread of colors at each radius, and the latter indicating the uncertainty in the mean color at each radius. The origin in every plot is given by the position of peak emission in the N2H+(1–0) spectral line measured at the Berkeley Illinois Maryland Array (BIMA) by Jonathon Williams and collaborators (unpublished observations): R.A.=19:41:04.44, Dec.=10:57:00.9 (J2000). The uncertainty in the position of this peak is around . As can be seen from the pseudoimage, the region of highest column density is extended towards the South-East corner of the image. The region is marked in the image with dashed lines. This structure is also visible in the DSS image of the region in Figure 1, and is associated with an extended filamentary structure of gas. To prevent confusion, stars within this region have been omitted from the radial-color plot. Of the 1451 stars in the image detected at H & K with , 199 stars have impact parameters smaller than or pc, of which 14 lie in the “bar” region. The detected star closest to the N2H+ peak is at (0.034 pc) distance. This star is also the reddest in the sample and has color , corresponding to over 30 mag of equivalent visual extinction. In addition there is a star at impact parameter (0.036 pc) that is well detected at K, but too red to be detected at H. Based on the assumed H-band limit of 18.9, where the magnitude error is , this star provides a lower limit of ().
The major features of Figure 3 are: (1) a strong gradient in the colors as one approaches the N2H+ peak; (2) many fewer stars detected close to the center; (3) a central region of column density that is so high that it cannot be penetrated; (4) reddening in the stars changing behavior and flattening off beyond about or pc, apparently the boundary/edge of the dense core and a more extended distribution of gas; and (5) regions of high color excess that extend to the image edge in the South-East, and part-way to the image edge in the North — the shape of these regions match the profile of L694–2 in the DSS image, and highlight the somewhat filamentary nature of the L694 region.
3.3 Theoretical Models of the L694–2 Density Distribution
We describe several theoretical models for the density distribution of L694–2 and evaluate the success of these models in light of the extinction data. The models considered are not meant to comprise an exhaustive list. They include Bonnor-Ebert spheres, inside-out collapse, simple power law descriptions, and Plummer-like models. We also discuss filamentary models in the context of departures from spherical symmetry.
3.3.1 Inside-Out Collapse Models
There is a substantial literature of theoretical work by Frank Shu and colleagues describing the density structure of collapsing dense cloud cores, starting from the initial condition of a singular isothermal sphere (SIS). The density distribution of the SIS falls off as , where is the radius, with the normalization of the density determined by the effective sound speed. For L694–2, Lee et al. (2001) have measured the FWHM of the N2H+ line to be km s-1. If we assume a central temperature of 9 K based on the models of Evans et al. (2001), then this suggests an effective sound speed of km s-1 with a turbulent component of km s-1. The static initial condition in the inside-out collapse model is therefore given by:
| (4) | |||||
| (5) | |||||
| (6) |
where the conversion to a molecular hydrogen number density assumes a mean molecular weight of 2.3.
The simplest scenario is the spherically symmetric collapse (Shu 1977). In this model, a spherical wave of collapse propagates outwards from the center at the effective sound speed. The radial distance that the wave has traveled, sometimes called the infall radius, is the only additional parameter that defines the density distribution. Inside the infall radius, conditions approach free fall, with the density taking the asymptotic form . Harvey et al. (2001) describe deep near-infrared extinction measurements toward B355, arguably the best protostellar collapse candidate. This system, which contains a deeply embedded young stellar object, exhibits molecular line profiles well fit by inside-out collapse (Zhou et al. 1993, Choi et al. 1995). The shape of the density profile determined from the deep extinction data provide the best evidence yet in support of inside-out collapse theory, in particular the fall off for the envelope and inner turnover towards free-fall. Recent observations of dust emission from B335 using mm-wave interferometry have shown that the inner density distribution is very close to , although the way in which the density asymptotes to this behavior does not quite agree with the exact details of the inside-out collapse model (Harvey et al. 2003).
In the inside-out collapse model, a central point source with luminosity is formed. For L694–2, the limits on the luminosity of any embedded point source of L⊙, combined with the extended nature of the inward motions inferred from molecular line mapping (Lee et al. 2001), are inconsistent with the inside-out collapse model. Nevertheless we consider this model due to its success in describing the density structure of B335.
3.3.2 Bonnor-Ebert Models
Bonnor-Ebert models are pressure-confined isothermal spheres, for which the solution remains finite at the origin (Ebert 1955, Bonnor 1956). In common with the singular isothermal sphere, the initial condition for inside-out collapse, they are solutions of a modified Lane-Emden equation (Chandrasekhar 1967):
| (7) |
where is the dimensionless-radius, is the (physical) scale-radius, and is a logarithmic density contrast, with the (finite) central density. Unlike the singular solution, the Bonnor-Ebert solutions do not diverge at the origin. Instead, the boundary conditions are that the function and its first derivative are zero at the origin.
The above equation can be solved by division into two first order equations which can then be tackled simultaneously using numerical techniques (in our case a 4th order Runge-Kutta method). There is a family of solutions characterized by a single parameter — the dimensionless outer radius of the sphere, . For a given sound speed and a particular choice of the shape of the density curve (i.e. ), there is one additional degree of freedom: the physical scale of the model. This additional degree of freedom has often been removed by implementing an additional constraint, for example by fixing the outer radius, or the total mass of the globule. However, if such a constraint is applied, it is important to make some estimate of its uncertainty, and take that uncertainty into account in the fitting process in order to properly interpret both the systematic and random errors in .
Configurations with dimensionless outer radius are unstable to gravitational collapse (Bonnor 1956). The gravitational collapse of Bonnor-Ebert spheres has been studied numerically by Foster & Chevalier (1993). They find that collapse begins in the flat inner region, with the peak infall velocity at the “shoulder” of the density distribution. The flow asymptotically approaches the Larson-Penston solution at the origin at the time of and prior to the formation of a central core, as material from the flat region collapses into the center. These large early accretion rates last for a short time. If the cloud is initially very centrally condensed (i.e. ) the later stages of infall closely resemble Shu’s inside-out collapse of a singular isothermal sphere.
Recently, Alves, Lada & Lada (2001) used the color excess method to study B68, a starless core, with data from the ESO NTT. The B68 system is much less centrally condensed than L964-2, and has much lower column density at the center (only about 30 magnitudes of equivalent visual extinction). The Alves et al. (2001) extinction map of B68 suggests that the density structure is well described by a Bonnor-Ebert sphere with dimensionless outer radius slightly in excess of critical: . A highly super-critical Bonnor-Ebert sphere was found to fit the near-infrared extinction in protostellar collapse candidate B335 (Harvey et al. 2001). The model, with was indistinguishable from the inside-out collapse model over the range in radius where stars were detected, pc or . Subsequent observations of dust emission with IRAM PdBI have shown power-law behavior () in the inner region and rule out the Bonnor-Ebert model. However, the Bonnor-Ebert sphere is a hydrostatic model, and since the central regions of B335 are clearly not in equilibrium (presence of YSO, outflow, infall), it is not surprising that the model does not accurately describe the inner density structure of B335. The physical interpretation of the inward motions detected in L694–2 by Lee et al. (2001) is unclear. If the motions represent a phase of condensation, then the density structure of the core may be well described by a supercritical Bonnor-Ebert model.
3.3.3 Power Law models
The singular isothermal sphere represents a special case of the family of power law models for density structure: . Other special cases include the free-fall model () and the logatropic model (), where the gas is governed by a logatropic equation of state (McLaughlin & Pudritz 1997).
Visser (2000) fitted a broken power law model to SCUBA observations of L694–2. The radial profile of the dust emission from the core was fit by an isothermal model that had a flat gradient in the inner regions ( for pc or ), surrounded by a steep envelope. No uncertainty in these power-law indices is quoted, but nevertheless the profile represents a very unstable arrangement of material, and is consistent with the large inward motions detected by Lee et al. (2001). The analysis is based on an assumed constant temperature distribution. However, recent modeling suggests the dust temperature will decrease towards the center of a starless core (Evans et al. 2001). This decrease in the temperature may be what causes the flattening in the emission profile in the inner regions, and a density profile that does not turn-over at all cannot be ruled out. The turnover radius measured by Visser should perhaps be construed as an outer limit, since a more physical temperature profile would inevitably produce a smaller value.
3.3.4 Plummer-like Models
The Plummer-like model is an empirical model suggested by Whitworth & Ward-Thompson (2001) that captures the essential observed properties of pre-stellar cores with a minimum of free parameters. These properties include: 1) density distributions that combine flat inner profiles (constant, to ) with steep outer profiles (up to ); 2) dynamical timescales that reproduce the short-lived (few yr) high accretion-rate ( M⊙ yr-1) nature of the class 0 protostellar phase, and the longer-lived (few yr) slower accretion-rate ( M⊙ yr-1) nature of the class I phase; 3) extended and roughly uniform velocity fields, km s-1 over pc ().
The model assumes that when a prestellar core becomes unstable against collapse at time t=0, it is static and approximates to a Plummer-like density profile (Plummer 1911), of the form:
| (8) |
The initial density is therefore uniform for , and falls off as for . This is similar to the broken-power law model fitted to L694–2 by Visser (2001).
Subsequent evolution of the model is calculated assuming a negligible internal pressure, with the cloud therefore undergoing free-fall collapse. Collapse proceeds analogously to the Foster & Chevalier simulations of collapsing Bonnor-Ebert spheres: a large initial accretion rate as material from the uniform density region collapses onto the origin (associated with the Class 0 phase), followed by a more sedate accretion of the steep envelope. During the collapse process the central density profile steepens, asymptotically approaching , but the outermost profile stays virtually unchanged. The velocity distribution is at early times peaked at the shoulder of the density distribution, but the inward motions in the central regions eventually reaches and exceeds this value after one free-fall time.
Whitworth & Ward-Thompson (2001) propose a fixed value of in the model in order to reproduce the relative lifetimes and accretion rates for the Class 0 and Class I phases, and point out that for the mass of the protostellar core will diverge due to an infinite reservoir of mass. However, in reality any core is likely to be pressure-truncated at some point by its interaction with the interstellar medium (c.f. Bonnor-Ebert sphere), which circumvents this theoretical problem with . Moreover, the observed dust-emission profiles of L694–2 (Visser 2001), and starless core L1544 (Lee et al. 2003) are better reproduced with a value of .
The model is highly optimistic in that it attempts to reproduce the density and velocity structure of pre-stellar, Class 0 and Class I sources. The model provides a useful framework for interpreting observations of pre-stellar cores, particularly of the inward velocity fields which cannot be explained in the context of a true (hydrostatic) Bonnor-Ebert sphere. In the case of Class 0 objects, the model is unable to reproduce the density structure of B335, the best studied of such sources, which has outer density profile that is very close to that of an isothermal sphere , and is significantly more shallow than that of the Plummer-like model.
3.3.5 Filamentary Models
The complex containing L694–2 provides an example of filamentary structure that is common to many molecular cloud complexes (see e.g. Schneider & Elmegreen 1979). Such structure can be produced by a variety of physical processes. Mechanisms that are well known to trigger star formation, such as cloud-cloud collisions, compression by a shell of a supernova remnant, and encounters with an ionization front surrounding an OB star all produce sheet-like cloud structures. Magnetic support might also result in an initially flattened cloud (e.g. Mouschovias 1976). Filamentary structures will probably result from the fragmentation of such sheet-like clouds (e.g. Larson 1985, Nagai et al. 1998). Observations of starless cores suggest that they are generally elongated in approximately a 2:1 ratio (Myers et al. 1991). This provides obvious motivation for investigating filamentary models, and is consistent with the picture of dense core formation in which a parent molecular cloud becomes flattened into a sheet, and fragments into filaments which then fragment further into dense cores.
The equilibrium structure of polytropic and isothermal cylinders has been studied by Ostriker (1964). The density is a function of the radial coordinate only: , where is the scale height that is equivalent to the scale radius in the Bonnor-Ebert analysis. The density is uniform near the axis of the cylinder but decays ever more rapidly with increasing radius, asymptoting to a power law of index for . Half the mass is encircled at a radius of . The filament is supported radially by pressure gradients, but is unstable in the direction along its axis. Contraction will proceed initially along this direction. For an isothermal filament, the length beyond which it becomes unstable to fragmentation is roughly four times the half-mass radius (Larson 1972, Bastien 1983).
It is interesting to note that the density distribution of the isothermal cylinder is a special two dimensional case of the Plummer-like model, with , (the value proposed by Whitworth & Ward-Thompson 2001), and with a physical basis for the normalization of the density profile. A cylindrical model can therefore reproduce the observational properties of pre-stellar cores that provided the motivation for the Plummer-like models. In addition, because the isothermal cylinder and the Bonnor-Ebert sphere both represent equilibria between self-gravity and gas pressure, the spherically averaged density profile of an isothermal cylinder can also mimick closely that of a Bonnor-Ebert sphere, in particular a flat inner region with a steeply falling envelope (Boss & Hartmann 2001). The recent success of the Bonnor-Ebert and Plummer-like models therefore provides strong encouragement for studying this type of model.
3.4 Fitting Model Parameters and Evaluating Fit Quality
We evaluate the goodness of fit for these various model density distributions by calculating a reduced , defined as:
| (9) |
where is the number of free parameters in the model being fitted, and the sum extends over a particular subset of stars taken from the total number detected in both H & Ks filters. The values of the observed color excess and the uncertainty are calculated using the properties of the unreddened stellar background population near B335 (see Section 3.1), assuming each star to have an intrinsic color of , with an uncertainty of :
| (10) | |||||
| (11) | |||||
where is the uncertainty in the observed color of a given star. This procedure implicitly assumes that the photometric errors () and the intrinsic colors both have Gaussian distributions. This is an adequate approximation to the actual distribution of background colors, and sufficiently good that the fitting results are not sensitive to it.
In order to include stars at low impact parameter that provide lower limits on (ie stars that are detected at K but not at H), we modify the sum to include any “limit stars” for which the lower limit on is not met. The color excess and uncertainty of these measurements are given by: , and , with for .
Since these models are non-linear in the fitting parameters, we analyze the uncertainty in the best-fit model parameters using a Monte Carlo technique known as the Bootstrap method (Press et al. 1992). Table 1 summarizes the results from the various analyses and these results are discussed below.
3.5 Spherically Symmetric Analysis
The radial variation of the colors in Figure 3 (South-East excluded) shows a change in behavior near or 0.1 pc (at 250 pc distance), apparently the boundary/edge of the dense core and the more extended distribution of gas. This “edge” is smaller than the extent of the core’s profile in dust emission measured by Visser (2000), but is consistent considering that the emission profile is an annular average that includes emission from the South-East extension of the dense core. To separate the behavior of the core from the more extended and diffuse gas, we restrict the fitting region to or pc from the nominal center of the L694–2 core, and exclude the wedge of angular size that is shown in the pseudo-image of Figure 3 as two dashed lines. The column density distributions for the various physical models invariably produce profiles that are either flat or concave-downwards when viewed on a log-log scale. The fact that the extended distribution of gas causes the color-excess profile to be concave-upwards beyond this edge, necessitates this conservative fitting region to prevent the extended extinction from biasing the density structure fit towards shallower profiles. This fitting region contains a total of 185 stars with measurements at both H & Ks. The origin for the spherically symmetric models is left as a free parameter in the following analysis.
Ideally one would like to separate the behavior of the core from the more extended gas distribution. An obvious approach would be to try to constrain a composite model that fits for the profile of the core, plus some additional constant screen of extinction along the line of sight. This would be akin to assuming that the more extended distribution of gas forms either a uniform level of extinction that covers all lines of sight, or perhaps a second envelope in which the L694–2 core is embedded. Unfortunately this type of model is in general difficult to constrain. The variation in colors at a given impact parameter is sufficiently large that there is too much degeneracy between the model profile and the screen extinction at the edge of the globule. Essentially, small variations in the screen level can produce very substantial (order of magnitude) variations in the inferred color excess at the outer edge of the core. In the case of the power-law models this makes it impossible to constrain a power-law index and extinction screen simultaneously. We address this problem by performing the fitting analysis for a given model with two different screens of extinction: a screen of zero (fits marked “a” in Table 1), that provides a lower limit on the steepness of a given model; and a screen of (fits marked “b”) that duplicates the mean extinction level away from the core itself (see Section 3.1).
The power-law model that best fits the extinction over the effective range in radius 0.03 pc0.10 pc () has index , with (Fit Ia). The number density normalization of the model is pc cm-3 (assuming standard reddening law and gas-to-dust ratio). The outer radius of the model is not constrained; the quoted fit is for an outer radius of 0.15 pc (), but any outer radius of pc () produces a statistically indistinguishable result. The offset of the central position is R.A., Dec. (corresponds to , in the pseudo image in Figure 3). With an additional screen of extinction the fitted slope is much steeper, , and the number density normalization at 0.1 pc radius is reduced to pc cm-3 (Fit Ib). The fit is improved (), and the offset of the central position is unchanged to within 1 .
For the Bonnor-Ebert models, the column density near the edge of the globule is not so sensitive to the fitting parameters as in the power law case. For these models it is possible to obtain a robust fit for an arbitrary extinction screen, but the preferred fit is for an extinction screen of zero. In fact for the screen of , the fit fails to constrain a model: a Bonnor-Ebert profile cannot be constructed that produces a steep enough slope over a large enough range in radius in the context of this physical scenario. The best fit Bonnor-Ebert model has (Fit IIa), scale radius pc (), and physical outer radius pc (). The center-to-edge density contrast corresponding to the fitted is , well in excess of the critical value. The reduced for this model is , with offset central position identical to that for the power-law model. Unlike the power law models, the Bonnor-Ebert model is based on theoretical argument, and has an intrinsic density scale that is related to the physical size of the model. For the sound speed of km s-1, and distance of 250 pc, the central number density of this model is cm-3, the mass is M⊙, and the external pressure is dyne cm-2. Note that the density, mass, and pressure, scale with sound speed and distance as: , , , respectively. In order to reproduce the normalization of the observed color-excess, the Bonnor-Ebert model must be scaled by a factor of 4.30. In the context of this model, the scaling factor must be related to the terms of our adopted conversion factors by:
| (12) |
The actual density, mass and pressure will therefore scale differently depending on how the factor of 4.3 is distributed amongst these scalings. We discuss possible implications of this required scaling factor later. Some subtleties involved in the fitting of Bonnor-Ebert models are discussed in the Appendix.
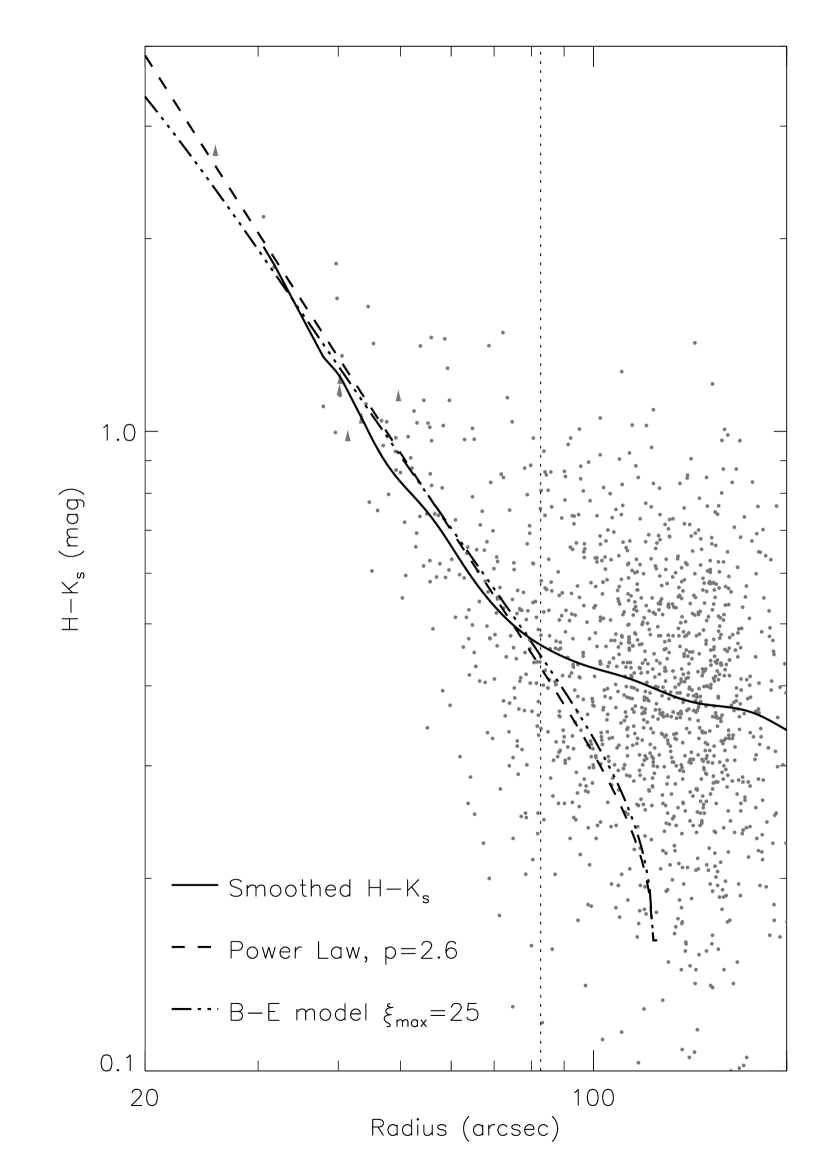
Figure 4 shows the radial dependence of the colors (as in Figure 3) with the best fitting profiles for the power-law (solid line) and Bonnor-Ebert (dashed line) models from Fit Ia and Fit IIa respectively. The fitting region is marked with a dotted line. The adopted origin in the plot is based on the results of Fit IIa (almost identical to that of Fit Ia). The two models are indistinguishable over the (0.03 pc0.10 pc) range in radius where there are stars to fit, as might be expected from their almost identical values of . Only at radii (0.024 pc) do the two models begin to diverge significantly, due to the fact that the profile of a Bonnor-Ebert sphere begins to flatten at roughly times the scale radius .
The inferred power-law index of is far steeper than the value of for the singular isothermal sphere. The inside-out collapse model is therefore inconsistent with the envelope density structure of the L694–2 core, in addition to being inconsistent with the extended nature of the infall in this starless source. On this basis, we have refrained from fitting this model.
The steep nature of the inferred density profile agrees well with the Visser (2001) measurement of , and with the profiles of other contracting starless cores, e.g. L1544, for which the dust emission profile can be reproduced by both a massively super-critical Bonnor-Ebert sphere (, Evans et al. 2001) or a Plummer-like model with outer power-law index (Lee et al. 2003). The case of L1544 demonstrates that a Plummer-like model can be constructed that is essentially indistinguishable from a super-critical Bonnor-Ebert sphere. The steep structure of L694–2 inferred from our extinction data is quantitatively consistent with the Plummer-like model. But the smallest radius probed by the data is right at the turn-over radius observed in dust emission by Visser (2001), and the innermost extinction measurements show no indication of any flattening in the density profile. We are therefore unable to constrain the remaining free parameters in the Plummer-like model, and . However, unlike the Plummer-like model, the turn-over radius for the Bonnor-Ebert sphere is intrinsically linked to the density profile in the outerregions based on the assumption of hydrostatic equilibrium. While the turn-over radius is unconstrained in the context of the Plummer-like model, it is constrained in the context of the Bonnor-Ebert model. The Bonnor-Ebert model that successfully matches the data (Fit IIa) has scale-radius of ( pc), that corresponds to the density profile turning over at around (0.02 pc). This is around a factor of two smaller than the turn-over radius inferred by Visser (2001). However, this discrepancy can be explained by Visser’s use of an isothermal temperature profile; more sophisticated modeling of the dust temperature distribution by Evans et al. (2001), indicates regions of relatively constant density that are systematically smaller (by factors of 0.5–0.9) than are obtained with the isothermal approximation.
3.6 Analyzing the Departures from Spherical Symmetry
The fact that the density profile is flat along the axis of the filament essentially allows the gas to support a steeper equilibrium density gradient in a direction perpendicular to this axis than can be achieved by a spherically symmetric model. The steep slope of the fitted power-law model that is well in excess of suggests that an isothermal cylinder might successfully reproduce the extinction data. Fitting a cylinder that is viewed end-on (line of sight parallel to the axis) provides an obvious starting point, and by introducing a tilt angle to the analysis permits an attempt to model the asymmetry observed in the L694–2 core.
The isothermal cylinder that best fits the same data sample as for the spherically symmetric model has scale height pc or , with (Fit IIIb). The central (on-axis) number density of the model is cm-3, and in order to reproduce the observed normalization of the extinction data with a standard gas-to-dust ratio, distance, etc., the cylinder must have length pc. The quality of this fit is comparable to that of the best fitting power-law model (Fit Ib) that includes the same screen of extinction. For the cylindrical model, a fit that includes no screen of extinction provides a poor description of the data ( as compared to for a power-law model). In the context of a model with no additional screen of extinction, the profile of the cylinder can only reproduce the overall slope of the extinction data with a large value of the scale height, but this introduces a curvature to the profile that is not found in the data.
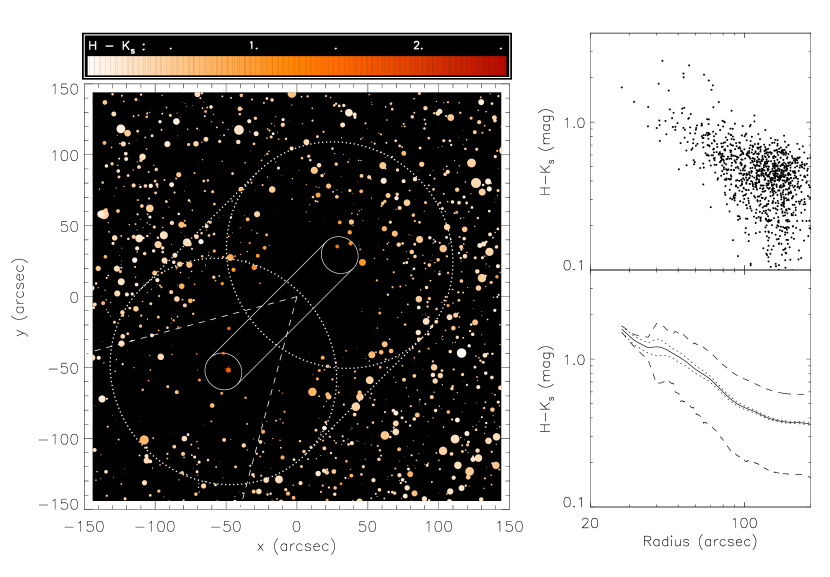
The success of the screened cylindrical model suggests an intriguing physical description of the L694–2 core. The core may represent a region of over-dense material that has condensed out of the extended filament of dense gas that is seen in the DSS image (Figure 1). Since the L694–2 core itself is clearly elongated along the South-East direction, the obvious next step in the model-fitting process is to try to constrain an isothermal cylinder of length that is tilted by an angle to the line of sight (in such a direction that its projected axis is along a South-East direction), and is embedded in a a more extended distribution of gas that produces an extra screen of extinction (i.e. as for Fit IIIb). The fitting region for this tilted model should be modified to include stars along the South-East direction, to test whether the tilted cylinder can successfully reproduce the observed asymmetry of the L694–2 core. For a dataset of all stars within pc () of the N2H+ peak, the best fitting model has scale height pc or , with (Fit IVb). The central (on-axis) number density is cm-3. The top of the tilted cylinder is offset from the mm-peak by R.A., Dec., although the top of the cylinder does not represent the peak column density of the model. The length and tilt angle of the cylinder are not constrained individually if one allows for uncertainties in the gas-to-dust ratio, distance etc. However, the projected length of the cylinder can be constrained: pc or , with the scaling given by . Figure 5 shows schematic diagrams of the 3-D geometry of this best fit tilted cylindrical model.
This model is remarkably successful at describing the extinction data from all parts of the L694–2 core. The dataset is only increased by 14 stars by the inclusion of the South-East region, and the is increased by around 0.12 from the best-fitting spherically symmetric models. Yet this represents the model (on average) reproducing the high extinction of all of these 14 stars to within 1 in their measurement uncertainties. Moreover, if one attempts to fit a spherically symmetric model to this same dataset, the fit is drastically worse: for a best-fit power law model with an extinction screen. This further heightens the degree of success with which a tilted cylinder can describe both the radial and azimuthal variation of the color-excess. A pseudo-image and the radial color dependence of a best-fit tilted cylinder model with length of pc is shown in Figure 6.
3.7 Discussion
The models that have been investigated have highly idealized geometries, and represent extreme pictures of the L694–2 core. Nevertheless, the success of these models is noteworthy, and provides a useful basis for interpreting the extinction observations, and drawing conclusions on the physical structure of the dense core. Figure 7 shows a plot of the molecular hydrogen number density profiles of the best fit models from Table 1. The various models have similar profiles in the region where color-excess measurements can be obtained (, 0.035 pc or 7500 AU). In the inner regions the profiles differ significantly; future observations of L694–2 in dust emission made with interferometers may therefore distinguish between the various interpretations of density structure.
The Bonnor-Ebert model is a hydrostatic equilibrium structure, so a fitted value of that is so far in excess of the critically stable value presents an obvious problem with a Bonnor-Ebert description of L694–2. The analysis does indicate that the distribution of material in L694–2 is very unstable to gravitational collapse, a conclusion that is consistent with the strong infall signatures observed in molecular spectral lines. Including an additional screen of extinction, as might be expected since the L694–2 core is clearly embedded in a more extended distribution of gas, causes the fit for a Bonnor-Ebert model to fail. Essentially this model is unable to reproduce the steep slope of the inferred density profile if any additional extinction is present.
The Bonnor-Ebert model provides a description of the dynamical state of the core that is absent from the simple power law models. Unfortunately, the normalization of these models differs substantially from what is observed in the L694–2 core (). Remarkably, the difference in the normalization between observation and theory is quite similar to that found in the study of B335, a core that is likely associated with the same parent molecular cloud as L694–2 ( for an inside-out collapse model, for a Bonnor-Ebert sphere).
The origin of this required scaling presented a difficult problem in the B335 study, since it is hard to attribute such a large discrepancy to any one stage in the conversion from density to color-excess. However, the present study suggests an intriguing explanation for the surprisingly high extinctions observed in these cores, namely that the discrepancy is simply a result of the cores having larger masses than predicted by the spherically symmetric theory, perhaps with B335 representing simply a later stage to which the L694–2 core will eventually evolve. The L694–2 core has formed out of a filament of dense gas, and our modeling suggests that it has prolate structure, with the major axis lying close enough to the line-of-sight that much of the mass is missed by analysis that assumes a symmetry between the profile of the core in the plane of the sky, and the profile of the core along the line-of-sight. The infalling motions inferred from molecular spectral lines by Lee et al. (2001) represent motions along the line of sight. If the motions arise in the core and not the surrounding envelope of material, then the strength and orientation of these motions is consistent with our hypothesis, since a prolate core is most unstable to collapse along its major axis.
The relation of the L694–2 dense core to the associated lower-density filament seen in the DSS image is interesting: the core appears to be elongated along the line of sight, while the filament appears to be elongated in the plane of the sky. A simple explanation for the origin of such this system is as follows. Suppose a low-density filamentary cloud is extended in the plane of the sky. The cloud has some angular momentum and is very slowly rotating about an axis perpendicular to its long direction. A small elongated region of the cloud condenses while conserving its angular momentum, therefore turning faster than the rest of the cloud. The result is a short dense filament whose major axis is rotated with respect to the long axis of its lower-density parent filament, which has become “kinked”. In the L694–2 case, the short dense segment seems to lie mostly along the line of sight.
Theoretical argument and numerical simulation both suggest that an un-magnetized filament will be unstable to fragmentation if its length exceeds about four times its half-mass radius. The half-mass radius for the fitted tilted cylindrical model of the L694–2 core is pc (), which suggests a maximum stable length of only about pc. This means that for the standard conversion factors, the length of the fitted cylinder is such that it should fragment into two or more pieces at some stage in the future (or possibly should have already done so), unless some source of support such as a magnetic field acts to prevent this process. If fragmentation of the L694–2 core does not occur, then future evolution should produce a more spherically symmetric core, with a mass that is larger than would have otherwise been expected. Subsequent collapse of this core might resemble that observed in B335.
This hypothesis requires a special orientation of the magnetic field in the L694–2 and B335 cores, both to support the cores, but also to prevent the support from affecting the observed molecular line widths. Although this may seem contrived, the orientation of B335 is well known to be special, with the outflow lying within of the plane of the sky (Hirano et al. 1988). Similarly, our modeling of the color excess near L694–2 suggests a prolate core oriented close to the line-of-sight ( for pc). Observations of optical and infrared polarization of stars that are embedded in, or background to filamentary molecular clouds show that the direction of the magnetic field is often related to the direction of the axis of the filament; in some cases the two are parallel (e.g. Ophiuchus, Goodman et al. 1990), while in others the two are perpendicular (e.g. Taurus, Heyer et al. 1987). Both cases can be explained by recent modeling of the production of gas filaments by the fragmentation of magnetized sheets (Nagai et al. 1998). In these models, the magnetic field delays the growth of perturbations along a particular direction, causing the production of filamentary structures. The field provides support to the filament, and increases the critical (fragmentation) length of the filament from the un-magnetized case. If the field in L694–2 is oriented in the plane-of-the-sky, perpendicular to the major axis of the core, then the support provided along the major-axis would be maximized. Since the turbulent velocity in L694–2 is low ( km s-1 compared to the thermal speed of km s-1), Alfven waves should not be strongly driven, and not add appreciably to measured line-widths. Such a field configuration might therefore inhibit fragmentation but remain essentially undetectable in observations of molecular spectral lines.
To affect the fragmentation scale of L694–2, the field strength would need to be such that the magnetic pressure () is greater than or comparable to the gas pressure at the axis of the filament (). For the standard conversion factors, this suggests:
| (13) |
Such a minimum field strength is large by typical standards of the Interstellar Medium. For instance, Crutcher & Trowland (2000) measured a line of sight magnetic field of G in starless core L1544 using the Zeeman effect in lines of OH, although any non-zero inclination angle will result in the true field being stronger. Although the L1544 field is already much higher than the typical upper limits found for other dark clouds (Crutcher et al. 1993), a field of this required strength in the L694–2 core is certainly conceivable. Moreover, if any of the required scaling can be attributed to systematic error in the conversion factors, then the minimum field strength will be lowered. For instance, a gas-to-dust ratio in the L694–2/B335 region that is half the “standard” value in the ISM (a variation that is typical in the ISM), then the inferred length of the tilted cylinder (Fit IVb) will be reduced by roughly the same factor of two, and the cylinder would be marginally stable to fragmentation even in the absence of a magnetic field.
4 Summary
We present a near-infrared extinction study of the contracting starless core L694–2 using observations made with the ESO NTT. In summary:
-
1.
The image of L694–2 shows a dramatic fall off in the number of stars detected toward the location of peak millimeter-wave (N2H+) emission, where the extinction increases because of the central concentration of dense core material. The image contains a total of 1451 stars detected in both H & Ks bands, with 199 with impact parameters within (0.1 pc), the innermost of which is at (0.034 pc) from the nominal peak. The photometry shows a steep gradient in the colors towards the center. The radial profile of the color excess demonstrates a change in behavior at a radius of around (0.1 pc): the profile flattens, apparently associated with the boundary/edge of the dense core and a more extended distribution of gas in which the core is embedded. In addition the core exhibits departures from spherically symmetry, with the regions of highest color excess extending to the South-East, and somewhat towards the North, following the shape of L694–2 visible at low extinction levels in the DSS image. These asymmetries are apparently connected to the filamentary structure of the extended gas in the region.
-
2.
We compare a series of models of dense core structure to the extinction data, including spherically symmetric power-laws, and Bonnor-Ebert spheres. Based on the radial profile of the color excess, only stars within (0.1 pc) of the peak are included in the fit to prevent the extended extinction from biasing the fitting results towards models with shallower slopes. In addition, for the spherically symmetric analysis, we exclude stars that fall within a small wedge to the South-East ( wide), to avoid biasing the fits with the extinction component that extends in this direction. It is not possible to fully separate the contribution to the color excess from the core from that due to additional extended material. We therefore perform two fits for each type of model, one assuming extinction only from a model core, and the second assuming extinction from a core embedded in a screen of thickness , chosen to reproduce the colors of stars at the edge of the image where the color excess is smallest (i.e. from the center). The best fit single power law model has index (1 ), steeper than the value of for an isothermal sphere. An unobscured Bonnor-Ebert sphere provides an indistinguishable fit to the data; the dimensionless outer radius is . Including an additional uniform extinction component increases the steepness of the inferred core profiles. The best fit power law index increases to , while a Bonnor-Ebert model cannot be constructed that produces a steep enough slope over a large enough range in radius. The unobscured Bonnor-Ebert model must be scaled by a factor 4.3 to match the observed color excess. Remarkably, this difference in normalization between observation and theory is similar to that found in the extinction study of B335, which is likely associated with the same molecular cloud.
-
3.
The inferred power law index suggests a cylindrical model for the density distribution, which can support a large density gradient perpendicular to its cylindrical axis. An embedded cylinder viewed along the axis with scale height pc () provides an equally good fit as a spherical power law model. A tilted cylinder can also reproduce the asymmetry of the L694–2 core, matching the color excess of stars in the South-East wedge to within 1 on average. This tilted cylinder has projected length pc (), with scale height pc (). For standard values of the conversion factors, the model must be scaled by a factor of to match the observed color excess.
-
4.
The cylindrical model provides an intriguing explanation for the surprisingly high extinctions observed in the L694–2 core, and perhaps also the B335 core: the discrepancy may result from larger masses than indicated by spherically symmetric theory, perhaps with B335 representing a later stage to which the L694–2 core will eventually evolve. The large scale view suggests that L694–2 has formed out of an extended filament of dense gas, and our modeling suggests a prolate structure, with the major axis lying close enough to the line-of-sight that much of the mass is missed by assuming symmetry between the profile of the core in the plane of the sky, and the profile of the core along the line-of-sight. The inward motions in L694–2 inferred from molecular spectral lines, which represent motions along the line of sight, might reflect the fact that a prolate core is most unstable to collapse along the major axis. If the cylinder is magnetized, with static field G in the plane of the sky, then fragmentation of this cylinder could be prevented. The low turbulent velocity measured in L694–2 should prevent Alfven waves from contributing to the observed widths of molecular spectral lines, and the support would remain essentially undetectable. Moreover, if the gas-to-dust ratio in this region is lower than the “standard” value, then fragmentation might be avoided at a lower field strength.
-
5.
Future observations of dust in emission made with interferometers will measure the innermost structure of the L694–2 core that can not be probed by dust extinction. In particular, the dust emission structure will provide further tests of the cylindrical model hypothesis.
Appendix A Subtleties in Fitting Bonnor-Ebert Models
It is interesting that both the scale-radius and outer-radius for the fitted L694–2 Bonnor-Ebert model (Fit IIa) are better constrained than the dimensionless radius of the sphere, when the three parameters are intrinsically linked by the relation: . The Bonnor-Ebert solution is a dimensionless curve that extends from the origin to a cutoff at the dimensionless outer radius . Scale is added by including a physical size for the curve (either the scale radius or the outer radius). A given density profile over a fixed range in radius can therefore be reproduced by a model with a larger physical size and a larger , thereby assuring that we are still looking at the same region of the dimensionless curve. Such a model will have the same value of the scale-radius .
In the model fitting procedure, what is actually observed is the integrated profile of the globule, and this is altered slightly due to the contribution from the extra material at the edge of the globule, which produces a more shallow profile. However, except for right at the edge of the globule, the effect of the extra material on the shape of the profile can be offset by reducing slightly the scale-radius of the model (or increasing a little more), which raises the degree of central concentration and steepens the profile a little. It is the change to the profile near to the outer radius from this extra material that allows the outer radius and to be constrained by measurements of an extinction profile.
To summarize, despite the fact that the family of Bonnor-Ebert spheres are characterized by the parameter , it is the parameter , the scale-radius, that is the more robust result of a fit to an observed profile. The outer radius of a globule has some inherent and non-zero uncertainty, due to possible confusion with extended structure, nearby sources or interaction with the ambient medium or interstellar radiation field (ISRF). The effect is that the physical curvature is inevitably better defined than the dimensionless curvature, since the latter suffers the additional contribution from the uncertainty in the radius (in order to make the observed profile dimensionless, the radii must be divided by the outer radius).
When Bonnor-Ebert models were fitted to B68 (Alves et al. 2001) and B335 (Harvey et al. 2001), fixed outer radii were assumed. The uncertainty in the assumed outer radii were not included in the final assessment of the fitted profiles, which will lead to underestimated errors in . The systematic uncertainty in the assumed radius will also lead to systematic uncertainties in , which were not accounted for in these studies. In both studies the radial variation of the colors shows that the adopted outer radii represent essentially lower limits to the true outer edge of the globule, in the B68 case because the edge is assumed to occur at a visual extinction of , and in the B335 case because the edge is chosen to coincide with a low-power contour of molecular gas emission. Allowing the radius of the globule to vary as an additional parameter will therefore lead to a larger fitted value of , even for a small increase in the outer radius. The uncertainty in will also increase. In the case of B335, the quoted is so large (and already uncertain at a level that is similar to the uncertainty in the outer radius) that realistic changes in the outer radius cannot lead to a qualitative change in the picture — the fitted will increase even further from the stable value, and although the fitted may decrease somewhat, the model would remain heavily resolved by the IRAM PdBI, and therefore be unable to reproduce the observed mm-wave dust emission (Harvey et al. 2003).
For B68 however, the conclusions are less clear. The quoted value of leads to the interpretation that the globule is almost perfectly perched at the threshold for stability. A small change in the inferred might alter this conclusion. We therefore apply our more detailed model-fitting procedure to the Alves et al. (2001) extinction data. Unlike the L694-2 data, the B68 data are azimuthally averaged in bins of width centered on the position of peak column density. The small column density of the B68 globule essentially allows the profile to be measured at all radii, from out to where no extinction can be discerned.
A fit to the data within a conservatively chosen region , with outer radius and as free parameters returns essentially the Alves et al. result: , , with . However, with a different fitting region, the inferred model parameters are slightly changed. The value of provides a useful tool to select the appropriate fitting region. As the region is extended from towards the edge of the globule, the minimum in remains fairly constant initially, but then jumps to 2.1 for , and continues to increase, reaching a value of almost 5 for a fitting region of — the largest radius at which any extinction was measurable. This behavior is caused by the profile beginning to depart from the Bonnor-Ebert profile at the edge of the globule, perhaps due to interaction with the ISRF. We therefore suggest a fitting region of is most appropriate (included data point at largest radius is at ). In particular this choice happens to coincide with the inferred outer radius of the Bonnor-Ebert model, as well as the radius where the visual extinction reaches unity. The best fit model parameters for this region are , , with . The increase in the minimum in moving to this larger fitting region is justifiable, since it is equivalent to that for a model where the parameters differ by only 1/2 from their optimal values. That the Bonnor-Ebert model is so tightly constrained results from the well defined edge to the B68 globule, in stark contrast to the extended structure associated with L694–2. However, the best-fit model with represents a slightly more unstable configuration than the value calculated by Alves et al. (2001).
The physical properties of this model differ at most only slightly from those of the Alves et al. model. The inferred mass of the globule is M⊙ for a distance of 125 pc, and the standard gas-to-dust ratio. The inferred central number density is increased by roughly 2.5%, but to the level of precision in the factors required for the conversion it is essentially unchanged cm-3. The external pressure is 6% smaller, dyne cm-2, for a kinetic temperature of 16 K. Hotzel, Harjo & Juvela (2002) have proposed a smaller distance to B68 of 85 pc and a lower kinetic temperature of K. These changes lead to a smaller inferred mass of the globule, M⊙, a higher central number density cm-3, and a smaller external pressure dyne cm-2.
References
- (1)
- (2) Alves, J.F., Lada, C.J., & Lada, E.A. 2001, Nature, 409, 159
- (3)
- (4) Alves, J.F., Lada, C.J., & Lada E.A. 1999, ApJ, 515, 265
- (5)
- (6) Alves, J.F., Lada, C.J., Lada E.A., Kenyon, S.J., & Phelps R. 1998, ApJ, 506, 292
- (7)
- (8) André, P., Ward-Thompson, D., & Barsony, M. 2000, in Protostars and Planets IV, eds. V. Mannings, A.P. Boss and S.S. Russell, (Tucson: University of Arizona Press), p. 51
- (9)
- (10) Bastien, P. 1983, A&A, 119, 109
- (11)
- (12) Beichman, C.A., Myers, P.C., Emerson, J.P., Harris, S., Mathieu, R., Benson, P.J., & Jennings, R.E. 1986, ApJ, 307, 333
- (13)
- (14) Benson, P.J., & Myers, P.C. 1989, ApJS, 71, 89
- (15)
- (16) Bessell M.S., & Brett, J.M. 1988, PASP, 100, 1134
- (17)
- (18) Bok, B.J., & Cordwell, C.S. 1973, in Molecules in the Galactic Environment, ed. T. Gehrels (Tucson: University of Arizona Press), p. 288
- (19)
- (20) Bonnor, W. 1956, MNRAS, 116, 351
- (21)
- (22) Boss, A.P., & Hartmann, L.W. 2001, ApJ, 562, 842
- (23)
- (24) Carpenter, J.M. 2001, AJ, 121, 2851
- (25)
- (26) Chandrasekhar, S. 1967, in An Introduction to the Study of Stellar Structure, (Dover, Toronto), p. 156
- (27)
- (28) Choi, M., Evans, N.J.II, Gregerson, E.M., Wang, Y. 1995, ApJ, 448, 742
- (29)
- (30) Ciolek, G.E., & Basu, S. 2000, ApJ, 529, 925
- (31)
- (32) Crutcher, R.M. & Troland, T.H. 2000, ApJ, 537, 139
- (33)
- (34) Crutcher, R.M., Troland, T.H., Goodman, A.A., Heiles, C., Kazes, I. & Myers, P.C. 1993, ApJ, 407, 175
- (35)
- (36) Ebert, R. 1955, Z.Astrophys., 37, 217
- (37)
- (38) Evans, N.J.II, Rawlings, J.M.C, Shirley, Y.L., & Mundy, L.G. 2001, ApJ, 557, 193
- (39)
- (40) Foster, P.N., & Chevalier, R.A. 1993, ApJ, 416, 303
- (41)
- (42) Goodman, A.A, Bastien, P., Myers, P.C., & Ménard, F. 1990, ApJ, 359, 363
- (43)
- (44) Harvey, D.W.A., Wilner, D.J., Alves, J.F., Chen, H., Lada, C.J. & Myers, P.C. 2001, ApJ, 563, 903
- (45)
- (46) Harvey, D.W.A, Wilner, D.J., Di Francesco, J., Lee, C.-W., Myers, P.C., & Williams, J.P. 2002, AJ, 123, 3025
- (47)
- (48) Harvey, D.W.A., Wilner, D.J., Myers, P.C., Tafalla., M., & Mardones, D. 2003, ApJ, 583, 809
- (49)
- (50) Henriksen, R., Andre, P., & Bontemps, S. 1997 å, 323, 549
- (51)
- (52) Heyer, M.H., Vrba, F.J., Snell, R.L., Schloerb, F.P., Storm, S.E., Goldsmith, P.F., & Storm, K.M. 1987, ApJ, 321, 855
- (53)
- (54) Hirano, N., Kameya, O., Nakayama, M., & Takakubo, K. 1988, ApJ, 327, 69
- (55)
- (56) Hotzel, S., Harju, J., & Juvela, M. 2002, å, 395, 5
- (57)
- (58) Jones, T.J., Hyland, A.R., & Bailey, J. 1984, ApJ, 282, 675
- (59)
- (60) Jones, T.J., Hyland, A.R., Robinson, G., Smith, R., & Thomas, J. 1980, ApJ, 242, 132
- (61)
- (62) Kawamura A., Kun, M., Toshikazu, O., Vavrek, R., Domsa, I., Mizumo, A., & Fukui, Y. 2001, PASJ, 53, 1097
- (63)
- (64) Koornneef, J. 1983, A&A, 128, 84
- (65)
- (66) Lada, C.J., Lada, E.A., Clemens, D.P., & Bally, J. 1994, ApJ, 429, 694
- (67)
- (68) Larson, R.B. 1985, MNRAS, 214, 379
- (69)
- (70) Larson, R.B. 1972, MNRAS, 156, 437
- (71)
- (72) Lee, C.W., Myers, P.J., & Tafalla, M. 2001, ApJS, 136, 703
- (73)
- (74) Lee, C.W., Myers, P.J., & Tafalla, M. 1999, ApJ, 526, 788
- (75)
- (76) Lee, J.-E., Evans, N.J.II, Shirley Y.L., & Tatematsu, K. 2003, ApJ, accepted, astro-ph/0210330
- (77)
- (78) McLaughlin, D.E., & Pudritz, R.E. 1997, ApJ, 476, 750
- (79)
- (80) Monet, D., Bird A., Canzian, B., Dahn, C., Guetter, H., Harris, H., Henden, A., Levine, S., Luginbuhl, C., Monet, A.K.B., Rhodes, A., Riepe, B., Sell, S., Stone, R., Vrba, F., & Walker, R. 1998, The USNO-A2.0 Catalogue, (U.S. Naval Observatory, Washington DC)
- (81)
- (82) Mouschovias, T.Ch. 1976, ApJ, 207, 141
- (83)
- (84) Myers, P.C., Fuller, G.A., Goodman, A.A., & Benson, P.J. 1991, ApJ, 376, 561
- (85)
- (86) Myers, P.C., & Lazarian, A. 1998, ApJ, 507, 157
- (87)
- (88) Nagai, T., Inutsuka, S.-I., & Miyama, S.M. 1998, ApJ, 506, 306
- (89)
- (90) Ostriker, J. 1964, ApJ, 140, 1056
- (91)
- (92) Plummer, H.C. 1911, MNRAS, 71, 460
- (93)
- (94) Press, W.H., Teukolsky, S.A., Vetterling, W.T., & Flannery, B.P. 1992, Numerical Recipies in C, p. 691
- (95)
- (96) Reike, G.H., & Lebofsky, M.J. 1985, ApJ, 288, 618
- (97)
- (98) Schneider, S., & Elmegreen, B.G. 1979, ApJS, 355, 172
- (99)
- (100) Shirley, Y.L., Evans, N.J.II, Rawlings, J.M.C., & Gregersen, E.M. 2000, ApJS, 131, 249
- (101)
- (102) Shu, F.H. 1977, ApJ, 214, 488
- (103)
- (104) Shu, F. H., Adams, F.C., & Lizano, S. 1987, ARA&A, 25, 23
- (105)
- (106) Shu, F.H., Najita, J., Galli, D., Ostriker, E., & Lizano, S. 1993, in Protostars and Planets III, eds. E. Levy and J. Lunine (Tucson: University of Arizona Press), p. 3
- (107)
- (108) Tomita, Y., Saito, T., & Ohtani, H. 1979, PASJ, 31, 407
- (109)
- (110) Visser, A. 2000, Ph.D. thesis, University of Cambridge (UK)
- (111)
- (112) Visser, A.E., Richer, J.S., & Chandler, C.J. 2001, MNRAS, 323, 257
- (113)
- (114) Walmsley, M., Caselli, P., Zucconi, A., & Galli, D. 2001, in Proceedings of ESO workshop, The Origins of Stars and Planets: The VLT View, eds. J. Alves and M. McCaughrean
- (115)
- (116) Ward-Thompson, D., Motte, F., & Andre, P. 1999, MNRAS, 305, 143
- (117)
- (118) Whitworth, A.P., & Ward-Thompson, D. 2001, ApJ, 547, 317
- (119)
- (120) Zhou, S., Evans, N.J.II, Kompe, C., & Walmsley, C.M. 1993, ApJ, 404, 232
- (121)
| Fit | Model Density Distribution | Fit Region | Stars | Fitted Model Parameter(s) | |
|---|---|---|---|---|---|
| Ia | Power Law: | ; No “wedge” | 185 | 1.114 | |
| Ib | Power Law | ; No “wedge” | 185 | 1.063 | |
| IIa | Scaled Bonnor-Ebert | ; No “wedge” | 185 | ; pc; | 1.117 |
| IIIb | Cylinder (end-on) | ; No “wedge” | 185 | pc; pc | 1.072 |
| IVb | Scaled Cylinder (tilted) | 199 | pc; pc; | 1.190 |
Note. — For each Fit, we consider only stars within 0.1 pc or of the nominal center of L694–2, to avoid contamination from the more extended distribution of gas. For Fits Ia–IIIb, stars that occupy a wedge of angular extent centered along the South-East direction have not been considered in order to eliminate the elongation of the core in this direction from affecting the fit of these azimuthally symmetric models. Fits marked “#b” include an extra screen of extinction of .