Implications of the Universal Temperature Profile for Galaxy Clusters
Abstract
We study the X-ray cluster gas density distribution in hydrostatic equilibrium using the universal temperature profile obtained from recent simulations involving only gravitational processes. If this temperature profile is an indicator of the influence of gravitational processes alone on the intracluster medium, then the comparison of various X-ray parameters expected from this profile and the observed data would point towards any additional physics that may be required. We compare the entropy at and , the scaled entropy profile, the gas fraction at and the gas fraction profile with recent observations and discuss the implications of this temperature profile in light of these data. We find that the entropy imparted to the gas from gravitational processes alone is larger than previously thought. The entropy at for rich clusters is consistent with data, whereas the entropy at is still less than the observed values. We also find that the gas fraction in the inner region of clusters, expected from gravitational processes alone, is smaller than previously thought but larger than the observed data. It does show a trend with the emission-weighted temperature () as shown by data. We therefore find that the role of any additional non-gravitational process influencing the physical state of ICM would have to be revised in light of these findings.
keywords:
cosmology: theory—dark matter—galaxies: clusters: general—X-rays:galaxies1 Introduction
The formation of structures in the Universe is believed to be hierarchical, as primordial density fluctuations, amplified by gravity, collapse and merge to form progressively larger systems. This hierarchical development leads to the prediction of self-similar scalings between systems of different masses and at different epochs.
X-ray observations of the intra-cluster medium (ICM) provide an ideal probe to test these self-similar scalings. Observations however present a picture that is at variance with predictions from these self-similar scalings. The X-ray luminosity of low temperature (poor) clusters fall below the self-similar expectations, and the surface brightness profiles of these clusters are seen to be shallower than those of richer clusters. It is also instructive to view this in terms of the entropy of the intra-cluster gas, which in self-similar scaling should increase in a very simple scaling with the mean temperature of virialized systems, whereas observations show that gas in low temperature clusters have larger entropy than expected. Another probe of non-gravitational processes is the gas fraction by mass in these clusters. Observations show that the inner regions of poor clusters have less gas (compared to the total mass within those radii) than those of rich clusters.
These differences between theoretical expectations and observations have led to the emergence of a number of theoretical ideas to increase the entropy of the ICM by some non-gravitational process, especially in low temperature clusters, involving heat input from supernovae (Valageas & Silk 1999; Kravtsov & Yepes 2000; Wu et al. 2000), quasar outflows (Bower 1997; Loewenstein 2000; Voit & Bryan 2001; Nath & Roychowdhury 2001), gas cooling (Knight & Ponman 1997; Bryan 2000; Voit & Bryan 2001; Pearce et al. 2000; Muanwong et al. 2001; Wu & Xue 2002a; Davé et al. 2002) and accretion shocks (Tozzi & Norman 2001; Dos Santos & Doré 2002; Babul et al. 2002), though it appears that there are problems with many of them (Ponman et al. 2003 and references therein; hereafter PSF03).
A recent result from a very high resolution numerical simulation (Loken et al. 2002) offers a fresh look at the scaling laws expected from gravitational interactions. Loken et al. (2002) found a universal temperature profile for the ICM, when scaled to the emission weighted temperature, from the assumptions of pure gravitational evolution of the cluster gas, with no input from any additional non-gravitational processes of heating or cooling. Interestingly, this temperature profile is a good match to the observed universal temperature profile, leaving aside the very central regions () (De Grandi & Molendi 2002).
The interesting aspect of this temperature profile obtained from this simulation is that it has a core within which the profile is flatter than in the outer region. It has been earlier noted by Eke et al. (1998) that interactions between dark matter and baryons imparts some entropy to the gas providing it with a core (and making it deviate in the central regions from the self-similar expectations in which gas density is proportional to the dark matter density). The entropy imparted to the gas was, however, thought to be important only in the very central regions (),and observations of entropy at was thought to reflect other, non-gravitational influences, if there were any.
It is then important to determine the gas density profile corresponding to this temperature profile, assuming hydrostatic equilibrium, and determine the level of entropy obtained only from gravitational interactions, without the aid of non-gravitational processes. In this paper, we study various implications of this temperature profile, especially in light of the entropy problem mentioned earlier.
As we describe below, we find that the entropy imparted to the gas by gravitational interactions alone is larger than previously thought for poor clusters, even at radii exceeding , and this is the main result of the present paper. We begin with the description of the background dark matter density profile that is assumed (§2). We then determine the gas density profile assuming hydrostatic equilibrium in §3 and discuss various aspects of our result, including comparison with relevant data in §4. We end with a brief discussion of our results in §5.
We assume throughout the paper , , and which are the best fit parameter from WMAP (Spergel et al. 2003).
2 Universal dark matter density profile
The dark matter density profile, suggested by many high resolution - body simulations is well described by a self-similar form. We assume that the gas mass is negligible compared to the total dark matter mass and adopt this universal density profile for dark matter in clusters. The profile is expressed in terms of a characteristic radius (e.g., in Komatsu & Seljak 2002):
| (1) |
where is a normalization factor which represents a characteristic density at a characteristic radius, . This characteristic radius describes a typical scale at which the profile slope changes from the outer value to the inner value. The functional form of is given by
| (2) |
Here the parameter characterizes the shape of the profile. Since the dark matter density profile is self-similar, the dark matter mass profile is also self-similar. So, the dark matter mass enclosed within a radius is
| (3) |
where, is a non-dimensional mass profile given by
| (4) |
Here, the last equality is valid for which is the much used NFW profile (Navarro et al. 1996, 1997), the integral being evaluated by Suto et al. (1998).
The definition of the virial radius, , is the radius within which the total dark matter mass is confined, i.e., , where
| (5) |
is a dimensionless parameter called the ’concentration parameter’. Evaluating equation (3) at the virial radius, the normalization factor, , is fixed at;
| (6) |
The virial radius, is calculated with the spherical collapse model (Peebles 1980),
| (7) |
where the second equality comes from evaluating from equation (6). Here is the spherical over-density of the virialized halo within at , in units of the critical density of the universe at , . Following Komatsu & Seljak (2002), we assume a value for a cosmological model with and .
We follow Bullock et al. (2001) in adopting the approximation for as a function of the virial mass of the cluster. They give the median values of ‘c’ and also the deviations:
| (8) |
with reproducing the best-fit and and reproducing the and the values in the concentration parameter. These values of the concentration parameter are also consistent with the findings of Seljak & Huffenberger (2003).
The above set of equations specify the dark matter density profile of a particular mass cluster. Next, we turn our attention to the density profile of the gas in hydrostatic equilibrium with this dark matter distribution.
To compare our results with observations, which usually uses the radius where the over-density is 200, we compute this radius in each case and present our results in the terms of .
3 Hydrostatic equilibrium of gas and dark matter
Our aim in this section is to determine the density profile of the intra-cluster gas using the universal temperature profile (discussed later) and assuming that the gas is in hydrostatic equilibrium with the background dark matter potential.
The typically smooth morphology of the X-ray emission from the hot intra-cluster medium leads naturally to the hypothesis that the gas is near equilibrium, stratified along isopotential surfaces in a mildly evolving distribution of dark matter, gas and galaxies. This suggests that the assumption of hydrostatic equilibrium for such relaxed clusters is mostly justified.
3.1 Universal Temperature Profile of Gas
The “universal temperature profile” used for our calculation (Loken et al. 2002) is (normalized by the emission-weighted temperature):
| (9) |
where is the emission-weighted temperature of the cluster, , and on the radial range (0.04-1.0) . To determine the emission-weighted temperature from the cluster mass, we use a relation that arises from adiabatic evolution of the gas in cluster. Afshordi & Cen (2002) have shown that the observations of Finoguenov et al. (2001) of relation in clusters can be understood from gravitational processes alone. We therefore use this empirical relation () derived by Finoguenov et al. 2001:
| (10) |
where is the Boltzmann constant and has been calculated self-consistently by taking the total mass within the radius where the over-density is .
The main motivation of using this universal temperature profile is to see if this profile which arises just out of gravitational interactions alone in clusters predicts anything different from the previously used default temperature profiles from gravitational interactions alone. This temperature profile is a result of a high resolution simulation, without any input from non-gravitational processes, carried out by Loken et al. (2002) which makes use of a Eulerian-based, adaptive mesh-refinement code that captures the shocks that are essential for correctly modelling cluster temperatures (for details of the simulation, refer to Loken et al. (2002)). The temperature profiles of the simulated CDM and SCDM clusters are remarkably similar and are well fit by this universal temperature profile.
Finoguenov et al. 2001 also point out that the relation becomes flatter () when low mass clusters () are excluded i.e. the relation becomes closer to self-similar relation of . We have tried out with a flatter relation and seen that the results do not change appreciably. The code used by Loken et al. (2002) was tested as a part of the Santa Barbara cluster comparison project (Frenk et al. 1999) in which 12 groups simulated a Coma-like cluster using a variety of codes and resolutions. They have shown that their results are among the highest-resolution results presented in the paper(central resolution of ). They have also pointed out that their results for the Santa Barbara cluster are in excellent agreement with the results obtained from those of a new, completely independent code (Kravtsov, Klypin & Hoffman 2002).
This profile is in good agreement with the observational results of Markevitch et al. 1998 but diverges, primarily in the innermost regions, from their fit which assumes a polytropic equation of state. This profile is also in very good agreement with a recent sample of 21 clusters observed by BeppoSAX (De Grandi & Molendi 2002) with and without cooling flows. Although the simulation result is consistent with the data at outer radii, there is some difference in the inner region of clusters, indicating that there could be some additional physics at small radii () (Nath 2003).
We emphasize that this temperature profile does not include the effects of cooling and galaxy feedback or for that matter any additional physics. This temperature profile can be used, therefore, to probe the influence of gravitational interactions on the ICM, at radii .
It is instructive to compare the above mentioned temperature profile with the temperature profile calculated by assuming that , where (e.g in Bryan 2000, Wu & Xue 2002b) for a range of cluster masses. This is the self-similar model that has been used as a calibrator for the influence of gravitational processes. Although one does not expect in reality for the above proportionality to hold for arbitrarily small radii, it has been expected that the influences of shocks resulting from gravitational interactions alone does not extend beyond (e.g., Bryan 2000). This model therefore has been widely used to calculate the expected entropy of the gas at radii from gravitational interactions alone, and compare this expectations with the observed values.
We compare the temperature profiles assumed for the present model, and the profiles obtained using the self-similar model () in Figure 1, normalizing the temperature profiles by , where
| (11) |
where, .


It is seen that the universal temperature profiles (see Figure 1) flatten towards the inner regions of the cluster (within ), whereas the temperature profiles calculated using (hereafter, referred to as self-similar profiles) dip at the central region of the cluster.
3.2 Density Profile of Gas
We next numerically evaluate the density profile of the intra-cluster gas with the above defined temperature profile given in equation (9) assuming hydrostatic equilibrium.
Let us consider a spherical gas cloud with temperature ; then its density distribution in hydrostatic equilibrium satisfies
| (12) |
where,
| (13) |
where is the total mass inside radius (equation 3) and and denote the mean molecular weight (we use ) and the proton mass. The boundary condition which is imposed in evaluating this integral is that the gas-fraction, , within the virial radius is universal and is equal to , as recently found by Ettori (2003) for a sample of low and high redshift clusters. Since the total gas mass is negligible compared to the dark matter, , mass in dark matter, and therefore . The question whether or not is independent of cluster mass has been a topic of debate in the literature (White & Fabian, 1995; Ettori & Fabian, 1999; Markevitch et al. 1999; Wu & Xue, 2000). Although recent observations by Sanderson et al. (2003) show an apparent trend of being smaller for lower temperature systems, they also found that a universal value of can fit their data. According to them, the unweighted mean of their data set of gas-fraction within the virial radius is a constant close to to , the variation being due to the variation in the slope of the relation.
We note that this normalization provides a conservative estimate of the entropy of the gas from gravitational collapse alone since a lower value would only increase the entropy at all radii.
Figure 2 shows the gas-density profiles of 2 clusters of different masses. It compares the density profiles of the present model (lower set of curves) to the density profiles from self-similar assumptions (higher set of curves) with a constant proportionality factor of i.e., . As expected, it is seen that the gas density is much shallower in the inner parts of the cluster as a result of the universal temperature profile being flat at the inner regions. Interestingly enough, the density profiles obtained from the universal temperature profile deviates from self-similar expectations at radii much larger than . For a poor cluster with emission weighted temperature of keV the deviations become significant even at .
We note that the emergence of a core in the gas density distribution has been noticed by previous authors of numerical simulations, even in the absence of non-gravitational heating and cooling processes (Frenk et al. 1999). This appears to result from the transfer of energy between baryonic and dark matter during merger events (Eke et al. 1998).
We have also done all the calculations described here for a coma-like cluster () for a S-CDM universe using the same parameters as in the Santa Barbara Cluster Comparison Project (Frenk et al. 1999) to check for the consistency of our method and results. We find that all the properties like gas-density profile, X-ray luminosity calculated using the prescription described in this paper match the simulated results of Frenk et al. (1999).
4 Implications of the universal temperature profile and the derived gas density profile
In this section, we focus on the implications of the above temperature and gas-density profiles on the other physical properties of this intra-cluster gas like entropy, gas-mass, variation of with cluster mass or emission-weighted temperature, and gas-fraction, in light of recent observations.
4.1 Entropy Profiles and Scaling Properties
For convenience, ’entropy’ for the intra-cluster gas is defined as
| (14) |
where, is the temperature of the gas and the particle density. This quantity is directly related to observations. This has been referred to by a number of authors as ’adiabat’, since (apart from a constant relating to mean particle mass) it is the coefficient relating pressure and density in the adiabatic relationship . Hence is conserved in any adiabatic process. Note that the true thermodynamic entropy is related to this definition via a logarithm and additive constant.
In this section, we discuss the scaled entropy profiles (scaled with the emission-weighted temperature, ) obtained from our density and temperature profiles for 5 different mass clusters. We calculate the emission-weighted temperature corresponding to the profiles discussed above within a fiducial radius of (in the band keV), using the Raymond Smith code, for a metallicity of :
| (15) |
where and represent the ion and electron density and denotes the emissivity relevant for the keV band. We find that the emission weighted temperature obtained in this manner matches well (within ) with the value assumed to calculate the temperature profile itself (from equation 9). This shows that the system of equations used for our calculations is self-consistent.
Under the assumption that all these systems form at the same redshift, their mean mass densities should be identical. Hence in the simple self-similar case, where all have similar profiles and identical gas-fractions, will simply scale with emission-weighted temperature . We apply this scaling and scale the radial coordinate to for each system, derived as mentioned above.

We show these scaled entropy profiles in Figure 3. It can be seen that the entropy profiles of the cooler systems, scaled in the above mentioned way tend to be significantly and systematically higher than that of rich clusters. In these derived entropy profiles, we notice that they generally flatten in the very interior parts of the clusters (inside ) resulting from the flattening of density distribution at these radii. It is also seen that there is a noticeable tendency for the scaled entropy to be higher, at a given scaled radius, in cooler systems. Simulations and analytical models of cluster formation involving heating from accretion shocks, produce entropy profiles with logarithmic slopes of approximately 1.1 (Tozzi & Norman 2001), which agrees rather well with the slope of the calculated profiles outside , for rich clusters but it does not show good agreement with the entropy profiles for poor clusters.
The general trend of our calculated scaled entropy profiles are in good agreement with the recent results of PSF03. However, it is seen that the values in general are systematically lower than that of PSF03 at around and also at the outer reaches of the cluster.

In Figure 4, we plot the variation of entropy at with emission-weighted temperature, . The data points with the error bars are from PSF03. The region shaded with oblique lines represents the entropy calculated from the above described model with the spread in the concentration parameter “c’ and the region shaded with crossed lines corresponds to the self-similar density profiles.
The discovery of an entropy floor in galaxy groups and clusters (Ponman et al. 1999) was based on the measurement of gas entropy at , in systems spanning a wide temperature range. This radius was chosen to lie close to the centre, where accretion shock-generated entropy should be minimum, hence maximising the sensitivity to any additional entropy, whilst lying outside the region where the cooling time is less than the age of the universe, and hence the entropy may be reduced. This initial study was improved by Lloyd-Davies et al. (2000) who derived an entropy floor value of from a sample of 20 systems. However, the recent results of PSF03 show that there is no such entropy floor. They point out that an unweighted orthogonal fit to the data points, which have been grouped into temperature bins, gives a logarithmic slope of , as opposed to in self-similar relation.
As is seen in the figure, the entropy calculated from our model is higher than the previously calculated entropy from self-similar models (Wu & Xue, 2002b) for the poor clusters and similar or slightly lower for rich clusters. However it is lower than the data points from PSF03, the difference being more pronounced for poor clusters. This is because of the fact that the density profile deviates from the self-similar models even at .

We have noted earlier that the gas density profiles corresponding to the universal temperature profile is substantially flatter than the self-similar models even at radii larger than (see Figure 2). It is therefore instructive to compare the entropy at larger radii with that from self-similar models and data. Recently Finoguenov et al. (2002) compared the entropy at (which is for the range of cluster masses) with those expected from self-similar models and concluded that there is excess entropy even at this large radius, indicating the large scale influence of preheating processes.
In Figure 5, we show a plot of ‘entropy’ with emission- weighted temperature, . The region shaded with slanted lines represents the present model with the spread in the concentration parameter and the region shaded with crossed lines shows the entropy calculated from the self-similar model (). The solid line through the middle of the region shaded with slanted lines represents the results for the best-fit ‘c’. Data from PSF03 are also plotted for comparison. We find that the level of entropy at is reasonably consistent with the observed values for rich clusters but they are lower than the observed values for intermediate and low mass clusters, with the deficiency becoming appreciable for poor clusters. We note that previous authors had re-normalized the expectations for self-similar models by matching them with the entropy of the richest clusters and thus concluded the presence of excess entropy at . We do not normalize our calculated entropies in this manner in this paper. However, it still shows that there is a need for non-gravitational heating even at large radii especially for low mas clusters to fulfill the requirement of this excess entropy.


The Figures 3 and 4 clearly show that the entropy of the ICM in the central regions () from gravitational processes alone, is larger than the previous expectations from self-similar models. It is then reasonable to conclude that the entropy imparted by interactions between dark matter and baryons (Eke et al. 1998) has been underestimated. Therefore, we find that gravitational interactions impart more entropy to the gas in the central regions than estimated earlier but the problem of excess entropy for low mass clusters still remains. It is interesting to find that the entropy at in the present model is consistent with the observed values for rich clusters but are low for poorer clusters which probably confirms the requirement of some process which would help preferentially increase their entropy. It is not surprising to find consistency in the case of rich clusters though, as we have already noted that the temperature profile of Loken et al. (2002) is consistent with the observed profiles at outer radii.
4.2 Gas Distribution
In this section, we discuss the effects of this temperature profile and the resulting density profile on the relation between with mean emission-weighted temperature and the gas-fraction, profiles and the variation of , in the inner regions, with emission-weighted temperatures.
4.2.1 () -
In figure 6, we present the relation as predicted by the present model (solid line), the relation derived from the self-similar model (dotted line), and the data points from Mohr et al. (1999) within . It is seen that the gas mass within calculated from the present model is slightly higher than the data points, but lower than the expectations from self-similar models for clusters with keV and slightly higher for clusters with keV, which was previously thought to be the result of gravitational processes alone. The logarithmic slope of our curve ()is steeper than the self-similar slope of , and close to the observed slope.
4.2.2 Gas fraction and its spatial variation
The variation in the gas fraction (), evaluated within a characteristic radius of is shown is Figure 7. The solid line is the calculated gas fraction from the present model and the dotted line shows the results of self-similar model. The data have been taken from PSF03. It is noted here that the gas fraction obtained from the present model is slightly higher than the data points. However, it is also seen here that there is a clear trend for cooler systems to have a smaller mass fraction of X-ray emitting gas in the central regions, as a result of gravitational processes alone. The gas fraction obtained from the self- similar model is a constant as it should be by definition.
To understand the behaviour of gas fraction with radius better, we have plotted with the scaled radius, in Figure 8 for 5 clusters of different masses. The general trend seen here is for gas-fraction to rise monotonically with radius (especially for clusters with keV) all the way till . There is, however, a flattening of the profiles for the rich clusters ( keV) beyond with a slight bump around . It should be noted that the fit provided by Loken et al. 2002 is accurate to about 10 for and underestimates their simulated temperature profile in this region. This may increase the gas density profile at smaller radii and account for the bump in Figure 8. It can be seen clearly that the profiles lie in order of temperature such that, at a fixed radius, gas fraction decreases as temperature decreases, mirroring the trend in Figure 7.
If cluster evolution (with gravitational processes alone) were an entirely self-similar process, then should be a constant at a given over- density in all objects. Figure 9 clearly shows that this is not the case, even for evolution in the presence of gravity alone. Poor clusters seem to have a much lower gas mass fraction compared to rich clusters at the same over-density which was also seen by David et al. 1995. Again, a bump is seen for the richest cluster as seen in Figure 8. We have already discussed the probable reasons for this feature earlier.
4.3 X-ray Luminosity-Temperature Relation

In this section, we compute the bolometric X-ray luminosity, corresponding to the profiles discussed above (in the band 0.5-10 keV), using the Raymond-Smith code, for a metallicity of = 0.3. We compute the luminosities within the virial radius . The X-ray luminosity is computed as,
| (16) |
where , represent the ion and electron density and denotes the emissivity relevant for 0.5-10 keV band. We present the results in Figure 10.


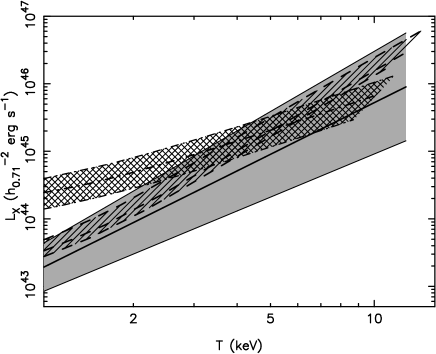
It is seen, from Figure 10, that the luminosity calculated from the present model (with the above quoted values of the cosmological parameters) is close to the observed data (scaled with = 0.71 as used for the models) for clusters with emission-weighted temperature above 1.0 keV. The data points are from Arnaud & Evrard 1999 and Markevitch 1998 for clusters above 5.0 keV and from Heldson & Ponman 2000 for low regime i.e. for low mass clusters and groups are also shown. Interestingly, compared to the dotted line which represents the self-similar model (), the present model shows that the luminosity for low mass clusters (below 5 keV) is closer to data points. However, the luminosity is still somewhat over-estimated in this model when compared to data. This again indicates that there is requirement for some non-gravitational heating (preferentially in low mass clusters) to reduce the gas density further and thus the X-ray luminosity. We note here that the X-ray luminosity depends strongly on the assumed metallicity, especially for low temperature systems, and the uncertainty over abundance of gas in poor clusters is yet to be resolved (Buote 2000, Davis 1999).
In Figure 11, we have plotted the X-ray luminosity integrated within a radius where the over-density . The results of our calculations are compared with the best-fit results of Ettori et al. 2002. It is interesting to find that the X-ray luminosities calculated from the above model lie within the spread of the results of Ettori et al. 2002.
5 Discussion
To recapitulate, our attempt here has been to study in detail the implications of the universal temperature profile obtained from recent high resolution simulations (Loken et al. 2002), with no input from non-gravitational processes, such as heating or cooling. We have compared the predictions of entropy and gas fraction from this temperature profile with the self-similar model (), which has been used in the literature as a reference model for calibrating the influence of gravitational processes, at radii . The only assumption that we have made in this paper is that of hydrostatic equilibrium, apart from the assumption of the background dark matter density profile. We have found that the result of gravitational processes alone is much different from what has been used in the literature so far.
Firstly, the widely used assumption that entropy imparted to the gas from the interaction between dark matter and baryons is limited to the very central region, appears to be simplistic. The corresponding assumption that the gas density profile expected from gravitational processes alone is proportional to the dark matter density profile at seems to be violated. Curves in Figure 2 show that the gas density profile deviates from the simple proportionality at a much larger radii, , and this deviation is larger for lower temperature systems.
If the temperature profile obtained by Loken et al. (2002) is confirmed to be the one that is expected from gravitational processes alone, then the implications discussed here are inevitable. Instead of using the self-similar models, one must use the present model to benchmark the expectations from gravitational processes, and then compare it with the data to infer the need for any additional physics.
However, to conclude definitively about the presence of any non-gravitational heat in the ICM, one needs to know better about the dark matter profile in clusters and to resolve the uncertainties in the concentration parameter in dark matter halos of clusters. This idea was also explored by Lloyd-Davies et al. (2002) who concluded that the scatter in the concentration parameter plays a role in the determination of the contribution of non-gravitational heating in the intra-cluster medium. Also, in this context, it is worthwhile to point out that the dependence of ‘c’ on redshift would have an effect on the results. This is because the assumption that the clusters were all formed at a redshift is a simplification of the actual picture. Different clusters would form at different redshifts according to the theory of structure formation (Press & Schechter, 1974) and that would mean that the concentration parameters would be different. The values of ‘c’ would be lower as (as found by Bullock et al. 2001). This will make the results slightly different, e.g., entropy at would be higher than the values plotted now and thus closer to the data and the X-ray luminosity would also be lower and thus closer to the data points. However, the entropy at will increase as a result of this and the gas fraction at will decrease, thus being closer to the respective data points.
We find that for entropy at the present model produces lower entropy than the data for all clusters. The difference is larger for poorer clusters. The problem would then be to increase the entropy, especially for poor clusters, as has been required from theoretical models earlier. The requirement of non-gravitational heating as estimated from earlier theoretical models would be reduced because as it is seen here that the entropy at inner regions were under-estimated in earlier models. We also find that the entropy expected at is consistent with the data for rich clusters but it is lower than the data points for low mass clusters emphasizing the need for some process to heat the gas even at large radii. It is however interesting that the scaled entropy profiles are similar to that observed (PSF03, Mushotzky et al. 2003).
It is possible that the discrepancy between the present model and the data for entropy at and X-ray luminosity for rich clusters can be alleviated by gaseous processes such as thermal conduction. As Loken et al. (2002) commented, the observed temperature profile is more flattened than their simulated profile, with somewhat larger temperature at . This could be due to thermal conduction (e.g., Nath 2003). This would then decrease the density in the inner regions and would (1) increase the entropy & (2) decrease X-ray luminosity to be consistent with data for rich clusters. We note that thermal conduction is however less important poor clusters.
We have noted that normalizing the gas content of clusters with a constant gas fraction for all clusters provides a conservative estimate of entropy from gravitational collapse alone. Also, we have found that changing the exponent of the relation to 1.5 does not change the results much.
The total gas mass at a fiducial radius of expected from the present model are again closer to the data than the previous self-similar model. The gas fraction at calculated from this model is higher than the data but it agrees better in comparison to the previously calculated ones from the self-similar model. It also rises with the temperature of the cluster as observed.
There is, therefore, some difference between the expectations from the present model and the data. If the present model is a realistic indicator of gravitational processes alone, then the results from this model should be compared with the data, to determine the requirements of additional physics, if any, to explain the data.
6 Conclusion
The primary aim of this work was to study the implications of the ’universal temperature profile’ arising out of pure gravitational interactions in galaxy clusters. We have determined the gas density profile corresponding to this temperature profile, and studied various implications of this profile. The only assumptions made in this paper is that of hydrostatic equilibrium and the temperature profile of Loken et al. 2002.
We have also shown the dependence of the above results on the uncertainty in the knowledge of the concentration parameter ‘c’.
Given the uncertainty in the concentration parameter, the main results are summarized below:
(a) Gas density profiles expected from gravitational processes alone is flatter than previously thought, even at radii much larger than .
(b) Entropy expected from gravitational processes alone at are larger than previously thought, especially for low mass clusters, but still lower than the observed values, with the discrepancy increasing for low mass clusters. The entropy expected at is consistent with observed values for rich clusters but it is lower than the data points for low mass clusters. Thus it emphasizes the need for non- gravitational heating preferentially for low mass clusters even at large radii.
(c) Gas fraction in the inner region () expected from gravitational process alone is much smaller than previously thought, and but slightly higher than the observed values.
We therefore conclude that if the temperature profile of Loken et al. (2002) is indeed the result of evolution of the intracluster gas involving gravitational processes alone, then the contribution of non-gravitational processes to the physics of ICM would have to be revised.
Acknowledgment : We are grateful to Trevor Ponman for sharing with us his paper before publication which inspired this work and for his comments as the referee. We also thank Dipankar Bhattacharya and Stefano Ettori for useful discussion.
References
- [\citeauthoryearAfshordi & Cen2002] Afshordi N., & Cen R., 2002, ApJ, 564, 669
- [\citeauthoryearAllen et al. 2003] Allen S. W., Schmidt R. W., Fabian A. C., 2001, MNRAS, 328, L37
- [\citeauthoryearArnaud & Evrard1999] Arnaud M., & Evrard A. E., 1999, MNRAS, 305, 631
- [\citeauthoryearBabul et al. 2002] Babul A., Balogh M. L., Lewis G. F., Poole G. B., 2002, MNRAS, 330, 329
- [\citeauthoryearBower1997] Bower R. G., 1997, MNRAS, 288, 355
- [\citeauthoryearBrian2000] Bryan G. L., 2000, ApJ, 544, L1
- [\citeauthoryearBullock et al. 2001] Bullock J. S. et al. , 2001, MNRAS, 321, 559
- [\citeauthoryearBuote2000] Buote D. A., 2000, MNRAS, 311, 176
- [\citeauthoryearDavé et al. 2002] Davé R., Katz N., Weinberg D. H., 2002, ApJ, 579, 23
- [\citeauthoryearDavis et al. 1999] Davis D. S., Mulchaey J. S., Mushotzky R. E., 1999, ApJ, 511, 34
- [\citeauthoryearDavid et al. 1995] David L. P., Jones C., Forman W., 1995, ApJ, 445, 578
- [\citeauthoryearDe Grandi et al. 2002] De Grandi S., Molendi S., 2002, ApJ, 567, 163
- [\citeauthoryearDos Santos & Doré2002] Dos Santos S., Doré O., 2002, A&A, 383, 450
- [\citeauthoryearEke et al. 1998] Eke V. R., Navarro J. F., Frenk C. S., 1998, ApJ, 503, 59
- [\citeauthoryearEttori2003] Ettori S., 2003, MNRAS, in press (astro-ph/0305296)
- [\citeauthoryearEttori et al. 2002] Ettori S., De Grandi S., Molendi S., 2002, A&A, 391, 841
- [\citeauthoryearEttori & Fabian1999] Ettori S., Fabian A. C., 1999, MNRAS, 305, 834
- [\citeauthoryearFinoguenov et al. 2001] Finoguenov A., Reiprich T. H., Böhringer H., 2001, A&A, 368, 749
- [\citeauthoryearFinoguenov et al. 2002] Finoguenov A., Jones C., Böhringer H., Ponman T. J., 2002, ApJ, 578, 74
- [\citeauthoryearFrenk et al. 1999] Frenk C. S. et al. , 1999, ApJ, 525, 554
- [\citeauthoryearHelsdon & Ponman2000] Helsdon, S. F. & Ponman, T. J., 2000, MNRAS, 315, 356
- [\citeauthoryearKnight & Ponman1997] Knight P. A., Ponman T. J., 1997, MNRAS, 289, 955
- [\citeauthoryearKomatsu et al. 2002] Komatsu E., Seljak U., 2002, MNRAS, 336, 1256
- [\citeauthoryearKravtsov et al. 2002] Kravtsov A. V., Klypin A., Hoffman Y., 2002, ApJ, 571, 563
- [\citeauthoryearKravtsov & Yepes2000] Kravtsov, A. V. & Yepes, G. 2000, MNRAS, 318, 227
- [\citeauthoryearLloyd-Davies et al. 2002] Lloyd-Davies E. J., Bower R. G., Ponman T. J., 2002,astro-ph/0203502 (submitted to MNRAS)
- [\citeauthoryearLloyd-Davies et al. 2000] Lloyd-Davies E. J., Ponman T. J., Cannon D. B., 2000, MNRAS, 315, 689
- [\citeauthoryearLoken et al. 2002] Loken C., Norman M. L., Nelson E., Bryan G. L., Motl P., 2002, ApJ, 579, 571
- [\citeauthoryearLoewenstein2000] Loewenstein M., 2000, ApJ, 532, 17
- [\citeauthoryearMarkevitch1998] Markevitch M., 1998, ApJ, 504, 27
- [\citeauthoryearMarkevitch et al. 1998] Markevitch M., Forman W. R., Sarazin C. L., Vikhlinin A., 1998, ApJ, 503, 77 (M98)
- [\citeauthoryearMarkevitch et al. 1999] Markevitch M., Vikhlinin A., Forman W. R., Sarazin C. L.,1999, ApJ, 527, 545
- [\citeauthoryearMuanwong et al. 2001] Muanwong O., Thomas P. A., Kay S. T., Pearce F. R., 2002, MNRAS, 336, 527
- [\citeauthoryearMushotzky et al. 2003] Mushotzky R., Figueroa-Feliciano E., Loewenstein M., Snowden S. L., 2003, astro-ph/0302267
- [\citeauthoryearNavarro et al. 1995] Navarro J F., Frenk C. S., White S. D. M., 1995, MNRAS, 275, 720
- [\citeauthoryearNavarro et al. 1996] Navarro J. F., Frenk C. S., White S. D. M., 1996, ApJ, 462, 563
- [\citeauthoryearNavarro et al. 1997] Navarro J. F., Frenk C. S., White S. D. M., 1997, ApJ, 490, 493
- [\citeauthoryearNath2003] Nath B. B., 2003, MNRAS, 340, 1
- [\citeauthoryearNath & Roychowdhury2002] Nath B. B., Roychowdhury S., 2002, MNRAS, 333, 145
- [\citeauthoryearPearce et al. 2000] Pearce F. R., Thomas P., A., Couchman H., M., P., Edge A. C., 2000, MNRAS, 317, 1029
- [\citeauthoryearPeebles1980] Peebles P. J. E., 1980, The Large Scale Structure of the Universe. Princeton Univ. Press, Princeton, NJ
- [\citeauthoryearPonman1999] Ponman T. J., Cannon D. B., Navarro J. F., 1999, Nature, 397, 420
- [\citeauthoryearPonman2003] Ponman T. J., Sanderson A. J. R., Finoguenov A., 2003, MNRAS, 343, 331
- [\citeauthoryearSanderson2003] Sanderson A. J. R., Ponman T. J., Finoguenov A., Lloyd-Davies E. J., Markevitch M., 2003, MNRAS, 340, 989
- [\citeauthoryearSeljak2000] Seljak U., 2000, MNRAS, 318, 203
- [\citeauthoryearSeljak & Huffenberger2003] Seljak U., Huffenberger K. M., 2003, 340, 1199
- [\citeauthoryearSpergel et al. 2003] Spergel D. N. et al. , 2003, submitted to ApJ (astro-ph/0302209)
- [\citeauthoryearSuto et al. 1998] Suto Y., Sasaki S., Makino N., 1998, ApJ, 509, 544
- [\citeauthoryearTozzi et al. 2001] Tozzi P., Norman C., 2001, ApJ, 546, 63
- [\citeauthoryearValageas & Silk1999] Valageas P., Silk J., 1999, A&A, 350, 725
- [\citeauthoryearVoit & Bryan2002] Voit G. M., Bryan G. L., 2001, Nature, 414, 425
- [\citeuthoryearWhite & Fabian1995] White D., A., Fabian A., C., 1995, MNRAS, 273, 72
- [\citeauthoryearWu et al. 2000] Wu K. K. S., Fabian A., Nulsen P. E. J. 2000, MNRAS, 318, 889
- [\citeauthoryearWu & Xue2000] Wu X., Xue Y., 2000, MNRAS, 311, 825
- [\citeauthoryearWu & Xue2002] Wu X., Xue Y., 2002a, ApJ, 572, L19
- [\citeauthoryearWu & Xue2002] Wu X., Xue Y., 2002b, ApJ, 569, 112