Multi-band optical follow-up observations of GRB 020813 at KISO and Bisei observatories
Abstract
Observations were made of the optical afterglow of GRB020813 (Fox, Blake & Price, 2002) with the KISO observatory 1.05 m Schmidt telescope and the Bisei astronomical observatory 1.01 m telescope. Four-band (, and ) photometric data points were obtained from 2002, August 13 10:52 to 16:46 UT, or 0.3460.516 days after the burst. In order to investigate the early-time (1 day) evolution of the afterglow, four-band light curves were produced by analyzing the data taken at these two astronomical observatories, as well as publicly released data taken by the Magellan Baade telescope (Gladders and Hall, 2002c). The light curves can be approximated by a broken power law, of which the indices are approximately 0.46 and 1.33 before and after a break at 0.2 days, respectively. The optical spectral index stayed approximately constant at 0.9 over 0.17 4.07 days after the burst. Since the temporal decay index after the break and the spectral index measured at that time are both consistent with those predicted by a spherical expansion model, the early break is unlikely to be a jet break, but likely to represent the end of an early bump in the light curve as was observed in the optical afterglow of GRB021004.
1 Introduction
Afterglow of a gamma-ray burst (GRB), observed in X-ray through radio frequencies, can be interpreted in the fireball models, wherein a shock produced by the interaction of relativistic ejecta with the circumburst environment expands into the surrounding medium, producing broad-band synchrotron emission (Meszaros & Rees 1997; Sari, Piran, & Narayan 1998). If the GRB is collimated into a jet, the entire jet surface becomes visible to the observers at some time . As the jet starts to expand laterally at around (Rhoads 1999), its sweeping area increases faster than before, leading to a stronger deceleration and hence a faster afterglow decay. The rapid decay of some GRB afterglows, observed recently, provide evidence for such jet-like or collimated ejecta (Sari, Piran, & Halpern 1999). The jet model would relax the energy requirements on some of the more extreme GRBs by a factor of several hundred (Frail et al. 2001).
The bright and long event, GRB020813, was detected on 2002 August 13, with the HETE-2 spacecraft (Ricker et al. 2003). The flight localization was reported in a GCN Position Notice at 02:48:33 UT, 4 min 14 s after the burst trigger. The subsequent ground analysis of the HETE-2 data produced a refined burst location, which was reported in a GCN Position Notice at 05:48:35 UT, 184 minutes after the burst. The location, with 90%-confidence error radius of (due entirely to systematic errors), is centered at (Villasenor et al. 2002).
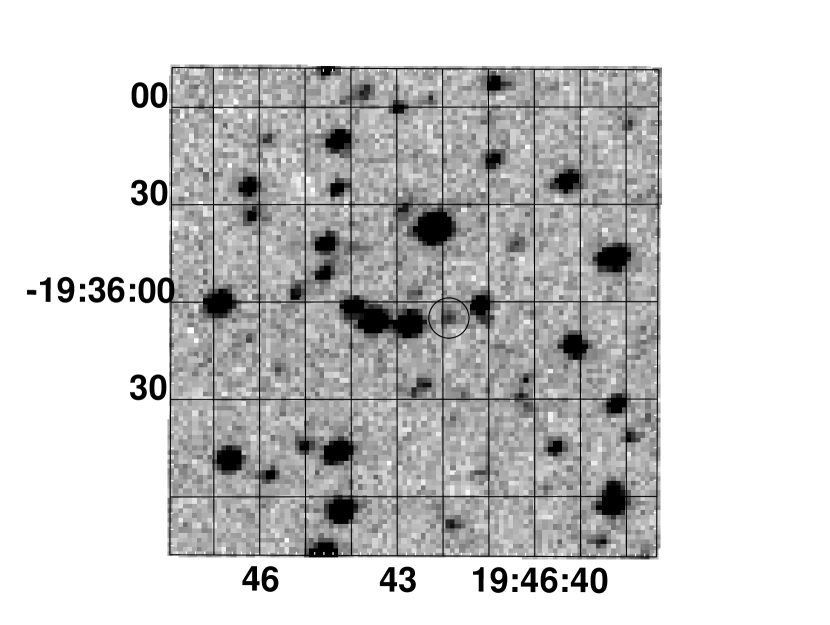
The optical afterglow was found within the -radius error circle at 0.078 days (112 minutes) after the burst, at the coordinates of (Fox et al., 2002). Optical spectra of the afterglow taken with the Keck observatory exhibit numerous absorption lines, indicating a minimum redshift of 1.254 0.005 (Price et al. 2002). Early optical light curves of the afterglow are suggested to have undergone a temporal break at 3.55 hours after the burst (Bloom et al. 2002).
The Kiso observatory of the University of Tokyo and the Bisei Astronomical Observatory (BAO) have established, for the first time in Japan, the capability of multi-band follow-up observations of GRBs (Urata et al. 2003a). The two sites serve as valuable additions to the world-wide optical and infrared follow-up network, because the Japan area would otherwise be blank for the network.
In order to investigate the early (within 1 day of the burst) evolution of the optical afterglow of GRB020813 in the flux (e.g. temporal decay and existence of a jet break) and the spectral slope, we have analyzed the Kiso and BAO data. In addition, we analyze the publicly released data of the afterglow obtained by the Magellan Baade telescope (Gladders and Hall, 2002c).
2 Observations
We carried out follow-up observations of the optical afterglow of GRB020813 with the 1.05 m Schmidt telescope and a 2k2k CCD Camera at the Kiso observatory, starting at 2002 August 13 10:52 UT (0.339 days after the burst). The field of view is and the pixel size is square. We performed -, -, -, and -band observations using a system prepared for the GRBs follow-up observations (Urata et al. 2003a). We obtained the multi-band data as described in talbe 1, with each dataset consisting of triple frames.
We also performed -band observations using the 1.01-m telescope with a Mutoh CV16IIE CCD camera (Kodak KAF1602E chip) at the BAO, starting at 2002 August 13 11:44:19 UT (0.375 days after the burst). The field of view is and the pixel size is square. We obtained 36 frames of -band data, each with 60 s exposure (table 1).
An extensive observation of the afterglow was also performed with the Magellan Baade 6.5 m telescope, on the nights of August 13 and 14 (0.13 - 0.94 days after the burst). These data were obtained in the -, -, -, and -band each for 60 s, using a TEK5 camera (Gladders and Hall,2002c). The four-band images, after bias subtraction and flat-fielding, are made publicly available by Gladders and Halls (2002c). We have hence retrieved the images from the ftp site introduced by them. The data consist of 4, 13, 14, and 21 frames in the -, -, -, and -band, respectively.
3 Analysis and Results
3.1 Photometry
We processed the Kiso and BAO data by a standard method using the NOAO IRAF. We used appropriate calibration data for the bias-subtraction and flat-fielding corrections. An example of the -band images we obtained is shown in figure 1. Thus, the afterglow is clearly detected in the images of all observations listed in table 1.
The Kiso, BAO, and Baade data have been combined with median. Flux calibrations among the different sites were done using the APPHOT package in IRAF, referring to the standard stars suggested by Henden (2002). Specifically, we utilized three of them, at the J2000 coordinates of (, ), (, ), and (, ). We set the aperture size to 4 time as large as the FWHM of objects for each data. We summarize the results of our photometry in table 1.
3.2 Light curves
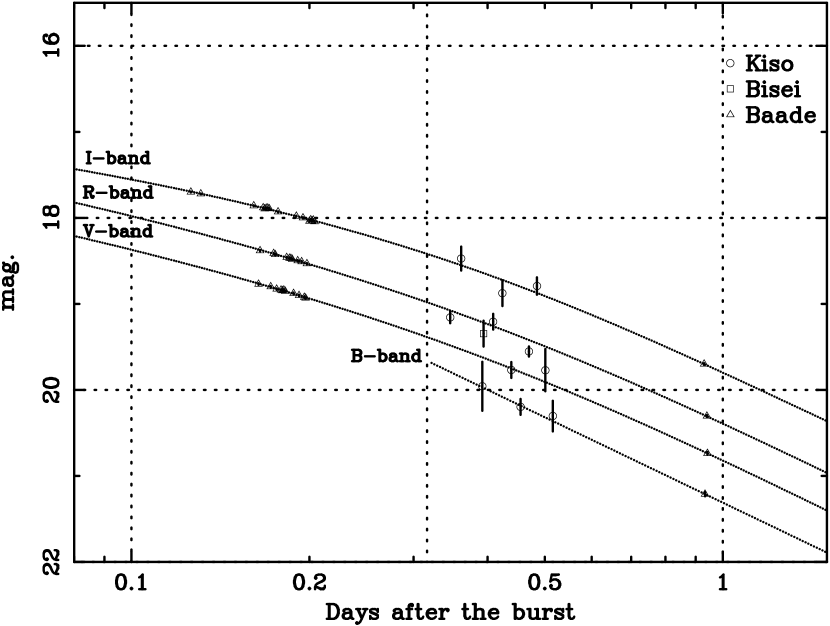
Figure 2 shows four-band light curves of the optical afterglow based on our measurements. We thus cover a time period of 0.17 to 0.94 days after the burst in the -, -, -band, with the Kiso, BAO and Baade datasets. The Baade datasets densely cover the early phase ( 0.2 days), with an additional coverage at 0.94 days. The Kiso and BAO data, in contrast, constrain the light curves in the intermediate (0.35 - 0.52 days) range.
First, we tried to fit the -, -, and -band light curves by a simple power law of the form , where is the time after the burst onset and is a constant called decay index. This gave with reduced of 2.44 for the -band, with 4.12 for the -band, and with 53.6 for the -band. Thus, none of the three light curves are consistent with a single power-law decay.
Next, we tried to fit the light curves with a broken power law model expressed as
| (1) | |||
where , , , and are four parameters. This functional form has no physical significance, but it provides a good description to the GRB990510 data, with the asymptotic power-law indices being and at early and late times, respectively (Harrison et al. 1999).
We have successfully fitted the above function to the -, -, and -band light curves. For the band, we have obtained , , and ( with 11); for the band, , , and ( with 12); for the band, , , and ( with 17). Thus, the decay is relatively independent of color, as evidenced by nearly the same values of days found among the three bands. An initial analysis of the optical light curve suggested hours (Bloom et al. 2002; Gladders & Hall 2002b).
We fitted a single power law to the -band data, because we lack data before the break. The obtained index is , with 0.26. Thus, the slope agrees with the values of found in the three longer wavelengths.
The X-ray afterglow, observed by the Chandra HETG at 0.88 - 1.78 days after the burst, faded in brightness according to a power law, with a decay index of (Vanderspek et al. 2002). This is close to the optical values we measured after the break.
3.3 Spectral flux distributions
We have converted the magnitudes to fluxes using the effective wavelengths and normalizations of Fukugita et al (1995). To remove the effects of the Galactic interstellar extinction, we used the reddening map of Schlegel, Finkbeiner, & Davis (1998). The Galactic reddening toward the burst is significant, )=0.101, which implies a Galactic extinction of , , , and .
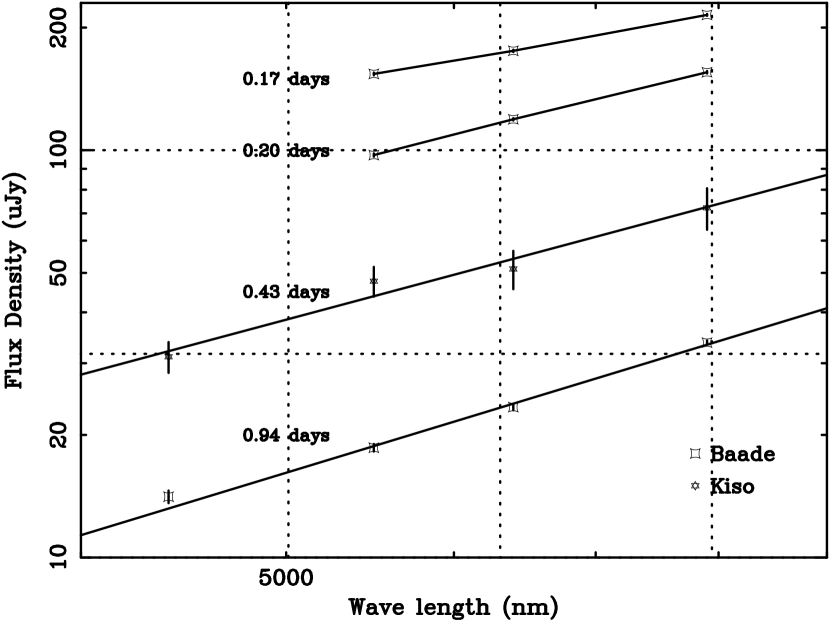
In figure 3, we plot the spectral flux distributions obtained in this way using the Kiso data (0.43 days after the burst) and the Baade data (0.17, 0.20 and 0.94 days after the burst). We fitted them with a power-law function as , where is the flux density at frequency and is the spectral index. We have obtained , , , and at = 0.17, 0.20, 0.43, and 0.94 d, respectively. The former two values of were calculated using the -, -, and -band data, while the latter two values utilized the four-band data. Thus, the measured values of are consistent with being constant at , because fitting them with a constant yields with 3.
The optical spectral index of the GRB020813 afterglow was reported as from red side Keck spectra (56009400) taken at about = 0.19 d (Barth et al. 2003). Correcting it for the Galactic extinction quoted above, we obtain . Levan et al. (2002) reported from the HST imaging data take at = 4.08 d. Since these measurements consistently imply =0.70.9, the spectral slope is suggested to have remained rather constant over a period of = 0.17 to 4.08 d.
4 Discussion
We analyzed the GRB020813 afterglow images in four bands, observed over a period of 0.330.52 days after the burst at the Kiso and Bisei observatories. We also re-analyzed the publicly released four-band images taken by the Baade 6.5m telescope (Gladders & Hall 2003c). These datasets, when combined, define relatively well-sampled light curves (in -, -, -, and -band) covering = 0.17 to 0.94 d. The -, -, and -band light curves are rather similar, and can be described by a broken power-law of and , with a break point at d. Meanwhile, the spectral index of the afterglow remained at 0.9. As can be seen from figure 2, the present Kiso and BAO data are essential in the determination of the overall light curves.
Optical light curves of several GRBs exhibit a temporal break at 1 d or later. The decay index of the light curve is typically and , before and after the break, respectively. In contrast, the afterglow of GRB020813 showed an unusually early break time at 0.2 d So far, the earliest break was observed in GRB010222, at 0.73 d (Watanabe et al. 2001). In addition, the decay index of observed from the present afterglow is smaller than those of other afterglows, while is similar to of other bursts. These are reminiscent of the afterglow of GRB021004; its light curve showed an early bump characterized by a brightening phase lasting until 0.07 d, followed by a dimming with a decay index of (Urata et al. 2003b) which is close to the present .
Usually, these temporal breaks are successfully interpreted by the jet model (Rhoads 1999; Sari, Piran, & Halpern 1999). The jet model predicts the time dependent spectral flux to vary as , wherein the temporal decay index and the spectral index are both determined uniquely by the electron power law spectral index . In order to examine whether the jet model is applicable to the present afterglow, we utilized the relations by Sari et al. (1999), and calculated the values of and based on the observed . The results are shown in table 2, together with the employed relations. Thus, the vales of we observed are too flat to be reproduced by the jet model under any condition, while those of agree with the model prediction assuming that we are observing a spherical fireball (i.e., before the break) in the frequency range below the synchrotron cooling.
The above discussion suggests that the behavior of the present light curves after their apparent break at 0.2 d is consistent with what is expected before the jet break in terms of the standard jet model. Therefore, the observed break is probably distinct from the usual jet break. If so, the electron spectral index is inferred from table 4 to be , which falls at the steepest end of the distribution of (1.4–2.8; Panaiteschu and Kumar, 2001); it is close to that of GRB980519 (). If the jet break exists in this burst, it should occur later than =0.94 d. We suggest that the mild break observed in the present light curves is reminiscent of a similar break, which was observed in the decay phase of an early bump in the GRB021004 afterglow. The GRB021004 afterglow showed a brightening phase over 0.050.07 d after the burst based on the Kiso observation, followed by a temporal break around 0.2 d across which the decay index changed from 0.2 to 0.7 (Urata et al. 2003b). In the case of GRB021004, the optical color changed over the bump, but remained constant across the break like in the present light curves; the behavior may be explained by a crossing of the typical synchrotron frequency through the optical band (Kobayashi and Zhang, 2003).
References
- Barth et al., (2003) Barth, A. J. et al., 2003, ApJ, 584, 47
- Bloom et al. (2002) Bloom, J. S., Fox, D. W., and Hunt, M. P., 2002, GCN Circ. 1476
- Fox, Blake & Price, GCN (1470) Fox, D. W., Blake, C., and Price, P., 2002, GCN Circ. 1470
- Frail et al., (2001) Frail, D. A., et al., 2001, ApJ, 562, L55
- Fukugita et al., (1995) Fukugita, M., Shimasaku, K., Ichikawa, T., 1995, PASP, 107, 945
- Gladders1 (2002) Gladders, M. and Hall, P., 2002a, GCN Circ. 1495
- Gladders2 (2002) Gladders, M. and Hall, P., 2002b, GCN Circ. 1514
- Gladders3 (2002) Gladders, M. and Hall, P., 2002c, GCN Circ. 1519
- Harrison et al., (1999) Harrison, F. A. et al., 1999, ApJ, 523, L121
- Henden (2002) Henden, A., 2002, GCN Circ. 1503
- Kawabata et al., (2002) Kawabata, T., Urata, Y., and Yamaoka, H., 2002, GCN Circ. 1501
- Kobayashi and Zhang. (2003) Kobayashi, S., and Zhang, B., 2003, ApJ, 582, L75
- Levan et al., (2002) Levan, A. J., Fruchter, A. S., Burud, I., and Rhoads, J. E., 2002, GCN Circ. 1518
- Meszaros and Rees (1997) Meszaros, P. and Rees, M. J., 1997, ApJ, 482, L29
- Panaitescu et al., (2001) Panaitescu, A. and Kumar, P. 2001, ApJ, 560, L49
- Pian et al., (2001) Pian, E., et al., 2001, A&A, 372, 456
- Piran et al., (1999) Piran, T. 1999, Phys. Rep., 314, 575
- Price et al., (2002) Price, P., Bloom, J. S., Goodrich, R. W., Barth, A. J., Cohen, M. H. and Fox, D. W., 2002, GCN Circ. 1475
- Rhoads (1999) Rhoads, J. E., 1999, ApJ, 525, 737
- Ricker et al., (2003) Ricker, G.R. et al., 2003, AIP conf. proce., 662, 3
- Sari et al., (1999) Sari, R., Piran, T. and Halpern, J. P., 1999, ApJ, 519, L17
- Sari et al., (1998) Sari, R., Piran, T. and Narayan, R., 1998, ApJ, 497, L17
- Schlegel et al., (1999) Schlegel, D. J., Finkbeiner, D. P. and Davis, M., 1998, ApJ, 500, 525
- Stanek et al., (1999) Stanek, K. Z., Garnavich, P. M., Kaluzny, J., Pych, W., and Thompson, I., 1999, ApJ, 522, L39
- Urata1 et al., (2002) Urata, Y. et al., 2002, GCN Circ. 1485
- Urata et al., (2003) Urata, Y., Nakada, Y., Miyata, T., Nishiura, S., Mito, H., Aoki, T., Soyano, T., Tarusawa, K., 2003a, Roma2002 proceedings
- Urata et al., (2003) Urata, Y. et al., 2003b, ICRC2003 proceedings
- Vanderspek et al., (2002) Vanderspek, R., Marshall, H. L., Ford, P. G., and Ricker, R., 2002, GCN Circ. 1504
- Villasenor et al., (2002) Villasenor, J. et al., 2002, GCN Circ. 1471
- Watanabe et al., (2001) Watanabe, J., Kinoshita, D., Komiyama, Y., Fuse, T., Urata, Y., and Yoshida, F., 2001, PASJ, 53, L27
| Start Time(UT) | Filter | Exposure (s) | mag | Site |
|---|---|---|---|---|
| 11:58:04 | 300 s 3 | 19.96 0.29 | Kiso | |
| 13:29:06 | 300 s 3 | 20.20 0.09 | Kiso | |
| 14:57:03 | 300 s 3 | 20.30 0.18 | Kiso | |
| 13:07:08 | 300 s 3 | 19.77 0.09 | Kiso | |
| 14:35:12 | 300 s 3 | 19.77 0.25 | Kiso | |
| 10:52:26 | 300 s 3 | 19.16 0.07 | Kiso | |
| 11:44:19 | 60 s 36 | 19.35 0.13 | Bisei | |
| 12:23:20 | 300 s 3 | 19.21 0.09 | Kiso | |
| 13:51:16 | 300 s 3 | 19.55 0.06 | Kiso | |
| 11:14:23 | 300 s 3 | 18.47 0.14 | Kiso | |
| 12:45:17 | 300 s 3 | 18.87 0.15 | Kiso | |
| 14:13:19 | 300 s 3 | 18.79 0.10 | Kiso |
| Frequency** is the frequency at which the spectrum breaks due to synchrotron cooling, whereas is the typical visible light frequency. | phase | relation††The jet model relation due to Sari et al. (1999). | ‡‡The decay index calculated from the spectral index . | |
|---|---|---|---|---|
| sphere | ||||
| jet | ||||
| sphere | ||||
| jet | ||||