XMM-Newton observation of the X-ray point source population of the starburst galaxy IC 342
Abstract
We present the results of an XMM-Newton observation of the starburst galaxy IC 342. Thirty-seven X-ray point sources were detected down to a luminosity limit of . Most of the sources are located near the spiral arms. The X-ray point source luminosity function is consistent with a power-law shape with a slope of , typical of starburst galaxies. We also present the energy spectra of several ultraluminous X-ray sources (ULXs), including the luminous X-ray source in the galactic nucleus. Except for the nucleus and a luminous supersoft X-ray source, other ULXs can generally be fit with a simple power-law spectral model. The nucleus is very luminous ( in 0.2–12 keV) and requires disc blackbody and power-law components to describe the X-ray emission. The spectral fit reveals a cool accretion disc ( keV) and suggests that the source harbours either an intermediate-mass black hole or a stellar-mass black hole with outflow.
keywords:
galaxies: individual: IC 342 – X-rays: binaries – X-rays: galaxies.1 Introduction
IC 342 is a nearby late-type Sc galaxy in the Maffei Group which is one of the closest groups to our Galaxy. The spiral arms of IC 342 is well developed and is almost face-on (; Newton 1980). IC 342 also shows substantial nuclear star formation (Becklin et al. 1980; Rickard & Harvey 1984). IC 342 has been observed with Einstein (Fabbiano & Trinchieri 1987), ROSAT (Bregman, Cox, & Tomisakam 1993) and ASCA (Okada et al. 1998; Kubota et al. 2001) previously. Ten X-ray point sources were found in the ROSAT HRI observation. IC 342 is also well known to house several ultraluminous X-ray sources (ULXs; Roberts & Warwick 2000). In particular, X1 and X2 (based on designations in Okada et al. 1998) showed spectral and intensity transition during the ASCA observations taken in 1993 and 2000 (Kubota et al. 2001). The state transitions of the two ULXs resemble the spectral/intensity states of X-ray transients in our Galaxy. In addition, a periodicity of 31 hr or 41 hr was found in X-2 with long (ks net exposure time) ASCA observations (Sugiho et al. 2001). Although we have known that there are several point sources around the galaxy nucleus based on ROSAT HRI data, the angular resolution of ASCA is very low and the nucleus of IC 342 is not resolved. Hence, we know very little about the X-ray emission from the nucleus. With the advent of XMM-Newton, we now have sufficient resolving power and collective area to have a detailed study of the galaxy.
At a distance of 1.8 Mpc (see Buta and McCall 1999 for a review), corresponds to 8.7 pc. Its proximity and its almost face-on orientation towards the observer provides a unique possibility to study the X-ray point source populations. Unfortunately, IC 342 is located at low Galactic latitude (), resulting a relatively high hydrogen column density, cm-2 (Dickey & Lockman 1990). This limits us to constrain local absorption and X-ray emission below 1 keV.
In this paper, we report on the X-ray point sources detected in IC 342, with an archival XMM-Newton observation. We begin with a description of the observation and data reduction procedures. In Section 3, we present the results of our study including the global properties of X-ray sources, spectral fits to bright sources, and the X-ray luminosity function. In Section 4, we discuss the X-ray source population, the nucleus and the ULXs of this galaxy. A summary will be given in Section 5.
2 Observations and data reduction
IC 342 was observed with the three instruments of European Photon Imaging Camera (EPIC) and the Optical Monitor (OM) on board XMM-Newton on 2001 February 11 for about 10ks. The instrument modes were full-frame with medium optical blocking filter for the pn and the two MOS cameras, while the filter of OM was (bandpass between 2200 and 4000). The event files were reprocessed and filtered with the XMM-Newton Science Analysis Software (SAS v5.4.1). Only data in 0.2-12 keV were used for analysis. We constructed light curves of source-free regions from each of the three instruments and after rejecting intervals with a high background level, we obtained a good time interval of 5ks and 9.5ks for the pn and MOS cameras, respectively.
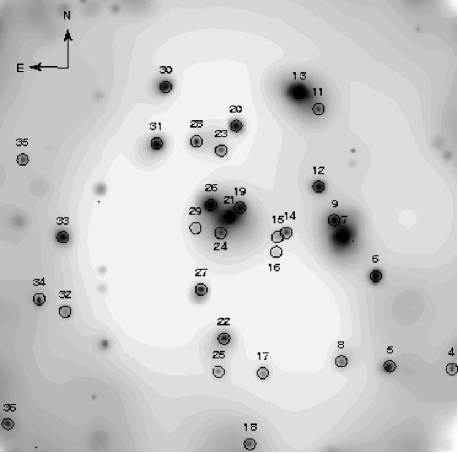
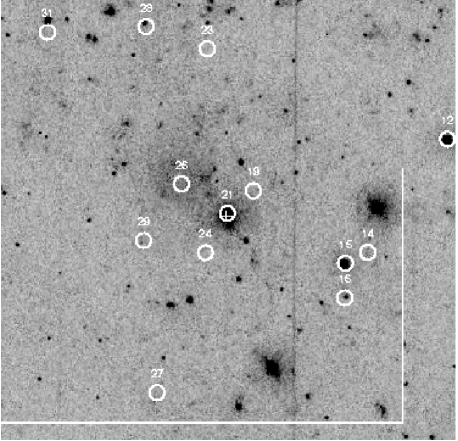
We created a combined MOS image by merging the two MOS detectors (MOS-1 and MOS-2) to increase the signal-to-noise (S/N) level. We also obtained a merged image from the three detectors. Figure 1 shows the merged EPIC image of the central region of IC 342. Source detection was done on the pn, merged MOS, and pn+MOS images with SAS task EWAVELET, with a detection threshold of . We examined the existence and position of each detected source by checking individual and merged images. The OM image and source detection were performed with the standard SAS pipeline tasks. We also corrected the astrometry of the OM image by using the USNO catalogue (Monet et al. 1998). The OM image of the central region of IC 342 is shown in Figure 2.
Source count rates were determined via aperture photometry with source-free regions as the background and were corrected for effective exposure and vignetting. The radius of the aperture was varied with average off-axis angle in order to match the 90% encircled energy function. The count rates reported here are the pn count rates in the total (0.2-12 keV), soft (0.2-1 keV), medium (1-2 keV), and high (2-12 keV) bands. Some sources fell in the chip boundary or outside the field of view of the pn camera. We then used the MOS count rates and rescaled them to the pn values with PIMMS. Energy spectra of bright sources were extracted with the SAS task XMMSELECT. Source-free regions were used for background. Response matrices were created by RMFGEN and ARFGEN.
3 Results
3.1 Properties of X-ray sources
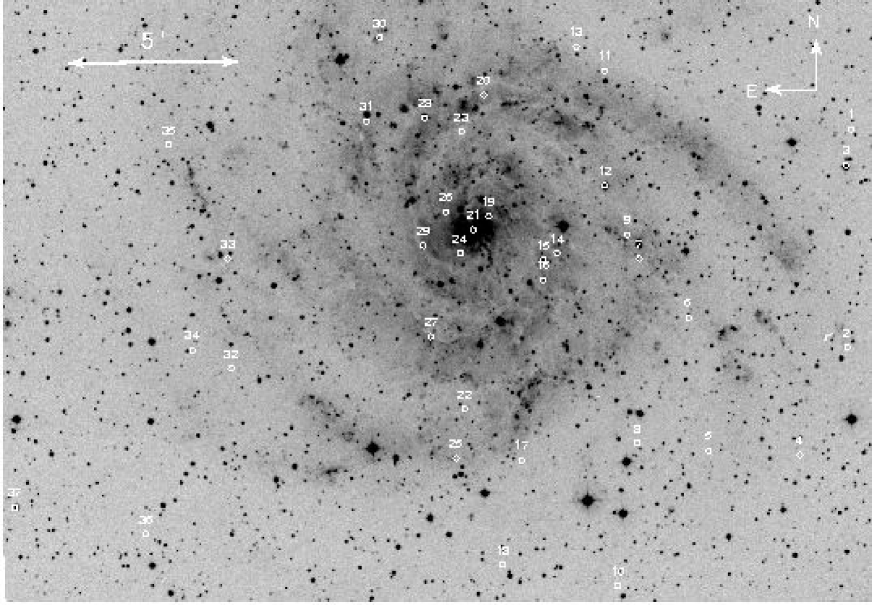
We detected 37 X-ray point sources in IC 342 (Table 1). The sources are mainly concentrated in the spiral arms of the galaxy (see Fig. 3). Five of the detected sources were clearly associated with bright stellar object within in the Digitized Sky Survey (DSS; Fig. 3) and the OM (Fig. 2) images. Source 12 (X12 hereafter) was also previously associated with a star in the ROSAT observation (Source 4 in Bregman et al. 1993). We then used the 3 matches within the central region to correct the astrometry of the X-ray images with the USNO catalogue. The positions listed in Table 1 and throughout this paper use this astrometric reference. The conversion of luminosities assumes an absorbed power-law spectrum with a photon index of 2 and cm-2 (the average from the spectral fits; see § 3.2). The detection limit is in the 0.2–12 keV band. Of the 37 sources, 9 of them were detected in previous ROSAT HRI observation (Bregman et al. 1993). One ROSAT source (source 2 in Bregman et al. 1993) is below the XMM-Newton detection limit, which suggests that the source is fainter by a factor of between the two observations.
Many of the detected sources have counts, which makes it difficult to derive spectral parameters. However, hardness ratios can give a crude indication of the X-ray spectra. Following Kong et al. (2002), we computed the hardness ratios for each detected sources, which are defined as HR1=(medium-soft)/(medium+soft) and HR2=(hard-soft)/(hard+soft). Figure 4 shows the colour-colour diagram for all detected sources. We have overlaid the colour-colour diagram with lines showing the tracks followed by representative spectral models with differing values of . We have shown in the diagram for power-law models with photon index ranges from 1.2 to 3, a Raymond-Smith thermal model with keV, and a blackbody model with keV. For each model, the increases from the left to the right, from cm-2 to cm-2. Power-law spectra tend to occupy the top right section of the diagram, while soft thermal models occupy the lower left.

It is clear that many of the sources are consistent with a power-law spectral model, while a few of them are dominated by soft X-ray emission. These soft X-ray sources are likely to be supersoft sources (Di Stefano & Kong 2003), supernova remnants or foreground stars. For example, foreground star X12 has HR1= and HR2=.
The closest X-ray source to the dynamical galaxy centre (Turner et al. 1992; marked with a white cross in Figure 2), X21, is about (26.1 pc) from the galactic centre and is within the positional accuracy of XMM-Newton. It it worth noting that X21 is also seen in the ROSAT HRI image, but in the Einstein and ASCA images, X21 is not resolved from several nearby sources (see Figure 1). The galaxy centre was also detected as a point-like UV source in the OM, with .
| ID | R.A. | Dec. | Net Counts | a | Note | ||
|---|---|---|---|---|---|---|---|
| (J2000.0) | (J2000.0) | 0.2–1 keV | 1–2 keV | 2–12 keV | () | ||
| X1 | 03:44:47.5 | +68:08:45.6 | 1.11 | ||||
| X2 | 03:44:49.4 | +68:02:17.5 | 0.53 | ||||
| X3 | 03:44:49.3 | +68:07:42.1 | 0.25 | , | |||
| X4 | 03:45:04.6 | +67:59:05.6 | 0.14 | ||||
| X5 | 03:45:33.6 | +67:59:14.4 | 0.84 | ||||
| X6 | 03:45:39.9 | +68:03:11.6 | 1.64 | ROSAT#1 | |||
| X7 | 03:45:55.4 | +68:04:57.6 | 16.74 | ROSAT#3 | |||
| X8 | 03:45:56.4 | +67:59:28.2 | 0.23 | ||||
| X9 | 03:45:59.2 | +68:05:39.9 | 1.43 | ||||
| X10 | 03:46:02.6 | +67:55:14.2 | 0.21 | ||||
| X11 | 03:46:06.3 | +68:10:32.3 | 0.40 | ||||
| X12 | 03:46:06.5 | +68:07:07.8 | 1.20 | , , ROSAT#4 | |||
| X13 | 03:46:15.4 | +68:11:15.6 | 11.79 | ROSAT#5 | |||
| X14 | 03:46:21.8 | +68:05:07.7 | 0.34 | ||||
| X15 | 03:46:26.0 | +68:04:56.2 | 0.26 | , | |||
| X16 | 03:46:26.2 | +68:04:19.4 | 0.23 | , | |||
| X17 | 03:46:33.1 | +67:58:57.9 | 0.19 | ||||
| X18 | 03:46:39.2 | +67:55:51.9 | 0.15 | ||||
| X19 | 03:46:43.5 | +68:06:13.6 | 1.32 | ROSAT#6 | |||
| X20 | 03:46:45.1 | +68:09:49.7 | 0.90 | ROSAT#7 | |||
| X21 | 03:46:48.4 | +68:05:49.6 | 6.74 | nucleus, ROSAT#8 | |||
| X22 | 03:46:51.2 | +68:00:30.0 | 0.43 | ||||
| X23 | 03:46:52.2 | +68:08:44.8 | 0.24 | ||||
| X24 | 03:46:52.7 | +68:05:07.7 | 0.51 | ||||
| X25 | 03:46:53.8 | +67:59:02.3 | 0.26 | ||||
| X26 | 03:46:57.2 | +68:06:21.1 | 4.56 | ROSAT#9 | |||
| X27 | 03:47:01.9 | +68:02:38.6 | 0.45 | ||||
| X28 | 03:47:03.9 | +68:09:08.7 | 0.42 | ||||
| X29 | 03:47:04.4 | +68:05:20.8 | 0.23 | ||||
| X30 | 03:47:18.4 | +68:11:31.9 | 1.12 | ||||
| X31 | 03:47:22.7 | +68:09:02.6 | 1.02 | ||||
| X32 | 03:48:05.6 | +68:01:41.0 | 0.20 | ||||
| X33 | 03:48:06.8 | +68:04:56.1 | 1.13 | ROSAT#10 | |||
| X34 | 03:48:17.9 | +68:02:13.2 | 0.30 | ||||
| X35 | 03:48:25.9 | +68:08:19.6 | 0.19 | ||||
| X36 | 03:48:32.3 | +67:56:43.9 | 0.36 | ||||
| X37 | 03:49:14.0 | +67:57:30.0 | 0.74 | , | |||
X-ray sources associated with stars are indicated by the and
magnitudes taken from the USNO catalogue. Sources
detected by
ROSAT HRI (Bregman et al. 1993) are noted.
a Unabsorbed 0.2–12 keV luminosity in unit of ,
by assuming a power-law spectrum with cm-2
and .
3.2 Spectral fits of bright sources
We extracted the energy spectra for sources that have counts, and fitted them to simple one-component spectral models including absorbed power-law, blackbody, disc blackbody, Raymond-Smith, broken powerlaw and the bulk motion Comptonization (BMC; Shrader & Titarchuk 1999) models. Except for X12, X20, and X21, all sources were satisfactorily fitted with simple absorbed power-law model (see Table 2). Generally, the of the brightest sources ranges from cm-2 to cm-2 with an average of cm-2, while the photon index varies between 1.7 and 3.2. These spectra are consistent with typical X-ray binaries seen in our Galaxy and other external galaxies. For X7 and X13, the spectra can be fitted equally well with a disc blackbody model with inner disc temperature of keV. Figure 5 shows the disc blackbody spectrum of X7. Both X7 and X13 are two of the previously reported ULXs in IC 342 and our results are in good agreement with previous ASCA observations (see § 4.3 for discussion). For X12 and X20, their spectra are soft and can be fit with a blackbody model. X12 is likely to be a foreground star and the soft spectrum is not unexpected. The blackbody temperature of X20 is keV, suggesting that it is a luminous supersoft X-ray sources (Di Stefano & Kong 2003). It is worth noting that X20 was also detected by ROSAT HRI (Bregman et al. 1993). If we assumed the same spectral shape as the XMM-Newton observation, X20 is about a factor 2 brighter during the ROSAT observations.
X21 is about from the dynamical centre and probably is the nucleus of the galaxy (see § 4.2 for discussion). Single-component spectral models cannot give a good fit (see Table 2) and it requires a more complicated model. We fit X21 with a two-component model consisting of disc blackbody and power-law components. The additional component significantly ( 99.9% confidence) improves the fit. We also considered the BMC model and the spectral fit is comparable to the disc blackbody + power-law model. The blackbody temperatures of both models are similar and are low ( keV) compared with many ULXs. Depending on the spectral model, the 0.2–12 keV luminosity is between and . The best-fitting disc blackbody + power-law model is shown in Figure 6.


| ID | kT | /dof | a | ||
|---|---|---|---|---|---|
| (cm-2) | (keV) | ||||
| X6 | 0.4/7 | ||||
| X7 | 0.81/174 | ||||
| b | 1.03/174 | ||||
| X9 | 0.5/3 | ||||
| X12 | 1.48/10 | ||||
| X13 | 1.25/47 | ||||
| b | 1.02/47 | ||||
| X19 | 1.02/4 | ||||
| X20 | 1.1/6 | ||||
| X21 | 1.50/82 | ||||
| b | 2.04/82 | ||||
| b | 1.25/80 | ||||
| c | 1.24/80 | ||||
| X26 | 0.77/14 | ||||
| X30 | 0.97/8 | ||||
| X31 | 0.54/8 | ||||
| X33 | 0.77/7 |
All quoted uncertainties are at the 90% confidence level.
a Unabsorbed luminosity ( ) in 0.5-10 keV,
assuming a distance of 1.8 Mpc.
b Disc blackbody temperature.
c Blackbody temperature from the BMC model.
3.3 X-ray luminosity function
We constructed the X-ray point source luminosity function to investigate the compact object populations of IC 342 (Wu 2001; Kilgard et al. 2002). The count rates for all detected sources were converted into unabsorbed 0.2–12 keV luminosities by assuming an absorbed power-law model with cm-2 and . For the brightest 12 sources (Table 2), we used the luminosities derived from the best-fitting spectral model. In addition, we excluded the three foreground stars (X3, X12, X15, X16 and X37). In Figure 7, we plot the cumulative luminosity function for all sources (excluding the foreground stars). To estimate the completeness limit, we used a method described by Kong et al. (2002). We computed histogram of the number of detected sources against the S/N to examine the completeness limit; the histogram peaks at S/N , corresponding to , and fall off below this. Hence the luminosity function is complete down to . We fit the luminosity function with a simple power-law model and determined the slope via maximum likelihood method on the differential luminosity function (; e.g., Crawford, Jauncey, & Murdoch 1970). We note that the exponent for a fit to cumulative function would be . We obtained a slope of for the cumulative luminosity function, with luminosities greater than . There are 12 sources outside the disc of IC 342 and they are likely to be contaminated by foreground or background objects. Excluding point sources outside the ellipse, the slope () is in good agreement with the above result. Within the ellipse, we estimated that there are about 3 background sources accroding to the Chandra Deep Field Surveys (e.g., Brandt et al. 2001; Giacconi et al. 2001).
4 Discussion
4.1 Global properties
Of the 37 detected X-ray sources in the field iof IC 342, 25 of them are inside the ellipse. Based on the colour-colour diagram and spectral fits, X-ray sources in IC 342 are likely to be typical X-ray binaries. There are four sources for which the colours are similar to supernova remnants (see e.g., Soria & Kong 2003), while X20 is likely to be a luminous supersoft X-ray source (SSS; Di Stefano & Kong 2003). In a detailed study of SSSs in 4 external galaxies, Di Stefano & Kong (2003) found more than 30 SSSs while only one SSS in M101 has luminosity (see also Mukai et al. 2003). Recently, Kong & Di Stefano (2003) also discovered a recurrent luminous SSS in NGC 300 which exceeds during its high state. Therefore, X20 is one of the few very luminous SSSs found in nearby galaxies. Like many SSSs in external galaxies, it is clear that X20 is on the spiral arm of IC 342 (see Figure 3) where young stellar populations are expected. Comparing the fluxes between the ROSAT and XMM-Newton observations, X20 varies by a factor of 2, suggesting that it is unlikely to be a supernova remnant. It is therefore possible that X20 is a symbiotic if the accreting object is a white dwarf. However, in order to achieve such a high luminosity, it is likely that X20 contains a black hole accretor (see Di Stefano & Kong 2003 and Kong & Di Stefano 2003 for discussion). The spectral parameters ( eV, ) is consistent with a model of an intermediate mass black hole (Di Stefano et al. 2003). The implied black hole mass would be at least 1200. This is likely to be a lower limit as spectral hardening, orientation and spin would tend to increase the black hole mass. An alternative model involves an Compton thick outflow from a stellar-mass black hole, accreting near the Eddington limit (King & Pounds 2003). For instance, a 100 eV source is consistent with a black hole with an outflow rate of .
The point source luminosity function of IC 342 can be fit with a power-law and the slope () is consistent with other starburst galaxies or spiral disc (; Kilgard et al. 2002; Grimm, Gilfanov, & Sunyaev 2003). Moreover, Grimm, Gilfanov, & Sunyaev (2002) obtained a slope of for the high-mass X-ray binaries (HMXBs) in our Galaxy. The similarity between the luminosity functions of IC 342, Galactic HMXBs, and other starburst galaxies suggests that the X-ray point source population might be dominated by HMXBs with continuous star forming activity. More recently, Ranalli, Comastri & Setti (2003) determined a linear relation between the star formation rate (SFR) and total X-ray luminosity (2–10 keV) in various nearby star-forming galaxies based on ASCA and BeppoSAX data. In our XMM-Newton observation, the 2–10 keV luminosity of all point sources is . Applying the relationship derived by Ranalli et al. (2003), we obtained a SFR of yr-1. This is consistent with the SFR ( yr-1) obtained from radio observations (Grimm, et al. 2003). However, for such a low SFR, the relation between the SFR and X-ray luminosity is non-linear (Grimm et al. 2003). Following Grimm et al. (2003), the expected SFR from the observed X-ray luminosity should be between yr-1.
4.2 X-ray emission from the nucleus
Although it was known that there is X-ray emission from the nucleus of IC 342 since Einstein, we know very little about its nature. ROSAT HRI image resolved the nucleus into several X-ray sources, but subsequent ASCA observations do not have the resolving power to isolate them. Furthermore, the ROSAT HRI image indicates that the nuclear source is extended. In the XMM-Newton observation, X21 is clearly seen and separated from nearby sources in the XMM-Newton image (see Figure 1) and is about from the dynamical galaxy centre. We examined the surface brightness profile of the source and it is consistent with the instrumental point spread function of a point source. Given a relatively large error circle () from XMM-Newton data, it is not clear if X21 is truly associated with the dynamical centre. Better astrometry by Chandra is needed to confirm the result. From optical and infrared observations, there is a star cluster in the centre of the galaxy (Bker, van der Marel, & Vacca 1999). While a central black hole is not found, an upper limit of can be set. We obtained the X-ray spectrum of X21. The source is very luminous ( in 0.2–12 keV) and it requires two-component models to give a best fit. The result is similar to many ULXs in external galaxies and Galactic black hole binaries during the high/soft state. However, the disc temperature ( keV) is about 5 to 10 times lower than expected. Recently, such cool disc systems have been found in NGC 1313 and have been interpreted as evidence of intermediate-mass black holes (Miller et al. 2003). Following Miller et al. (2003), the black hole mass of X21 is in the range of and . If we simply scale the mass according to the Eddington luminosity, we obtain a minimum black hole mass of . However, the powerlaw component of X21 is weak and contributes only of the total emission. For the two ULXs in NGC 1313, the powerlaw compontent is 33% and 63% of the total X-ray flux (Miller te al. 2003). The unphysical spectral fit with broken powerlaw model rules out the possibility of an accreting stellar black hole with beamed relativistic jet emission (Kaaret et al. 2003). If X21 is indeed an intermediate-mass black hole, it is likely that the source is associated with the star cluster instead of the galaxy dynamical centre. Ebisuzaki et al. (2001) recently suggest that intermediate-mass black holes can form in young compact star clusters through successive mergings of massive stars. This is suggestive that X21 is an example of this scenario. It is, however, worth to noting that we cannot rule out a stellar-mass black hole with strong wind (King & Pounds 2003; see also §4.1).
4.3 The ultraluminous sources in IC 342
Except for the nucleus, there are two historical ULXs (X7 and X13) in IC 342. We examined the light curves of the individual ULXs and they do not show significant variability on the timescale of our observation. The brightest off-nucleus ULX, X7, has a luminosity of during the XMM-Newton observation. Comparing to previous ASCA observations, the source is consistent with the low/hard state (Kubota et al. 2001; see also Kubota, Done & Makishima 2002). Similarly, the luminosity state of the second brightest ULX, X13, during our XMM-Newton observation also corresponds to the low/hard state in the ASCA observations. It is worth noting that all previous X-ray observations derived the luminosity by assuming a distance of 4 Mpc which is greater than generally acceptable value of 1.8 Mpc (Buta and McCall 1999). We here rescaled all the luminosities assuming 1.8 Mpc. The smaller implied luminosities of the two brightest ULXs are still between . Hence, a smaller black hole mass is required. For instance, according to the calculation by Kubota et al. (2002), X7 would have a black hole mass between and .
It is clear from the XMM-Newton and ROSAT (Bregman et al. 1993) images that the two ULXs with state/intensity changes have several nearby sources. The significant poorer spatial resolution of ASCA (FWHM ) and the large extraction radius () used in analysing the ASCA data (Okada et al. 1998) imply that the targets suffer confusion problem. For example, a circular region surrounding X7 includes six other sources (X6, X9, X12, X14, X15, and X16). Comparing the XMM-Newton counts of these sources, about 40% of the ASCA counts of X7 in the low state are due to confusion. Therefore, the luminosities measured by ASCA are over-estimated particularly during the low luminosity state. In fact, the two ULXs shown in Figure 1 in Kubota et al. (2001) show asymmetric shape and the centroids have moved during the two observations, indicating that there are bright nearby X-ray variables. Comparing the XMM-Newton data with the ROSAT HRI observations, X6 and X9 (not detected in Bregman et al. 1993, but might be marginally seen in the archival image) varied by a factor of . It is therefore possible that the factor of (after correcting the possible confusion of nearby sources based on XMM-Newton data) variability of X7 during the two ASCA observations are due to X6 and X9, and/or other nearby sources if one of these sources varies by at least a factor of 10. It is more likely that the variability seen by ASCA is intrinsic to X7. In addition, X12 is a foreground star which shows soft spectrum (see Table 2). If the foreground star has flarings during the high/soft state in the ASCA observations, it could contribute additional soft X-ray emission.
More recently, X7 was observed by Chandra ACIS-S on 2002 April 29 with an exposure time of 10 ks. We therefore use this archival observation to investigate the contamination of nearby sources in detail. Within of X7, there is no obvious X-ray source and the nearest point source is about from X7 111The Chandra observation was operated in sub-array mode and therefore it only covered a small part around X7. From our XMM-Newton observation, the nearest point source to X7 is about away.. Any faint source within this area must be fainter than . Hence, the contamination of our XMM-Newton spectrum should be minimal. We also examined the Chandra spectrum of X7. After correcting the soft energy degradation and pile-up (), the spectrum can be fit with a power-law model [cm-2, ] with a reduced of 1.0 for 81 degrees of freedom. The 0.5–10 keV luminosity is , similar to our XMM-Newton observation.
Similarly, for X13, a extraction region covers X11 and X20 as well. In particular, X20 is likely to be a luminous ( in 0.5–10 keV) SSS (see Table 2 and § 4.1 for discussion) and it shows a factor of 2 variability between the ROSAT and XMM-Newton observations. SSSs are well-known to be highly variables (e.g., Di Stefano & Kong 2003; Kong & Di Stefano 2003) and therefore the less than factor of 2 variability of X13 during the two ASCA observaitons is easily explained by the existence of a SSS. Note that the SSS has relatively high temperature ( keV) and ASCA should be able to detect it; the source luminosity in the ASCA band (0.7–10 keV) is about . Comparing with the 0.7–2 keV ASCA count rate of X13 during the high state (Sugiho et al. 2001), roughly 25% of counts are contaminated by the SSS (assuming the same blackbody model measured by XMM-Newton). Therefore, if the SSS brightens during the high state by a factor of , it could contribute significant soft photons to result a softer and brighter spectrum. It is worth noting that X13 is asymmetric toward the direction of the supersoft source, X20, during the high/soft state in 2000 (see Figure 1 in Kubota et al. 2001). We therefore conclude that the spectral/intensity changes seen in the two ASCA observations should be treated with caution. Further monitoring observations with XMM-Newton and Chandra are required to investigate the state transitions of ULXs in IC 342.
5 Summary
We have studied the X-ray point source population in the nearby starburst galaxy IC 342 with XMM-Newton. Thirty-seven X-ray sources were detected at a significance of or greater. The X-ray point source luminosity function is in a power-law form and the slope () is consistent with other starburst galaxies and Galactic HMXBs. Most of the X-ray sources are near the spiral arms, indicating that the X-ray point sources are dominated by young stellar population (presumably HMXBs) with continuous star forming activity. For the 12 brightest sources, we extracted the energy spectra and except for the nucleus, a SSS, and a foreground star, they can be described by a power-law model. There is one source (X21) about from the dynamical centre, and the spectrum can be fit with a disc blackbody plus power-law model. The source is very luminous ( ) and the disc temperature is low ( keV). It could be an evidence for an intermediate-mass black hole or a stellar-mass black hole with strong wind. We also investigate the intensity/spectral changes of the two famous ULXs but our XMM-Newton observation suggests that the changes could be simply due to confusion of ASCA observations.
Acknowledgments
I thank Rosanne Di Stefano and Phil Kaaret for useful discussion. This work was supported by NASA under an LTSA grant, NAG5-10705, and by the Croucher Foundation. This work is based on observations obtained with XMM-Newton, an ESA mission with instruments and contributions directly funded by ESA member states and the US (NASA).
References
- [1] Becklin, E.E., Gatley, I., Matthrews, K., Neugebauer, G., Sellgren, K., Werner, M.W., Wynn-Williams, C.G., 1980, ApJ, 236, 441
- [2] Bker, T., van der Marel, R., & Vacca, W.D., 1999, AJ, 118, 831
- [Brandt et al.(2001)] Brandt, W.N. et al. 2001, AJ, 122, 2810
- [3] Bregman, J.N., Cox, C., Tomisakam K., 1993, ApJ, 415, L79
- [4] Buta, R.J., McCall, M.L., 1999, ApJS, 124, 33
- [5] Crawford, D.F., Jauncey, D.L., Murdoch, H.S., 1970, ApJ, 162, 405
- [6] Dickey, J.M., Lockman, F.J., 1990, ARA&A, 28, 215
- [7] Di Stefano, R., Kong, A.K.H., 2003, ApJ, 592, 884
- [8] Di Stefano, R., Kong, A.K.H., Greiner, J., Primini, F.A., Garcia, M.R., Barmby, P., Massey, P., Hodge, P.W., Williams, B.F., Murray, S.S., Curry, S., Russo, T.A., 2003, ApJ, submitted (astro-ph/0306440)
- [9] Ebisuzaki, T., et al., 2001, ApJ, 562, L19
- [10] Fabbiano, G., Trinchieri, G., 1987, ApJ, 315, 46
- [Giacconi et al.(2001)] Giacconi, R. et al. 2001, ApJ, 551, 624
- [11] Grimm, H.-J., Gilfanov, M., Sunyaev, R., 2002, A&A, 391, 923
- [12] Grimm, H.-J., Gilfanov, M., Sunyaev, R., 2003, MNRAS, 339, 793
- [13] Kaaret, P., Corbel, S., Prestwich, A.H., Zezas, A., 2003, Science, 299, 365
- [14] Kilgard, R.E., Kaaret, P., Krauss, M.I., Pretwich, A.H., Raley, M.T., Zezas, A., 2002, ApJ, 573, 138
- [15] King, A.R., Pounds, K.A., 2003, MNRAS, in press (astro-ph/0305541)
- [16] Kong, A.K.H., Garcia, M.R., Primini, F.A., Murray, S.S., Di Stefano, R., McClintock, J.E., 2002, ApJ, 577, 738
- [17] Kong, A.K.H., Di Stefano, R., 2003, ApJ, 590, L13
- [18] Kubota, A., Mizuno, T., Makishima, K., Fukazawa, Y., Kotoku, J., Ohnishi, T., Tashiro, M., 2001, ApJ, 547, L119
- [19] Kubota, A., Done, C., Makishima, K., 2002, MNRAS, 337, L11
- [20] Miller, J.M., Fabbiano, G., Miller, M.C., Fabian, A.C., 2003, ApJ, 585, L37
- [21] Monet, D., et al., 1998, The USNO-A2.0 Catalogue (Flagstaff: US Naval Obs.)
- [22] Mukai, K., Pence, W.D., Snowden, S. L., Kuntz, K.D., 2003, ApJ, 582, 184
- [23] Newton, K., 1980, MNRAS, 191, 169
- [24] Okada, K., Dotani, T., Makishima, K., Mitsuda, K., Mihara, T., 1998, PASJ, 50, 25
- [25] Ranalli, P., Comastri, A., Setti, G., 2003, A&A, 399, 39
- [26] Rickard, L.J., Harvey, P.M., 1984, AJ, 89, 1520
- [27] Roberts, T.P., Warwick, R.S., 2000, MNRAS, 315, 98
- [28] Shrader, C.R., Titarchuk, L., 1999, ApJ, 521, L121
- [29] Soria, R., Kong, A.K.H., 2003, A&A, submitted
- [30] Sugiho, M., Kotoku, J., Makishima, K., Kubota, A., Mizuno, T., Fukazawa, Y., Tashiro, M., 2001, ApJ, 561, L73
- [31] Turner, J.L., Hurt, R.L., 1992, ApJ, 384, 72
- [32] Wu, K., 2001, PASA, 18, 443