On the origin of the various types of radio emission in GRS 1915+105
Abstract
We investigate the association between the radio “plateau” states and the large superluminal flares in GRS 1915+105 and propose a qualitative scenario to explain this association. To investigate the properties of the source during a superluminal flare, we present GMRT observations during a radio flare which turned out to be a pre-plateau flare as shown by the contemporaneous Ryle telescope observations. A major superluminal ejection was observed at the end of this “plateau” state (Dhawan et al. 2003), associated with highly variable X-ray emission showing X-ray soft dips. This episode, thus has all the three types of radio emission: a pre-plateau flare, a “plateau” state and superluminal jets. We analyze all the available RXTE-PCA data during this episode and show that: (1) the pre-flare “plateau” state consists of a three-component X-ray spectra which includes a multicolor disk-blackbody, a Comptonized component and a power-law and (2) the Compton cloud, which is responsible for the Comptonizing component, is ejected away during the X-ray soft dips. We investigate all the available monitoring data on this source and identify several candidate superluminal flare events and analyze the contemporaneous RXTE pointed observations. We detect a strong correlation between the average X-ray flux during the “plateau” state and the total energy emitted in radio during the subsequent radio flare. We find that the sequence of events is similar for all large radio flares with a fast rise and exponential decay morphology. Based on these results, we propose a qualitative scenario in which the separating ejecta during the superluminal flares are observed due to the interaction of the matter blob ejected during the X-ray soft dips, with the steady jet already established during the “plateau” state. This picture can explain all types of radio emission observed from this source in terms of its X-ray emission characteristics.
1 Introduction
The black-hole candidate GRS 1915+105 is one of the most studied X-ray sources in our Galaxy due to its remarkably rich phenomenological diversity across the entire electromagnetic spectrum except the visible band. It was first detected in 1992 with the WATCH instrument on-board the GRANAT satellite (Castro-Tirado, Brandt, & Lund 1992). In contrast with other transient X-ray sources, it has never been switched off since detection. Its optical counter-part has not been detected due to a very high line-of-sight absorption (26 magnitude, Chaty et al. 1996). In the absence of optical observations, the binary parameters as well as the nature of the companion were unknown till 2001. Finally nine years after its detection, Greiner et al. (2001), by near-infrared spectroscopic observations with VLT, established it as a Low Mass X-ray Binary (LMXB) system with a K-M III type companion star of mass 1.20.2 M⊙. The black hole mass was determined to be 144 M⊙ which is the largest mass known so far for any black hole candidate in an X-ray binary. GRS 1915+105 achieved the status of micro-quasar much earlier in 1994 when Mirabel & Rodriguez (1994) detected episodes of superluminal ejections from this source, first time in any Galactic source. Observations of many such episodes of superluminal ejections during the past eight years make GRS 1915+105 distinct among other micro-quasars in our Galaxy. Apart from huge superluminal radio flares, GRS 1915+105 also shows various other types of radio emission like radio oscillations (Pooley & Fender 1997) and extended periods of steady, flat spectrum radio emission known as radio “plateau” states (Fender et al. 1999). These radio “plateau” states are particularly interesting due to their association with the large radio flares. It is found that the “plateau” states are almost always followed by large radio flares with steep spectrum (Hannikainen et al. 1998; Fender et al. 1999; Klein-Wolt et al. 2002), though so far there is no satisfactory explanation for this observed association.
The true glory of this source came into notice after the launch of NASA’s Rossi X-ray Timing Explorer (RXTE) in 1996. Pointed observations with RXTE-PCA showed extremely rich and exciting morphology in the X-ray intensity patterns (Greiner, Morgan, & Remillard 1996; Morgan, Remillard, & Greiner 1997; Muno, Morgan, & Remillard 1999). Similar diversity in the X-ray emission from this source was also observed with the Indian X-ray Astronomy Experiment (IXAE) (Paul et al. 1997, 1998; Yadav et al. 1999). Belloni et al. (2000) carried out a detailed analysis of all the RXTE pointed observations in 1996-97 and classified the complex diversity of the X-ray emission exhibited by this source into 12 classes on the basis of light curves and hardness ratios (one more variability class was identified later on - see Klein-Wolt et al. 2002; Naik, Rao & Chakrabarti 2002). They also put an important step forward in understanding the complexity of this source by showing that all the variability classes occur because of repeated transitions of the source in three basic states. They showed that the transitions between these three states, named as states A, B, and C, can be very fast i.e. within a few seconds. The states A and B are characterized by a soft spectrum with the total luminosity being low and high, respectively. The state C is characterized by a hard spectrum and the presence of strong Quasi Periodic Oscillations (QPO) in the power density spectrum.
This source is probably the best example for a strong connection between the accretion disk, manifested in the X-ray band, and the jet, manifested in the radio/IR band, in a black hole system (Pooley & Fender 1997; Eikenberry et al. 1998; 2000; Mirabel et al. 1998). Study of the correlated behavior of the source in the X-ray and the radio/IR wave bands plays a very important role in the endeavor of understanding this source and many attempts have been made so far to relate the X-ray emission characteristics with the episodes of various types of radio emission. Muno et al. (2001) studied representative observations in detail and showed that the properties of the QPO, like frequency, phase-lag, coherence etc. are correlated with the radio emission. Rau & Greiner (2003) showed that the properties of accretion disk are not correlated with the radio emission. Naik & Rao (2000) showed that the radio emission is high only during three variability classes: , and a sub-class of (/ or .)111 Belloni et al. (2000) divided class into four sub-classes , , and based on their order of occurrence. Out of these four sub-classes only and show high radio emission. However, later more such occurrences of class have been observed during which the radio emission is high. Thus, instead of numbered sub-classes, class can be divided into two generic sub-classes radio-quiet () and radio-loud (). The sub-class corresponds to the radio “plateau” states. They suggested that the radio emission is associated with the soft X-ray dips (short periods of state A) observed in the classes and , apart from the sub-class . Naik et al. (2001) detected similar dips in the X-ray light curve during the presence of a large radio flare indicating their association with large radio flares.
Klein-Wolt et al. (2002) studied all simultaneous observations of the source by RXTE and Ryle Telescope and showed that the radio emission is associated with only state C and not with states A or B. They also found an one-to-one relation between series of long ( 100 s), well separated state C intervals and radio oscillation events. They suggested a scenario, according to which the long uninterrupted state C intervals are associated with continuous jets which give “plateau” radio emission, whereas if the state C intervals are well separated by other states then the radio oscillation events are observed. A different picture, however, emerges when the association of the radio emission with the different sub-classes of (state C) are examined in detail (see discussion in section 4.2 for more details on this).
The sub-classes of class can be divided into two different types of hard states: radio-loud hard state (i.e. ) and radio-quiet hard state (i.e. ) (Vadawale et al. 2001b; Trudolyubov 2001). By a detailed spectral study of RXTE observations of the source belonging to the two types of hard states, Vadawale et al. (2001b) showed that the wide band X-ray spectrum of state consists of two components: a multicolor disk-blackbody and a Comptonized component whereas the wide band X-ray spectrum of state consists of three components: a multicolor disk-blackbody, a Comptonized component and a power-low. They further showed that the additional power-law component can be modeled as due to synchrotron radiation in X-rays, coming from the base of a continuous jet which is present only during the states. This three-component picture gets further support from other results such as: only the Comptonized component is responsible for the low-frequency QPO (Rao et al. 2000) and both the QPO as well as the Comptonized component are absent during the soft dips (short state A periods) observed in class (Vadawale et al. 2001a). It should be noted that the radio-loud hard state also occurs as a part of other variability classes like and . Hence we will refer it generically as , whereas the particular sub-class of class during which the radio emission is high, will be referred as .
In this paper we explore the association of the radio “plateau” states with large superluminal radio flares and try to envisage a scenario to explain this association as well as the various types of radio emission observed from this source. Since there are not many detailed studies of such episodes of superluminal jet emissions, in the first part of the paper we present a detailed study of a complete sequence of flare morphology described, sequentially, by a small flare, “plateau” state, a disturbed accretion disk and a superluminal jet. We report the observations of the source with Giant Meter-wave Radio Telescope (GMRT) at 1.28 GHz when the source exhibits a flare which turned out to be a pre-plateau flare. We also present the results of a detailed analysis of all the pointed RXTE observations during this flare cycle which confirm the three-component X-ray spectral description of the pre-flare “plateau” state. In order to confirm the three-component description during all occurrences of the “plateau” state, we further carry out similar analysis of representative pointed RXTE observations prior to all huge radio flares identified in the GBI monitoring data on this source. Finally we summarize the results and propose a phenomenological model for different types of radio emission from this source.
2 Observations : 2001 June-July radio flare episode
2.1 GMRT observations
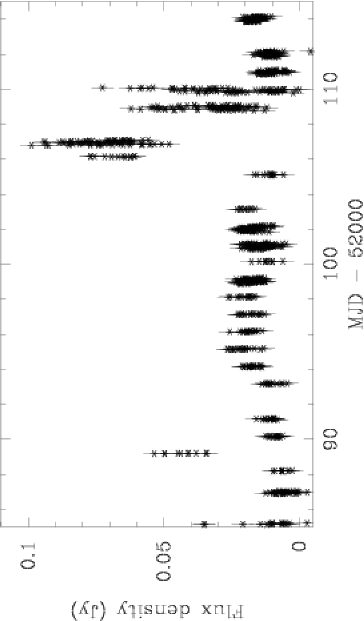
Radio observations of the micro-quasar GRS 1915+105, at 1.28 GHz with a band pass of 16 MHz, were carried out with GMRT (Swarup et al. 1991) on 2001 June 18, 22, 23, 27, 28, 29, 30 and July 1. The flux density scale was set by observing the primary calibrator 3C286 / 3C48. A phase calibrator was observed before and after a 45 minutes scan on GRS 1915+105. The integration time during the source observations was 32 s. The data reduction and analysis were done by using the standard Astronomical Image Processing System (AIPS) package. The observations on 2001 June 18, 22, 23, and 27 were of 30-60 minutes, whereas on June 28, 29, 30 and July 1, the observations were of 8-10 hours. Light curves, with 32 s integration time, were extracted from each of the individual observations of the source and are shown in Figure 1.
It can be seen from the figure that the source was quite steady on June 18 with a very low flux density (10 mJy). The source was found to be bright in radio on June 22 with a flux density of 50 mJy, along with a sharp dip with a decrease in the flux density by a factor of 2. On June 23 the source was steady at about 30 mJy. It was very weak ( 5 mJy) on June 27. From June 28 onwards the observations were of long durations (8 – 10 hours) and hence a wide range of flux variabilities could be studied. On June 28 the source was found to be very weak at the beginning of the observations (UTC 17 hour), but the radio flux density gradually increased to 50 mJy followed by a sharp decrease to 5 mJy at the end of observations (UTC 24 hour). On the other hand, on June 29, the source was bright in radio with flux density 70 mJy at the beginning which decayed down to 10 mJy towards the end. The source was relatively weak and steady on June 30 and July 1. It can be seen that the radio emission is highly variable over time scales of a few tens of minutes, similar to that observed during mini flares (or “baby jets”). Analyzing many individual “clean” flares from the same data, Ishwara-Chandra et al. (2002) have tried to model these flares as due to adiabatically expanding synchrotron emitting clouds.
2.2 Radio observations by other telescopes
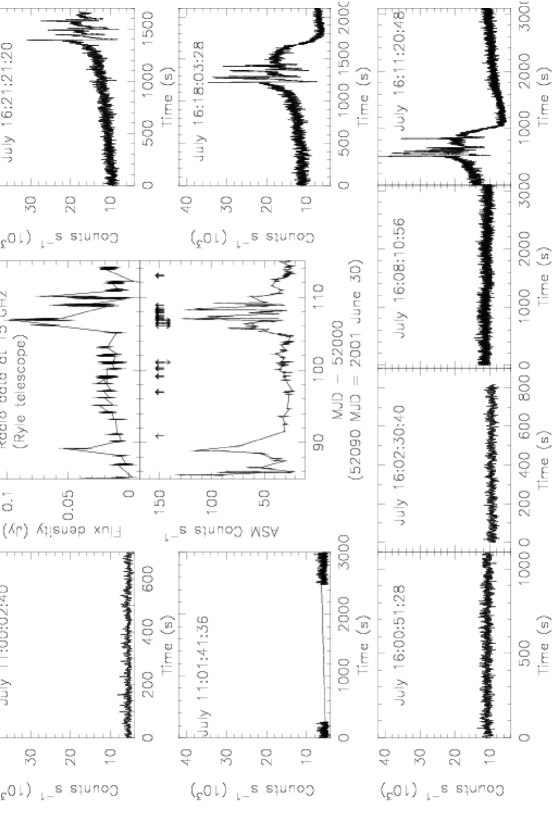
To corroborate the results from the GMRT observations, we obtained radio monitoring data of GRS 1915+105 from 2001 June 15 to July 25 observed with the Ryle telescope at 15.2 GHz (Pooley & Fender 1997). Radio light curves at 15.2 GHz are shown in Figure 2. A strong radio flare was observed on June 21 which was narrowly missed by GMRT. Radio flares with low peak flux density were also observed with both GMRT and Ryle telescopes on June 28 and 29. Similar flux densities at 1.4 GHz and 15.2 GHz suggest the flat nature of the spectrum during the flares. It can be seen, from Figure 2, that the source went into a radio-loud “plateau” state after the GMRT observations which is followed by a radio flare on July 16, observed with the RATAN telescope (Dhawan et al. 2003). The flux density of this flare was much higher at lower frequencies (as observed by RATAN) compared to that at 15 GHz (as observed by Ryle) suggesting a steep spectrum during the flare. This source was also observed by VLBA on July 16, 17 and 18 at 2.25, 8.3 and 15 GHz. VLBA observations clearly showed an ejecta well separated from the core (Dhawan et al. 2003).
These observations suggest that this superluminal flare episode followed a typical sequence of events observed during the past episodes of superluminal flares. It started with a small flare, which was observed by GMRT, followed by a long radio “plateau” state, followed by superluminal ejections. It is thought that the different types of radio emission are results of changes in the accretion flow which are directly reflected in X-rays. Thus to understand the sequence of these events it is necessary to make a detailed analysis of the X-ray observations during this time period.
2.3 RXTE pointed observations
To investigate the X-ray properties of the source during and before this 2001 July 16 flaring episode, we analyzed all the 20 available RXTE pointed observations of GRS 1915105 from 2001 June 30 to 2001 July 16. Standard procedures for data reduction, response matrix generation, and background estimation were followed using the software package HEASoft 5.2. For spectral analysis we used Standard-2 mode data from Proportional Counter Array (PCA) and Archive mode data from HEXTE Cluster-0. We added the count rate spectrum of all layers of individual Proportional Counter Units (PCUs) and all available PCUs together. Analyzing the spectra of Crab with the new response matrices, it is found that 0.5% systematic error is required to achieve an acceptable fit and the value of the power-law photon index is also found to be close to the canonical value of 2.1. Systematic error of 0.5% is, therefore, added to the PCA spectra of all the observations used in the present work.
X-ray light curves with 1 s time resolution (Standard-1 mode) are generated for all the 20 observations. It is found that during all the RXTE/PCA observations before 2001 July 16, the source was in a hard state (i.e. the source state is whereas the class is ). Light curves of all the RXTE/PCA observations on July 16 and the last two RXTE/PCA observations before July 16, along with the X-ray (RXTE/ASM) and radio (Ryle telescope) monitoring light curves, are shown in Figure 3. It can be seen from Figure 3 that the last three pointed RXTE/PCA observations on July 16 clearly show evidence for a disturbed accretion disc. The first three pointed observations on July 16 (when the radio flare is already on) show enhanced X-ray emission, which could be either an enhanced class or the steady part of the X-ray emission during a disturbed accretion disc. Because of the gaps between the pointed observations, it is not possible to precisely identify the time of occurrence of the state change from the X-ray light curves. We carried out a detailed timing and spectral analysis of all the 20 RXTE observations to examine the X-ray properties so that the time of occurrence of the state change could be better understood.
2.3.1 Timing Analysis
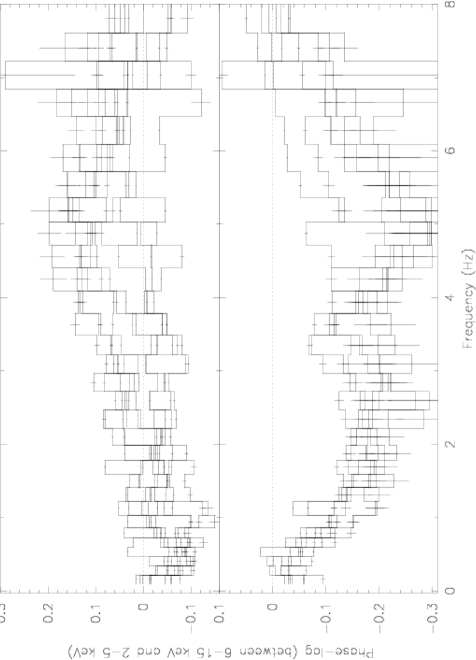
For timing analysis, Single-Bit mode data, available in the energy ranges of 3.6 – 5.7 keV and 5.7 – 14.8 keV, are used. Power density spectra (PDS) of 256 bin light curves are generated and co-added for every 16 seconds to achieve better signal to noise ratio. Results of timing and spectral analysis are given in Table 1, along with the log of observations. The parameters for one representative observation per day (before the radio flare) and all observations carried out on July 16 (when the radio flare commenced) are given in the table. Quasi periodic oscillations (QPOs) in 1 – 3 Hz frequency range are seen in the PDS of all the RXTE observations made before July 16, whereas the PDS of all observations on July 16 show QPOs at 4 Hz (see Table 1a). Along with the PDS, phase-lag spectra are also generated by multiplying the imaginary part of the coefficients of the power density spectra in the above two energy ranges (Reig et al. 2000). Individual phase-lag spectra for each 16 s interval were also co-added. Phase-lag spectra of all the observations are shown in Figure 4. The top panel of Figure 4 shows the phase-lag spectra of all observations made before July 16 (“plateau” state) and the bottom panel shows the phase-lag spectra of all observations made on July 16 (including those showing flare/dips, however, these phase-lag spectra are calculated only for the steady portion of the light curve). It can be seen that there is a clear difference in the overall shape of the phase-lag spectra. In order to quantify the shape of the phase-lag spectra of the observations before and on July 16, we applied KS test which shows that these two distributions are different with 99.99% confidence level significance. The reason for this difference in the shape of the phase-lag spectra is not clear, however, it is possible that the ejected matter during the X-ray disturbance (see next section) might be playing some role here as suggested by Pottschmidt et al. (2000). However, the difference clearly shows that the source state before July 16 is different from the state during the steady observations on July 16 and the disturbance in X-rays has already occurred before the first observation on July 16.
2.3.2 Spectral Analysis
XSPEC package (Ver. 11.2) is used for the spectral analysis. A simultaneous fit to the PCA (in the energy range of 3 - 35 keV) and HEXTE (in the energy range of 20 - 150 keV) data was carried out, keeping the relative normalization as a free parameter. A fit with any continuum model shows strong residuals near 6.4 keV and any fit without a Gaussian line at this energy is not acceptable. Such residuals, though with a low amplitude, are also seen in the Crab spectra obtained with PCA. It is not clear what fraction of the residuals is really due to the source and what fraction is due to an instrumental artifact. The line feature at 6.4 keV, therefore, will not be discussed further in this paper. It is found that a model consisting of three components: a disk-blackbody, a power-law and a Comptonized component (CompTT in XSPEC, see Titarchuk 1994) is required for a statistically and physically acceptable fit to the source spectra (see Vadawale et al. 2001b for a comparison of the various models). The best-fit parameters along with the continuum flux of individual spectral components are given in Table 1. It can be seen from Table 1 that the equivalent hydrogen column density is very high compared to the values reported in the literature (e.g. Muno et al. 1999; Vilhu et al. 2001). Spectral fitting with this three-component model requires NH to be within 12 15 with 99% confidence level. The derived inner-disk radii (Rin) are also found to be high during these observations, compared to the reported values (e.g. Rau & Greiner 2003). However, these apparently high values of Rin are physically plausible i.e. 15 – 25 Rg for a 14 M⊙ black hole. The inner disk temperature (kTin) and the plasma temperature (kTe) for all the observations are 0.5 keV and 7–11 keV respectively and are acceptable. It should be noted that on June 30 (MJD 52090), when the radio emission was relatively low (the “plateau” started on July 1), the spectral and timing parameters are different from the rest of the observations with the value of NH being close to the reported value, which gives confidence for the applicability of this three-component model to the state of this source.
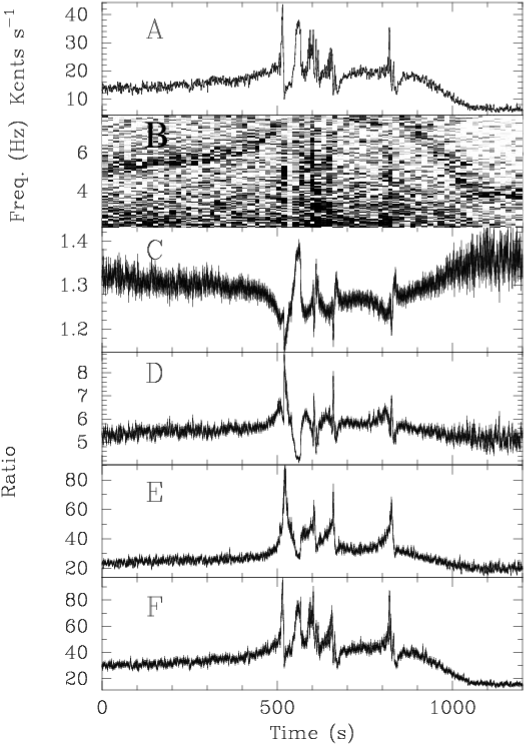
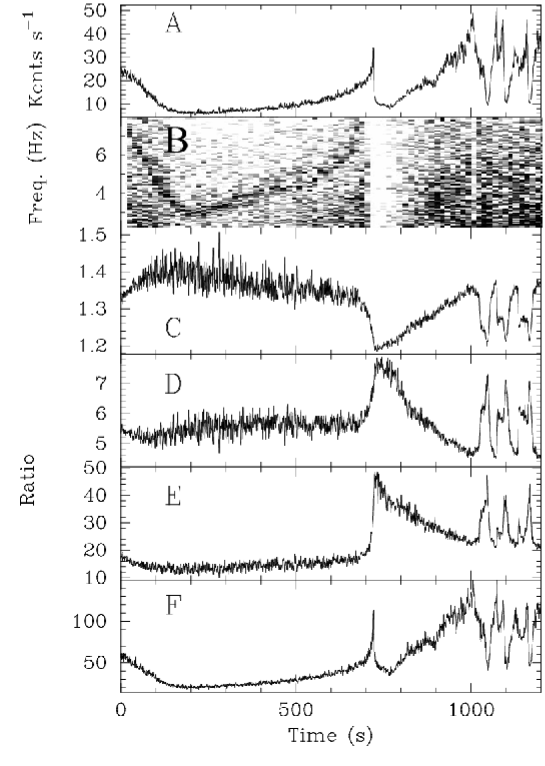
The presence of short duration and irregular flares and dips in the X-ray light curves of RXTE observations on July 16 makes spectral fitting extremely difficult during the individual flare/dip events. To examine the properties of the source during these flares and dips, we follow the ratio method used by Vadawale et al. (2001a). Figure 5 shows the Standard-1 light curve in the 2–60 keV energy band and the dynamic PDS along with the ratios of the Standard-1 light curve to the light curves in 2–8, 8–15, 15–23 and 23–60 keV energy ranges. The second panel of the figure shows that the low frequency 4–7 Hz QPO, present in the steady part of the light curve, is absent during the dips. The third panel of the figure shows that during the dips, the decrease in the count-rate in 2-8 keV range is less than that in the total count-rate. Inverted shapes of dips in the fourth and the fifth panels show that the counts in the energy band of 8-23 keV are preferentially decreased compared to the decrease in the total count rate (see Figures 8 and 9 for a clear picture where the dips are of longer duration). Preferential decrease in the count rate in the 8-23 keV energy band strongly supports the inference drawn by Vadawale et al. (2001a) that the Comptonized component, which is dominant in this energy band, is absent during these dips. The absence of QPO during these dips (Figure 5, second panel), and the observation that the Comptonized component is responsible for the QPO in the hard () states (Rao et al. 2000), further strengthen the suggestion that the Comptonized component vanishes during the dips.
3 Large flares observed by GBI and RXTE-ASM
Our detailed analysis around the 2001 July radio flare (during which a separate ejecta was detected by VLBI, exhibiting superluminal ejection) shows that before the flare, the source was in state consisting of three spectral components: a multi-color disk blackbody, a power-law, and a Comptonized component. During the radio flare, the source showed a dipping behavior during which the Comptonized component of the X-ray spectra appears to be vanishing. A similar behavior of the source was observed during the superluminal ejection episode of 1999 June (Dhawan et al. 2003) and 1997 October (Fender et al. 1999). The source was in state before the flare (Rao et al. 2000; Vadawale et al. 2001b) and pointed observation during the flare showed soft dips (state A period) during which the Comptonized component vanishes. This leads to an interesting suggestion that the preceding state and the presence of soft dips (state A periods) are the characteristics of all superluminal ejection episodes.
To verify this suggestion we carried out a similar analysis for all possible superluminal radio flares observed during the period of 1996 December to 2000 April when GBI radio monitoring data are available. Apart from the superluminal episodes in 1997 October and 1999 June, there is one more occasion, 1998 May, during which a separated ejecta is reported (Dhawan et al. 2000). However, a complete GBI monitoring radio light curve from 1996 December to 2000 April shows many other large flares and it might be possible that some such ejection episodes are missed. Therefore, we selected all large flares ( 350 mJy at 2.25 GHz) from the GBI monitoring data. It is found that there are 9 flares satisfying this criteria, the characteristic properties of which are given in Table 2. The GBI and ASM monitoring radio light curves of the source during all these 9 selected radio flares are shown in Figure 6 along with the complete monitoring light curves from GBI, ASM and BATSE. All the large radio flares, during which separate ejecta are reported so far, show a fast rise and exponential decay (FRED) with decay time constant of the order of 3 days. It can be seen, from Table 2 and Figure 6, that the characteristic properties of 3 other radio flares (1998 April 13, 1998 June 3 and 1999 December 23) are found to be similar to those 3 flares during which superluminal ejection is reported. Hence we assume that all flares with the FRED morphology are superluminal flare episodes and we give the integrated flare energy (in units of Jy.day) in Table 2. The GBI light curve also shows that the source was in radio “plateau” state prior to the all six ‘assumed’ superluminal flares whereas the ASM light curves during these periods show that the source was in low and steady X-ray state. The properties of the three radio flares without FRED such as shape of the radio flares, variability in ASM light curve prior to the flares, are different from those seen during the superluminal radio flares.
A closer look at Table 2 reveals an interesting fact that the average ASM count rate and the GBI flux during the pre-flare “plateau” state show a strong correlation suggesting a strong coupling between the X-ray and radio emission. In Figure 7 (left panel) we show a plot of GBI flux against the ASM count rate along with a best-fit straight line. We derive a correlation coefficient of 0.96 (98% confidence level). This could be similar to the correlation between the X-ray and the radio emissions found in the Galactic black hole candidate sources (see eg. Gallo, Fender & Pooley 2003; Choudhury et al. 2003).
We also find that the average pre-flare ASM count rate and the total flux integrated over the duration of the flare are also strongly correlated. In Figure 7 (right panel) we show this correlation (with a correlation coefficient of 0.98) which is significant at 99% confidence level. The correlation between the pre-flare ASM count rate and the integrated flare flux is particularly interesting, given the temporal and spatial separation between the two types of emission. It shows that the pre-flare “plateau” state plays a crucial role in the formation of the large superluminal radio flares.
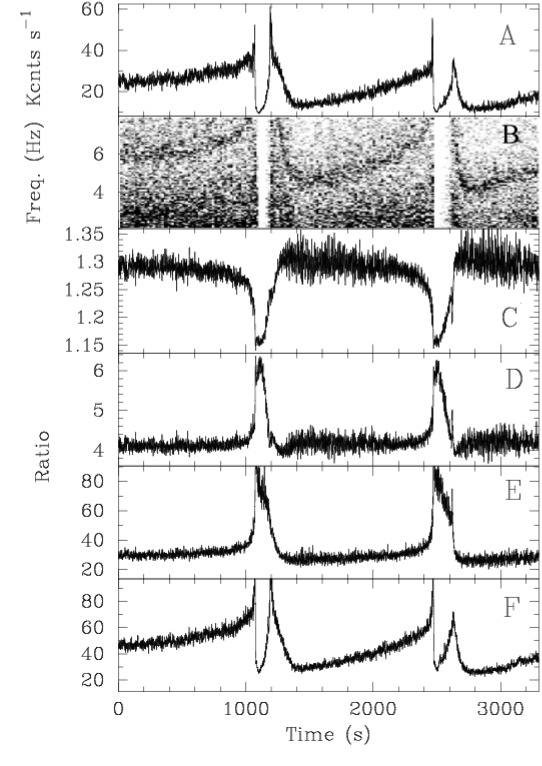
To quantify the timing and the spectral properties of the pre-flare states of all the six selected flares, we have done a detailed analysis of the RXTE pointed observations during these steady states. As the properties of the source are rather stable during these states, we analyzed two RXTE observations immediately before each flare. We also analyzed the RXTE observations on 1997 October 30 and 1999 June 8, which are the only pointed observations of the source during the rising phase of superluminal flares. We adopted a similar analysis procedure described in the previous section and fitted the same three-component model to the source spectra of all the observations. The log of observations and the best-fit spectral parameters are given in Table 3. The results of analysis of the two pointed observations during the onset of superluminal flares are shown in Figure 8 and 9, which are similar to Figure 5.
We find that X-ray spectrum during all the pointed RXTE observations immediately before the selected flares can be fitted by our model consisting of three components: a disk-blackbody, a Comptonized component and a power-law. This confirms our three-component description of the state. Both the available observations close to but after the onset of the radio flare shows dipping behavior as shown in Figures 8 and 9. It can be seen that, though the morphology of the X-ray light curves (classes according to Belloni et al. 2000) is different in all the pointed observations during the superluminal flares (Figures 5, 8 and 9), the properties of the source during the dips are the same. The absence of QPOs during the dips in X-ray light curves (panel B of the above three figures) and the preferential decrease in 8 – 23 keV count rate (as seen from the inverted shape of the ratios in panels D and E of these figures) confirm the absence of the Comptonized component during the dips. We have verified, for a large number of observations containing similar soft dips (state A periods), that the characteristics of all the soft dips are similar. Thus it seems that the preferential decrease in 8 – 25 keV range, suggesting the absence of the Comptonized component, is rather a general feature of all the soft dips (short state A periods) seen in this source. This leads to an interpretation that the central Compton cloud is ejected away during all the soft dips. Similar conclusion of mass ejection during dips of type A is drawn by Yadav (2001) on the basis of their spectral study during the class .
4 Discussion
We have presented a detailed study of all the candidate superluminal ejection episodes of GRS 1915+105, identified from the GBI, ASM, and BATSE monitoring observations. It should be noted here that there are at least two other episodes of large flares, first one during 2000 July-August, reported by Fender et al. (2002a) which follows the “plateau” state – large flare sequence and the other during 2001 March reported in Fender et al. (2002b) for which the superluminal ejection was observed directly. We have verified that the results presented here are consistent with the RXTE pointed observations during 2000 July-August 2000 flare episode. For the 2001 March flare episode, unfortunately, both RXTE-PCA and RXTE-ASM coverage are poor and hence the pre-flare state cannot be established, but we believe that it must be .
Results presented in the previous sections confirm the suggestions that (i) the wide band X-ray spectrum during the state has three spectral components: a multicolor disk-blackbody, a Comptonized component and a power-law (ii) the soft dips (short periods of state A) are present in the X-ray light curve observed during the onset of superluminal flares, (iii) the Comptonized component is absent during the soft dips. These results lead to an interesting suggestion that the Compton cloud is ejected away during the soft dips. Formation of a central hot region can be explained under the Two Component Accretion Flow (TCAF) paradigm as the hot, quasi-spherical, post shock region near the black hole (Chakrabarti & Titarchuk 1995, Chakrabarti 2001 and references there in) which is responsible for the presence of the Comptonized component (Rao et al. 2000). Ejection of the central Compton cloud can be explained if magnetic field is included in the TCAF framework (Nandi et al. 2001). The pre-flare states are known to have a steady jet and the sudden ejection of matter in the previously established jet raises an interesting possibility for the origin of the superluminal flares in terms of the internal shock model.
4.1 A Mechanism for superluminal motion?
Apparent superluminal motion of blobs during the large radio flares of Galactic micro-quasars is one of the most spectacular phenomena of high energy astrophysics. GRS 1915+105 is the only source which shows repeated episodes of large radio flares exhibiting superluminal motion. The apparent superluminal motion can be understood as geometric effect due to very high intrinsic velocity (i.e. close to ) of the moving blob at some angle with the line of sight. So far attempts have been made to understand the superluminal motions based on two different ideas: (1) matter blob moving at very high velocity and (2) shocks moving through a relatively slowly moving medium. Atoyan & Aharonian (1999) showed that it is possible to reproduce the observed radio light curves of the separating blobs in terms of ejection and evolution of discrete plasmons, however, the instantaneous power requirement is very high in this model. Further they found that a single population of relativistic particles accelerated at the time of ejection of the plasmon cannot explain the observations and a continuous replenishment of relativistic particles is necessary. The continuous acceleration of particles comes naturally in the alternative model, the internal shock model proposed by Kaiser, Sunyaev & Spruit (2000). They show that if the moving blobs are the traveling shock front arising due to differential velocity of the moving continuous jet material then it is possible to reproduce the observed light curves. The total energy requirement is the same as the plasmon model, however, the rate at which the energy supplied from the central source is much lower than that in the plasmon model.
The presence of the underlying continuous jet and the differential velocity of the moving matter are assumed a priori in the internal shock model and no attempt has been made to explain them. However, it can be seen that, in the context of the present work, these requirements are met quite naturally if the sudden ejection of the Compton cloud (i.e. the state A dip) occurs after a prolonged period of state. The velocity of the ejected matter blob can be higher than the velocity of the matter in the underlying continuous jet, and hence as the ejected matter blob passes through the jet it creates an internal shock at the leading front where particles can be accelerated. Gallo et al. (2003) showed that, in other GBHCs, the velocity of the matter in steady jets is lower than that during transient events. This gives further confidence to the picture of the ejected mass driving through slower steady flow causing the internal shock. This moving internal shock can then be observed as separating blobs in the radio images. This suggestion provides a rather complete picture for the different types of radio emission from this source as described in the next section.
4.2 The suggested scenario
The results obtained from our analysis as well as the various results on radio flares reported in the literature, can be summarized as follows.
-
•
All superluminal radio flares, during which a separated ejecta is reported, as well as candidate superluminal flares for which there is no report of observation, are preceded by the “radio-loud hard () state”.
-
•
The source spectrum during state consists of three components: a multicolor disk-blackbody, a Comptonized component and a power-law. Large values of the derived inner disk radius suggest a geometry in which there is a hot spherical Compton cloud (responsible for the Comptonized component) surrounded by a thin disk (responsible for the disk-blackbody component).
-
•
Whenever there is a pointed X-ray observation during the onset of a superluminal radio flare (3 out of 7 cases), the light curve shows soft dips (small state A episodes). During such dips, the Comptonized component is absent in the source spectrum.
-
•
High radio emission is observed from the source only during the X-ray variability classes having soft dips (short state A periods) apart from the radio “plateau” periods.
-
•
All superluminal flares show a characteristic fast rise and exponential decay profile in their radio light curve, which cannot be explained by the blob-ejection mechanism. Such profiles can be explained by the internal shock model of Kaiser et al.(1999). According to this model, the motion of the matter blob through the already present matter is seen as the moving ejecta during high spatial resolution radio observations.
-
•
The radio “Plateau” () state is known to have steady jets which eject a continuous stream of matter. Thus if a blob-ejection occurs after a “plateau” state, it will satisfy the requirement of the internal shock model and gives rise to a superluminal radio flare.
-
•
The total integrated flux during the superluminal flares is highly correlated with the observed X-ray flux during the preceding states.
These points suggest a scenario for different types of radio emission observed from this source.
-
•
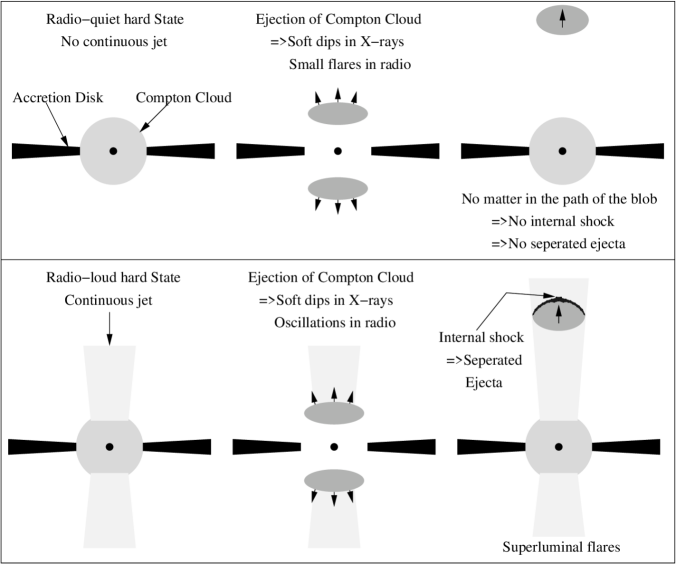
The states have continuous jets and prolonged episodes of such states give rise to steady high radio emission with flat spectrum which arises from the continuous jet. This is a fairly robust statement as the compact jets have actually been observed during the episodes of states (Dhawan et al. 2000).
-
•
The ejection of the Compton cloud during a soft (state A) dip gives rise to a small radio flare. Repeated occurrence of such dips gives rise to radio oscillation events. It should be noted that the amplitude of the isolated flares or the radio oscillation events will depend on various aspects like the amount of mass outflow during the immediately previous state, the amount of mass ejected during the dips etc. Hence, it might not be possible to always observe small radio flares or oscillation when such dips are present in X-ray, though, in such cases the average radio emission should be high. However, this means that whenever radio oscillations are observed, the soft dips must be present in the X-ray light curves.
-
•
If the occurrence of the soft (state A) dip is preceded by a prolonged period of state having a continuous jet then it satisfies the requirements of the internal shock model and gives rise to the observed superluminal motion of blobs as seen in high resolution radio images.
A schematic picture of this scenario is shown in Figure 10. According to this scenario, any short time variation in the radio flux is caused by the occurrence of the soft (state A) dips during which the Compton cloud is ejected. This is slightly different from the inference drawn by Klein-Wolt et al. (2002) that only state C episodes are related to the radio emission. They find that it is necessary to have the state C episodes well-separated in order to have radio oscillation events. However, there are X-ray variability classes like which show long, well separated periods of state C, but the average radio flux during class is much lower compared to the classes , which also have well separated long state C periods (Naik & Rao 2000). This can be explained in our scenario according to which, the state C periods in class are actually state periods whereas the state C periods in classes , are actually state periods. Further, it can be seen that such well-separated state C episodes, when the radio oscillations are observed, are almost always accompanied by state A dips. Thus the one-to-one relation between the state C episodes and the radio oscillation events found by Klein-Wolt et al. (2002) is valid in our scenario also. It should be noted that Figure 3g of Klein-Wolt et al. (2002) does not show any oscillations in the presence of class . According to our scenario it is possible not to have radio oscillations in the presence of state A dips, i.e. because of close ejection events etc., but not vise-versa. As a counter example, Figure 10 of Dhawan et al. (2000) show clear oscillations during the presence of class . This picture is further supported by the pointed radio observation near the onset of the superluminal flare in 1997 October by Fender et. al (1999), which shows core oscillations as well as superluminal jets on 1997 October 30 and 31. On both these days the source was in class which shows A type dips after C state (Yadav 2001). The hypothesis of mass ejection during the soft dips is also supported by the calculation of time delay between emissions at different frequencies as presented by Ishwara-Chandra et al. (2002). They show that the IR emission follows the mass ejection with almost zero time delay. It is known that IR flares start at the time of spike (in beta class) which marks the beginning of A type dips (Eikenberry et al. 1998).
There are some important cross-checks for this scenario. First of all, it predicts that the separated ejecta should not be observed for any radio flare other than those having FRED profile and are preceded by states. Also whenever radio oscillations are observed, the soft (state A) dips must be present in the X-ray light curve. A large data base of radio and X-ray observation of GRS 1915+105 has been collected so far and all the reported observations satisfies these criteria. However, the most important aspect of this scenario, to be tested with future observations, is the three-component description of the wide band X-ray spectra during the state. This can be verified, for example, by high sensitivity observations above 50 keV, where the differences in the variation of the RMS power of the QPO with energy between and state will show the existence of additional component which is not participating in the QPO. It should be noted that according to this picture, the low luminosity and soft spectrum of state A is due to the absence of the central Compton cloud. However this applies only to the short duration state A period appearing as soft dips. There exists a variability class during which the source appears to be in state A for much longer duration (days) which can not be explained in the present picture (see, however, Vadawale et al. 2003 for an attempt to understand the class as due to obscuration of the Compton cloud).
This mechanism suggests that whenever there is a state, the next soft X-ray dip events will give rise to a superluminal flare. Thus it provides a very important handle in predicting the occurrence of a flare which can help to plan new coordinated observation of large flares. Such observations can lead to further understanding of very important questions like exact mechanism of ejection, cause of ejection, acceleration of the matter etc. It can be seen that a continuous hard X-ray and radio monitoring is very important in distinguishing state and states. Unfortunately, after CGRO-BATSE there is no hard X-ray monitor currently available making an important observation handle on the occurrence of state unavailable. The Solar X-ray Spectrometer (SOXS), which is a small phoswich type open hard X-ray detector (Malkar et al. 2003), will also perform daily monitoring of a few bright sources and hence might be useful in predicting large superluminal flares from this source.
5 Conclusion
In this paper we have tried to explain the observed association between the radio “plateau” or the states and the superluminal flares in GRS 1915+105. All states have very similar X-ray spectral properties and show a three-component spectra. We have further shown that the soft X-ray dips are observed near the onset of radio flares. During such dips the Comptonized component is absent, which we propose as due to the ejection of the central Compton cloud. This ejected matter is then responsible for the low frequency emission which can be observed as an isolated flare or regular oscillations (if the dips are repeating). Such ejections might give rise to superluminal flares if these dip events are preceded by a state according to the internal shock model for the superluminal flares. Two definite predictions of this scenario are that (1) whenever radio oscillations are observed, the soft dips will be present in the X-ray light curves and (2) if is not preceded by any radio flare it will not have the characteristic FRED shape and will not show separated ejecta. It also suggests that in the future whenever is observed, there are very good chances to catch a superluminal flare in ‘live action’ and well coordinated multi wavelength observations of such an event will help understanding of the fundamental questions underlying such events.
6 Acknowledgments
We thank the members of the RXTE, BATSE, and GBI teams for making the data publicly available. This research has made extensive use of data obtained through the High Energy Astrophysics Science Archive Research Center (HEASARC) online service, provided by NASA/Goddard Space Flight Center. The Green Bank Interferometer (GBI) is a facility of the National Science Foundation operated by the NRAO in support of NASA High Energy Astrophysics programs.
References
- (1) Atoyan, A. M. & Aharonian, F. A. 1999, MNRAS, 302, 253
- (2) Belloni, T., Klein-Wolt, M., Mendez, M., et al. 2000, A&A, 355, 271
- (3) Castro-Tirado, A.J., Brandt, S., & Lund, N. 1992, IAU Circ., 5590.
- (4) Chakrabarti, S. K. 2001, ApSSS, 276 191
- (5) Chakrabarti, S. K. & Titarchuk, L. G. 1995, ApJ, 455, 623
- (6) Chaty, S., Mirabel, I. F., Duc, P. A., Wink, J. E. & Rodriguez, L. F. 1996, A&A, 310, 825
- (7) Dhawan V. et al. 2003, in preparation
- (8) Dhawan, V., Mirabel, I. F. & Rodriguez, L. F. 2000, ApJ, 543, 373
- (9) Eikenberry, S. S., Matthews, K., Morgan, E. H., Remillard, R. A. & Nelson, R. W. 1998, ApJ, 494, L61
- (10) Eikenberry, S. S., Matthews, K., Muno, M. et al. 2000, ApJ, 532, L33
- (11) Fender, R. P., Rayner, D., McCormick, D. G. et al. 2002b, MNRAS, 336, 39
- (12) Fender, R. P., Rayner, D., Trushkin, S. A. et al. 2002a, MNRAS, 330, 212
- (13) Fender, R. P., Garrington, S. T., McKay, D. J. et al. 1999, MNRAS, 304, 865
- (14) Gallo, E., Fender, R. P. & Pooley, G. G. 2003, accepted in MNRAS, astro-ph/0305231
- (15) Greiner, J., Morgan, E. H. & Remillard, R. A. 1996, ApJ, 473, L107
- (16) Greiner, J., Cuby, J. G., & McCaughrean, M. J. 2001, Nature, 414, 522
- (17) Hannikainen, D., Hunstead, R. & Campbell-Wilson, D. 1998, New Astronomy Reviews, 42, 601
- (18) Ishwara-Chandra, C. H., Yadav, J. S., & Pramesh Rao, A. 2002, A&A, 388, L33
- (19) Kaiser, C. R., Sunyaev, R. & Spruit, H. C. 2000, A&A, 356, 975
- (20) Klein-Wolt, M., Fender, R. P., Pooley, G. G., et al. 2002, MNRAS, 331, 745
- (21) Malkar, J. P., Janawlekar, S. B., Kothare, A. T. et al., 2003, BASI, to appear
- (22) Mirabel, I. F., & Rodriguez, L. F. 1994, Nature, 371, 46
- (23) Mirabel, I. F., Dhawan, V., Chaty, S. et al. 1998, A&A, 330, L9
- (24) Morgan, E. H., Remillard, R. A. & Greiner, J. 1997, ApJ, 482, 1010
- (25) Muno, M. P., Morgan, E. H. & Remillard, R. A. 1999, ApJ, 527, 321
- (26) Muno, M. P., Remillard, R. A., Morgan, E. H., et al. 2001, ApJ, 556, 515
- (27) Naik, S., Rao, A. R. & Chakrabarti, S. K. 2002, JApA, 23, 213
- (28) Naik, S., Agrawal, P. C., Rao, A. R., et al. 2001, ApJ, 546, 1075
- (29) Naik, S., & Rao, A. R. 2000, A&A, 362, 691
- (30) Nandi, A., Chakrabarti, S. K., Vadawale, S. V., & Rao, A. R. 2001, A&A, 380, 245
- (31) Paul, B., Agrawal, P. C., Rao, A. R. et al. 1997, A&A, 320, L37
- (32) Paul, B., Agrawal, P. C., Rao, A. R. et al. 1998, A&AS, 128, 145
- (33) Pooley, G. G. & Fender, R. P. 1997, MNRAS, 292, 925
- (34) Pottschmidt, K., Wilms, J., Nowak, M. A. et al. 2000, A&A, 357, L17
- (35) Rao, A. R., Naik, S., Vadawale, S. V. & Chakrabarti, S. K. 2000, A&A, 360, L25
- (36) Rau, A., & Greiner, J. 2003, A&A, 397, 711
- (37) Reig, P., Belloni, T., van der Klis, M. 2000, ApJ, 541, 883
- (38) Swarup, G., Ananthakrishnan, S., Kapahi, V. K., et al. 1991, Curr. Sci, 60, 95
- (39) Titarchuk, Lev 1994, ApJ, 434, 570
- (40) Trudolyubov, S. P. 2001, ApJ, 558, 276
- (41) Vadawale, S. V., Rao, A. R. & Naik, S. 2003, Proc. of the 4th Microquasar Workshop, eds. Ph. Durouchoux, Y. Fuchs and J. Rodriguez, (Center for Space Physics, Kolkata), 338
- (42) Vadawale, S. V., Rao, A. R., & Chakrabarti, S. K. 2001b, A&A, 372, 793
- (43) Vadawale, S. V., Rao, A. R., Nandi, A., & Chakrabarti, S. K. 2001a, A&A, 370, L17
- (44) Vilhu, O., Poutanen, J., Nikula, P. & Nevalainen, J. 2001, ApJ, 553, L51
- (45) Yadav, J. S., Rao, A. R., Agrawal, P. C, et al. 1999, ApJ, 517, 935
- (46) Yadav, J. S. 2001, ApJ, 548, 876
| A: Observation log, QPO frequency and the observed fluxes | |||||||
| ObsId1 | Date | Start | 3 – 150 keV flux (in 10-8 erg cm-2 s-1) | ||||
| Time (UT) | (Hz) | Ftotal | Fdbb | Fctt | Fpow | ||
| A-65-00 | June 30 | 21:35:28 | 3.124 | 2.44 | 0.27 | 1.38 | 0.77 |
| A-66-00 | July 06 | 21:18:24 | 1.901 | 1.95 | 0.20 | 0.95 | 0.71 |
| A-66-01 | July 07 | 00:41:36 | 1.908 | 1.92 | 0.22 | 1.01 | 0.60 |
| B-04-00 | July 09 | 01:59:28 | 2.202 | 2.07 | 0.23 | 1.09 | 0.64 |
| B-04-05 | July 10 | 05:52:16 | 2.738 | 2.33 | 0.29 | 0.71 | 1.23 |
| B-04-08 | July 11 | 01:41:36 | 2.434 | 2.09 | 0.24 | 0.75 | 1.01 |
| C-01-02 | July 16 | 00:51:28 | 4.341 | 3.65 | 0.46 | 0.52 | 2.59 |
| C-01-01 | July 16 | 02:30:40 | 3.998 | 3.25 | 0.50 | 1.52 | 1.07 |
| C-01-00 | July 16 | 08:10:56 | 4.533 | 3.70 | 0.63 | 2.28 | 0.61 |
| C-01-03 | July 16 | 11:20:48 | 4.194 | 3.07 | 0.53 | 1.42 | 0.95 |
| C-01-04 | July 16 | 18:03:28 | 4.874 | 3.90 | 0.68 | 1.47 | 1.55 |
| C-01-05 | July 16 | 21:21:20 | 4.705 | 3.72 | 0.62 | 1.38 | 1.55 |
| C-01-06 | July 16 | 23:02:40 | 4.895 | 3.89 | 0.67 | 1.04 | 1.99 |
| B: Best fit Spectral parameters2 | |||||||
| ObsId1 | NH | kTin | kTe | Rin 3 | (dof) | ||
| (1022 cm-2) | (keV) | (keV) | (km) | ||||
| A-65-00 | 1.65 | 1.06 | 7.95 | 6.38 | 2.17 | 34.79 | 1.98(87) |
| A-66-00 | 13.69 | 0.53 | 7.97 | 6.88 | 2.27 | 558.98 | 0.97(87) |
| A-66-01 | 14.22 | 0.54 | 7.32 | 7.26 | 2.17 | 567.59 | 0.98(81) |
| B-04-00 | 14.53 | 0.52 | 9.77 | 6.01 | 2.35 | 721.83 | 1.40(87) |
| B-04-05 | 14.73 | 0.52 | 6.73 | 8.08 | 2.52 | 453.99 | 0.93(87) |
| B-04-08 | 13.10 | 0.54 | 7.02 | 7.83 | 2.46 | 575.62 | 0.98(87) |
| C-01-02 | 14.46 | 0.53 | 7.88 | 8.09 | 2.83 | 914.69 | 1.04(87) |
| C-01-01 | 13.47 | 0.56 | 8.85 | 5.31 | 2.52 | 728.57 | 1.23(87) |
| C-01-00 | 14.46 | 0.56 | 10.86 | 4.15 | 2.31 | 847.52 | 0.99(87) |
| C-01-03 | 13.90 | 0.57 | 9.21 | 5.16 | 2.53 | 724.04 | 1.16(87) |
| C-01-04 | 14.41 | 0.57 | 8.35 | 5.18 | 2.58 | 830.45 | 0.93(87) |
| C-01-05 | 12.97 | 0.59 | 8.23 | 5.39 | 2.56 | 605.30 | 0.68(87) |
| C-01-06 | 14.39 | 0.56 | 7.12 | 6.29 | 2.71 | 835.85 | 1.02(87) |
| 1: A = 50703-01, B = 60405-01, C = 60702-01 | |||||||
| 2: Model consists of a disk-blackbody, CompTT and power-law (see text) | |||||||
| 3: derived assuming distance kpc and inclination angle, | |||||||
| Radio flare properties | Pre-flare “plateau” properties | ||||||||
| MJD | Date | Peak flux | Decay Time | Integrateda | Duration | Ave. GBI | Ave. ASM | ASM | No. of |
| (mJy) | (day) | flux (Jy.day) | (day) | flux (mJy) | count s-1 | Variability (%) | PCA Obs. | ||
| 50751 | 1997 Oct 31 | 550 | 3.16 | 1.65c | 19 | 50.3 | 35.9 | 5.44 | 5 |
| 50916 | 1998 Apr 13 | 920 | 3.01 | 2.34 | 6 | 90.1 | 48.2 | 2.70 | 4 |
| 50933 | 1998 Apr 30 | 580 | 3.82 | 2.14 | 6 | 91.4 | 44.9 | 3.31 | 2 |
| 50967 | 1998 Jun 03 | 710 | 2.13 | 1.37 | 12 | 54.4 | 36.5 | 5.10 | 12 |
| 51004 | 1998 Jul 10 | 480 | No FRED | – | 7 | 112.7 | 43.6 | 18.82 | – |
| 51337 | 1999 Jun 08 | 490 | 2.68 | 1.46c | 5 | 43.3 | 35.2 | 6.05 | 7 |
| 51499 | 1999 Nov 17 | 510 | No FRED | – | 8 | 82.8 | 69.2 | 16.60 | – |
| 51535 | 1999 Dec 23 | 510 | 3.86b | 1.67 | 10 | 52.3 | 38.9 | 3.96 | 7 |
| 51577 | 2000 Feb 03 | 420 | No FRED | – | 12 | 69.8 | 30.0 | 11.50 | 4 |
| a: Integrated flux is obtained by fitting an exponential function to the flare profile and integrating the function | |||||||||
| over duration of 3decay constant. Typical errors are 0.01, unless stated | |||||||||
| b: This is uncertain because of large data gaps in the GBI monitoring data | |||||||||
| c: Typical errors are 0.2 due to uncertain start time. | |||||||||
| A: Observation log, QPO frequency and the observed fluxes | |||||||
| ObsId1 | Date | Start | 3 – 150 keV flux (in 10-8 ergs s-1) | ||||
| Time (UT) | (Hz) | Ftotal | Fdbb | Fctt | Fpow | ||
| P-51-00 | 1997 Oct 22 | 07:04:48 | 1.401 | 2.012 | 0.175 | 0.437 | 1.301 |
| P-52-000 | 1997 Oct 25 | 06:30:40 | 1.882 | 2.042 | 0.245 | 0.412 | 1.258 |
| Q-09-01 | 1998 Apr 10 | 00:02:24 | 2.175 | 2.439 | 0.313 | 0.826 | 1.134 |
| Q-10-00 | 1998 Apr 11 | 09:28:32 | 1.739 | 2.423 | 0.291 | 0.729 | 1.247 |
| R-15-00 | 1998 Apr 22 | 21:16:00 | 1.458 | 2.443 | 0.265 | 1.029 | 0.999 |
| R-16-00 | 1998 Apr 28 | 16:16:48 | 1.399 | 2.335 | 0.288 | 1.044 | 0.828 |
| R-20-00 | 1998 May 24 | 19:27:28 | 0.692 | 2.131 | 0.165 | 0.876 | 0.993 |
| R-21-00 | 1998 May 31 | 19:25:20 | 1.763 | 2.144 | 0.252 | 0.846 | 0.912 |
| S-16-02 | 1999 Jun 03 | 03:02:24 | 1.759 | 1.978 | 0.229 | 0.727 | 0.919 |
| S-17-01 | 1999 Jun 07 | 02:52:32 | 2.874 | 2.295 | 0.313 | 0.664 | 1.182 |
| S-42-00 | 1999 Dec 13 | 11:56:32 | 1.435 | 2.137 | 0.245 | 0.680 | 1.065 |
| S-43-00 | 1999 Dec 21 | 11:32:16 | 2.121 | 2.231 | 0.253 | 0.710 | 1.158 |
| B: Best fit Spectral parameters2 | |||||||
| ObsId1 | NH | kTin | kTe | Rin 3 | (dof) | ||
| (1022 cm-2) | (keV) | (keV) | (km) | ||||
| P-51-00 | 13.27 | 0.48 | 4.33 | 11.90 | 2.75 | 787.22 | 1.34(94) |
| P-52-000 | 14.68 | 0.48 | 4.13 | 11.49 | 2.76 | 1000.98 | 1.07(94) |
| Q-09-01 | 12.39 | 0.51 | 3.92 | 9.00 | 2.79 | 755.98 | 1.05(94) |
| Q-10-00 | 14.95 | 0.46 | 4.04 | 9.65 | 2.97 | 1392.43 | 0.83(94) |
| R-15-00 | 11.12 | 0.52 | 4.20 | 9.07 | 2.72 | 607.12 | 1.25(94) |
| R-16-00 | 13.55 | 0.50 | 4.18 | 8.75 | 2.50 | 831.36 | 1.43(94) |
| R-20-00 | 14.23 | 0.50 | 5.20 | 8.66 | 2.61 | 691.93 | 1.07(94) |
| R-21-00 | 12.99 | 0.51 | 4.96 | 8.46 | 2.69 | 741.65 | 0.93(94) |
| S-16-02 | 12.43 | 0.51 | 5.98 | 7.68 | 2.52 | 660.93 | 1.16(88) |
| S-17-01 | 13.12 | 0.50 | 5.58 | 7.90 | 2.75 | 895.49 | 0.93(87) |
| S-42-00 | 12.94 | 0.51 | 4.29 | 10.93 | 2.69 | 710.50 | 1.00(88) |
| S-43-00 | 13.61 | 0.48 | 5.25 | 8.29 | 2.82 | 981.34 | 0.81(88) |
| 1: P = 20402-01, Q = 30402-01, R = 30703-01, S = 40703-01 | |||||||
| 2: Model consists of a disk-blackbody, CompTT and power-law (see text) | |||||||
| 3: derived assuming distance kpc and inclination angle, | |||||||