Kinematical structure of the circumstellar environments of galactic B[e]-type stars ††thanks: Based on observations collected at the European Southern Observatory, Chile, and at the German-Spanish Astronomical Centre, Calar Alto, operated by the Max-Planck-Institut für Astronomie, Heidelberg, jointly with the Spanish National Commission for Astronomy.
High resolution line profiles are presented for selected forbidden and permitted emission lines of a sample of galactic B[e]-type stars. The spectral resolution corresponds to 5-7 km s-1 with the exception of some line profiles which were observed with a resolution of 9-13 km s-1. All H profiles are characterized by a narrow split or single emission component with a width of km s-1 (FWHM) and broad wings with a full width of km s-1. The H profiles can be classified into three groups: double-peaked profiles representing the majority, single-peaked emission-line profiles, and normal P Cygni-type profiles. Likewise, the forbidden lines exhibit in most cases double-peaked profiles. In particular, the majority of stars shows split [O i]6300Å. Double-peaked profiles are also found in several stars for [N ii]6583Å and [Fe ii]7155Å although these lines in many stars exhibit single-peaked emission profiles. The split forbidden line profiles have peak separations of as little as km s-1, and were therefore only discernible for the first time in the high-resolution spectra. The ratio of violet to red emission peak intensities, , is predominantly smaller or equal to 1. Theoretical profiles were calculated for the optically thin case. A latitude-dependent stellar wind with a radial expansion and a velocity decreasing from the pole to the equator was adopted. This configuration can produce split line profiles if viewed under some angle with respect to the line of sight. In addition an equatorial dust ring with various optical depths was assumed. It can explain line asymmetries observed in some stars. Moreover, the ratios can be understood in terms of this model. The comparison of the observed line profiles with the models thus confirms the assumption of disk-like line-formation regions as commonly adopted for B[e]-type stars.
Key Words.:
Stars: circumstellar matter – Stars: early-type – Stars: emission-line, Be – Stars: mass-loss1 Introduction
The class of B[e]-type stars is characterized by the B[e] phenomenon (Lamers et al. Lamersetal98 (1998)). This term summarizes the presence of strong Balmer emission lines, narrow permitted and forbidden low-excitation emission lines of Fe ii, [Fe ii] and [O i], and in particular a strong near to mid-IR excess. It is attributed to hot circumstellar dust ( K) and is a distinguishing characteristic with respect to other classes of peculiar emission-line stars. The presence of dust requires regions of high density and a temperature low enough to allow dust condensation. A recent review of the properties of this still enigmatic class of emission-line stars was given by Zickgraf (Zickgraf98 (1998)) during the first workshop dedicated entirely to this type of stars (Hubert & Jaschek HubertJaschek98 (1998)). It was shown that although B[e]-type stars share the mentioned properties, indicating very similar physical conditions in their circumstellar environments with regard to temperature, density, and velocity, they form by no means a homogeneous group. Rather, they comprise a variety of object classes with vastly differing evolutionary stages of low, medium and high mass stars. To account for the diversity of intrinsic classes Lamers et al. (Lamersetal98 (1998)) suggested a new classification scheme for B[e]-type stars including B[e] supergiants (sgB[e]), Herbig-type B[e] stars (HAeB[e]), compact planetary nebulae (cPNB[e]), and certain symbiotic objects (symB[e]). A large number of B[e] stars are, however, not yet classified. Lamers et al. summarized them in the group of unclassified B[e]-type stars (unclB[e]). The relation of B[e] stars to classical Be stars, often a matter of confusion, was discussed recently by Zickgraf (Zickgraf00 (2000)).
The common property of B[e]-type stars of all sub-types seems to be the presence of non-spherical circumstellar environments. Polarimetry and spectropolarimetry of galactic as well as of Magellanic Cloud B[e] stars clearly demonstrated that independent of the B[e] subgroup the scattering particles in the circumstellar envelopes are distributed non-spherically (e.g. Barbier & Swings BarbierSwings82 (1982), Zickgraf & Schulte-Ladbeck ZS89 (1989), Magalhaes Magalhaes92 (1992), Schulte-Ladbeck et al. SchulteLadbecketal94 (1994), Oudmaijer et al. Oudmaijeretal98 (1998), Oudmaijer & Drew OudmaijerDrew99 (1999)). The most likely configuration is disk-like as suggested e.g. by Zickgraf et al. (Zickgrafetal85 (1985), Zickgrafetal86 (1986),Zickgrafetal89 (1989)) based on spectroscopic observations in the optical wavelength region and in the satellite UV of B[e] supergiants in the Magellanic Clouds (MCs). These observations strongly suggested that the stellar winds can be described by a two-component model. In this picture a cool and dense equatorial wind emerging from a single star is responsible for the formation of the narrow low-excitation emission lines. It is also supposed to be the site of dust formation. The polar region is dominated by a hot and fast expanding OB star wind with the high wind velocities observed normally for stars of this type. A similar model had been proposed earlier by Swings (1973a ) for the galactic B[e]-type star HD 45677 also based on spectroscopic observations. In contrast to the post-main sequence MC sgB[e]s it seems to be a (near) main-sequence object. Likewise, the pre-main sequence Herbig Ae/Be stars are supposed to possess circumstellar disks.
Disk-like circumstellar environments could also be caused by binarity. Apart from objects belonging to the subclass of symB[e] several B[e] stars have in fact been shown to be components of a binary system. In the SMC two B[e] supergiants, Hen S18 and R 4, were found to possess lower mass companions (Zickgraf et al. Zickgrafetal89 (1989), Zickgrafetal96 (1996)). Likewise, in the Milky Way a couple of B[e] stars were found to be binaries, e.g. MWC 623 (Zickgraf & Stahl ZickgrafStahl89 (1989)), AS 381 (Miroshnichenko et al. 2002a ), and CI Cam (= MWC 84). Further instances are possibly MWC 349A (Hofmann et al. Hofmannetal02 (2002)) and MWC 342 (Miroshnichenko & Corporon MP99 (1999)). It is, however, not clear whether in these objects the B[e] phenomenon itself is actually caused by their binary nature. For some objects this seems not to be the case. In Hen S18, R 4, and MWC 623 the B[e] phenomenon can be ascribed to the B star component in the binary systems. These B[e] stars behave like single stars (Zickgraf et al. Zickgrafetal89 (1989), Zickgrafetal96 (1996), Zickgraf Zickgraf01 (2001)). AS 381 on the other hand shows signs of mass transfer suggesting that interaction could play a role in the occurence of the B[e] phenomenon in this object (Miroshnichenko et al. 2002a ). At this time the role of binarity is thus controversial.
Spectroscopic studies showed that the low-excitation lines attributed to the disks are narrow and thus indicative for low wind velocities in the line forming region. Typically, line widths (FWHM) of the order of less than 100 km s-1 to 300 km s-1 are observed (e.g. Swings & Andrillat SwingsAndrillat81 (1981), Zickgraf et al. Zickgrafetal86 (1986)). Given the early spectral types of the underlying stars such small wind velocities are unusual.
In the case of stars viewed edge-on the direct investigation of the velocity structure of the disk winds is possible by studying absorption lines formed in the disk. This method was used by Zickgraf et al. (Zickgrafetal96 (1996)) to study three B[e] supergiants in the MCs using satellite UV spectroscopy. The observations of UV resonance lines showed that the disk winds are in fact very slow, at least in the case of massive supergiants. The expansion velocities measured were of the order of 70-100 km s-1, i.e. typically a factor of 10 less than usually observed for stars of similar spectral type. This may also hold for members of other B[e] star classes.
For viewing angles deviating from edge-on one can make use of the low-excitation emission lines to study the kinematics of the disk winds. Of particular interest are lines from forbidden transitions because they are optically thin. Therefore radiation transfer does not complicate the interpretation of the line intensities and profiles. Furthermore, the forbidden lines should form at a large distance from the central star. Hence, in the case of a radially accelerated outflow (as e.g. the usually adopted -type velocity law) the radial velocity component in the line forming region should have reached the terminal wind speed. Because of the small velocities involved the investigation of the emission-line profiles requires high spectral resolution. If one aims at a resolution of about 1/10 of the terminal velocity a spectral resolution of about km s-1 is necessary for the wind velocities measured e.g. by Zickgraf et al. (Zickgrafetal96 (1996)) for B[e] supergiants.
In order to study the disk winds using emission-line profiles a sample of galactic B[e]-type stars listed in Table 1 was observed with high spectral resolution. In Sect. 2 the observations are described. The observed line profiles are described in Sect. 3. The density conditions in the line formation region of the forbidden lines are discussed in Sect. 4. The role of rotation and expansion is investigated in Sect. 5. In Sect. 6 model calculations of optically thin line profiles are presented and compared with the observed lines. Finally, conclusions are given in Sect. 7. The Appendix contains the observational data in Sects. A and B, and remarks on individual stars in Sect. C. An atlas of the high-resolution spectra is presented in Sect. D111Figs. 17 to 24 are available only electronically..
| star | spec. class. | references |
|---|---|---|
| MWC 17 | unclB[e] | L98 |
| (symB[e], cPNB[e]?) | (L98, Lei77) | |
| MWC 84 (CI Cam) | sgB[e], X-ray binary | C99 |
| (unclB[e]) | (L98) | |
| MWC 137 | HAEB[e] | Thé94 |
| MWC 297 | HAEB[e], B1.5Ve | Drew97 |
| MWC 300 | sgB[e] | WS85 |
| MWC 342 | unclB[e] | L98 |
| MWC 349A | uncl B[e] | L98 |
| MWC 645 | unclB[e] | L98 |
| MWC 939 | unclB[e] | L98 |
| MWC 1055 | unclB[e] | |
| HD 45677 | HAEB[e], B2V[e] | Sw73, Isr96, L98 |
| HD 87643 | sgB[e] | McG88 |
| Hen 230 | unclB[e] | |
| Hen 485 | unclB[e] | |
| Hen 1191 | cPNB[e] | LeB89 |
| CD$-24°5721$ | unclB[e] | |
| CPD$-57°2874$ | sgB[e] | McG88 |
| CPD$-52°9243$ | sgB[e] | Sw81, WW89 |
2 Observations and data reduction
| date | wavel. range | spectral res. | instrument |
| [Å] | |||
| Dec. 7, 1986 | 4545 - 4581 | 55 000 | CES |
| Dec. 8, 1986 | 6541 - 6598 | ” | CES |
| Dec. 9, 1986 | 5862 - 5913 | ” | CES |
| 6275 - 6325 | ” | CES | |
| Dec. 10, 1986 | 4273 - 4307 | ” | CES |
| Sep. 9, 1987 | 6535 - 6600 | 23 000 | CA coudé |
| Sep. 10, 1987 | 6650 - 6720 | ” | CA coudé |
| Sep. 11, 1987 | 6280 - 6350 | ” | CA coudé |
| Sep. 11, 1987 | 6574 - 6605 | 45 000 | CA coudé |
| Sep. 12, 1987 | 6290 - 6325 | ” | CA coudé |
| Sep. 13, 1987 | 5868 - 5903 | ” | CA coudé |
| Sep. 14, 1987 | 7147 - 7182 | ” | CA coudé |
| Mar. 27, 1988 | 6275 - 6325 | 55 000 | CES |
| Mar. 28, 1988 | 7134 - 7178 | ” | CES |
| Mar. 29, 1988 | 6543 - 6600 | ” | CES |
| Mar. 30, 1988 | 6538 - 6595 | ” | CES |
| 6431 - 6484 | ” | CES | |
| Mar. 31, 1988 | 6538 - 6595 | ” | CES |
| 5861 - 5912 | ” | CES | |
| 6275 - 6325 | ” | CES | |
| 7134 - 7178 | ” | CES | |
| Jun. 19, 2000 | 3950 - 7550 | 34 000 | FOCES |
| Feb. 19&22, 2002 | 3950 - 7550 | 34 000 | FOCES |
| star | H +[N ii] | [O i] | [Fe ii] | [Fe ii] | Fe ii | Fe ii | He i+Na i D |
|---|---|---|---|---|---|---|---|
| 6300Å | 7155Å | 4287Å | 6456Å | 4549/56Å | 5876Å | ||
| MWC 939 | |||||||
| Hen 230 | |||||||
| Hen 485 | |||||||
| Hen 1191 | |||||||
| CD5721 | |||||||
| CPD9243 | |||||||
| HD 45677 | |||||||
| HD 87643 | |||||||
| CPD2874 |
| star | H +[N ii] | [N ii] | [O i] | [Fe ii] | He i+Na i D | He i |
|---|---|---|---|---|---|---|
| 6583Å | 6300Å | 7155Å | 5876Å& 6678Å | |||
| MWC 17 | m | h | h | h | h | m |
| MWC 84 | m | h | m | h | h | m |
| MWC 137 | m | F | h | F | h | m |
| MWC 297 | m | h | h | |||
| MWC 300 | m | h | h | h | h | |
| MWC 342 | m | F | h | h | h | |
| MWC 349A | m | h | h | h | h | |
| MWC 645 | m | h | h | m | ||
| MWC 939 | m | h | h | F | F | |
| MWC 1055 | m | F | h | F | F | m |
The spectroscopic observations were carried out in 1986 and 1988 with the Coudé Echelle Spectrometer (CES) at the 1.4 m CAT at ESO, La Silla, and in 1987 with the coudé spectrograph at the 2.2 m telescope at the Centro Astronomico Hispano Aleman (CAHA) on Calar Alto, Spain. For a few stars with incomplete coudé data the observations were supplemented by echelle spectra obtained with FOCES at Calar Alto Observatory in June 2000 and February 2002. The journal of observations is given in Table LABEL:journal.
Due to the small spectral coverage of about Å provided by the coudé spectrographs strong emission lines characteristic for B[e]-type stars were selected and the observed wavelength ranges adjusted around these lines. In Tabs. 3 and 4 the observed lines are listed for each studied object. During the 1987 observing run on Calar Alto the northern B[e]-type star MWC 623 was included in the sample. The results on this star have been presented already by Zickgraf & Stahl (ZickgrafStahl89 (1989)) and Zickgraf (Zickgraf01 (2001)) and are therefore omitted here.
The CES spectra were collected during two campaigns in November 1986 and March 1988. The short camera of the spectrograph was equipped with a RCA CCD (ESO CCD #8, 6401024 pixels, 15 m pixel size). For details on the instrumentation see Dekker et al. (Dekker86 (1986)). The resulting (measured) spectral resolution was , corresponding to a velocity resolution of km s-1.
The coudé observations on Calar Alto were obtained with the camera of the coudé spectrograph equipped with a RCA CCD chip (1024640 pixels, 15 m pixel size). Most spectra were observed with a linear dispersion of 2.2 Å mm-1. A few were obtained with 4.5 Å mm-1. The lower dispersion was used during nights with reduced meteorological quality mainly for the observation of H. With a slit width of 0.5″ on the sky the projected slit on the chip had a width of 4 pixels. In order to improved the S/N ratio two pixels could therefore be binned in the direction of the dispersion without loss of resolution. The resulting measured spectral resolution for the two linear dispersions used was about 45 000 and 23 000, respectively, corresponding to a velocity resolution of 7 km s-1 and 13 km s-1, respectively. Another two pixels were binned perpendicular to the direction of dispersion in order to increase the ratio.
Supplementary observations were obtained with the echelle spectrograph FOCES (cf. Pfeiffer et al. Pfeifferetal98 (1998)) at the 2.2 m telescope of Calar Alto Observatory in June 2000, and in February 2002. The spectrograph was coupled to the telescope with the red fibre. The detector was a 10241024 pixel Tektronix CCD chip with 24 m pixel size. With a diaphragm diameter of 200 m and an entrance slit width of 180 m a spectral resolution of 34 000 was achieved, i.e. 9 km s-1. A full discussion of the FOCES spectra will be given elsewhere (Zickgraf 2003, in preparation). Here only the lines observed also with the coudé spectrographs will be considered.
During all observing campaigns wavelength calibration was obtained with Th-Ar lamps. For flat fielding built-in lamps were used. The coudé spectra were reduced by application of standard procedures (bias subtraction, flat-fielding, wavelength calibration, normalization) of the ESO-MIDAS image processing software package, context longslit. For the FOCES data the ESO-MIDAS context echelle was used. All spectra were finally rebinned to heliocentric wavelengths.
The spectra in the red spectral region are strongly affected by narrow telluric absorption features. To correct for these lines, the normalized spectra were divided by the normalized spectrum of a hot comparison star with a line free continuum or with possible photospheric lines removed during the normalization procedure. For the H lines the correction spectrum was created from the object spectra themselves. First each spectrum was smoothed. Then the original spectrum was divided by the smoothed spectrum. The final correction spectrum was then created by averaging several of these individual spectra observed during the same night as the spectrum to be corrected.
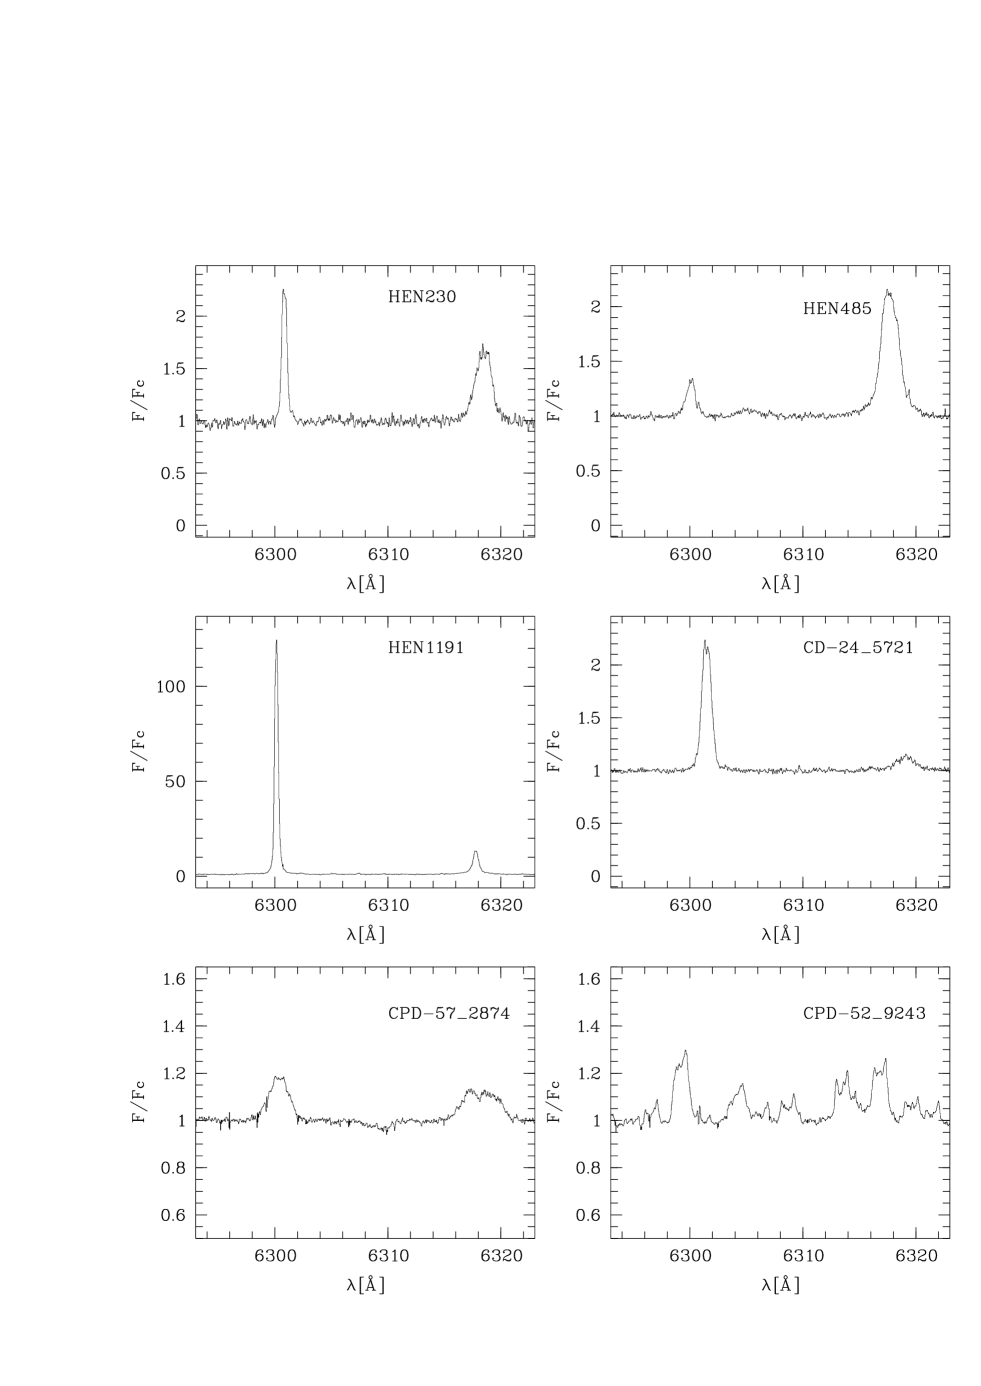
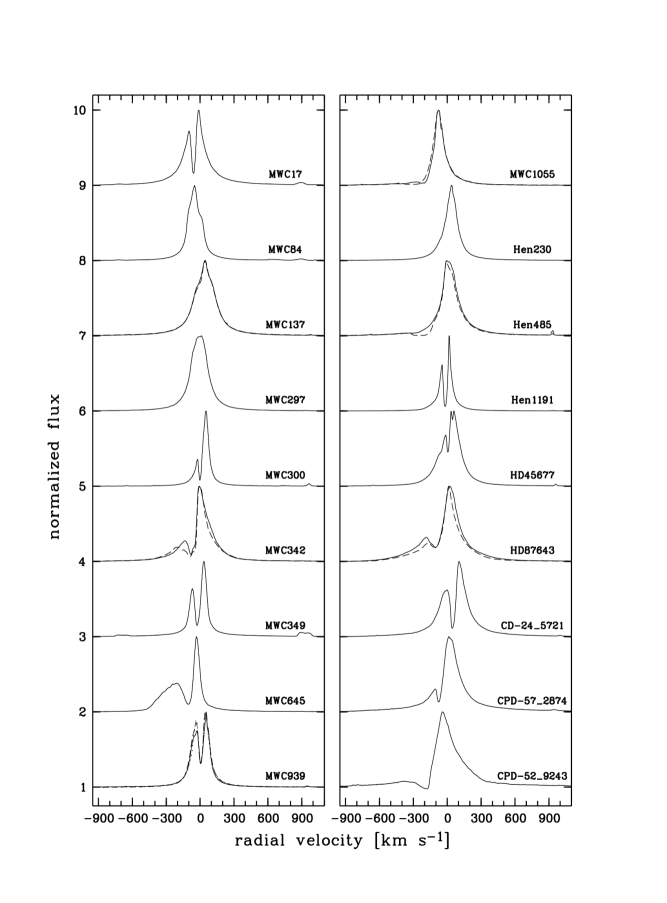
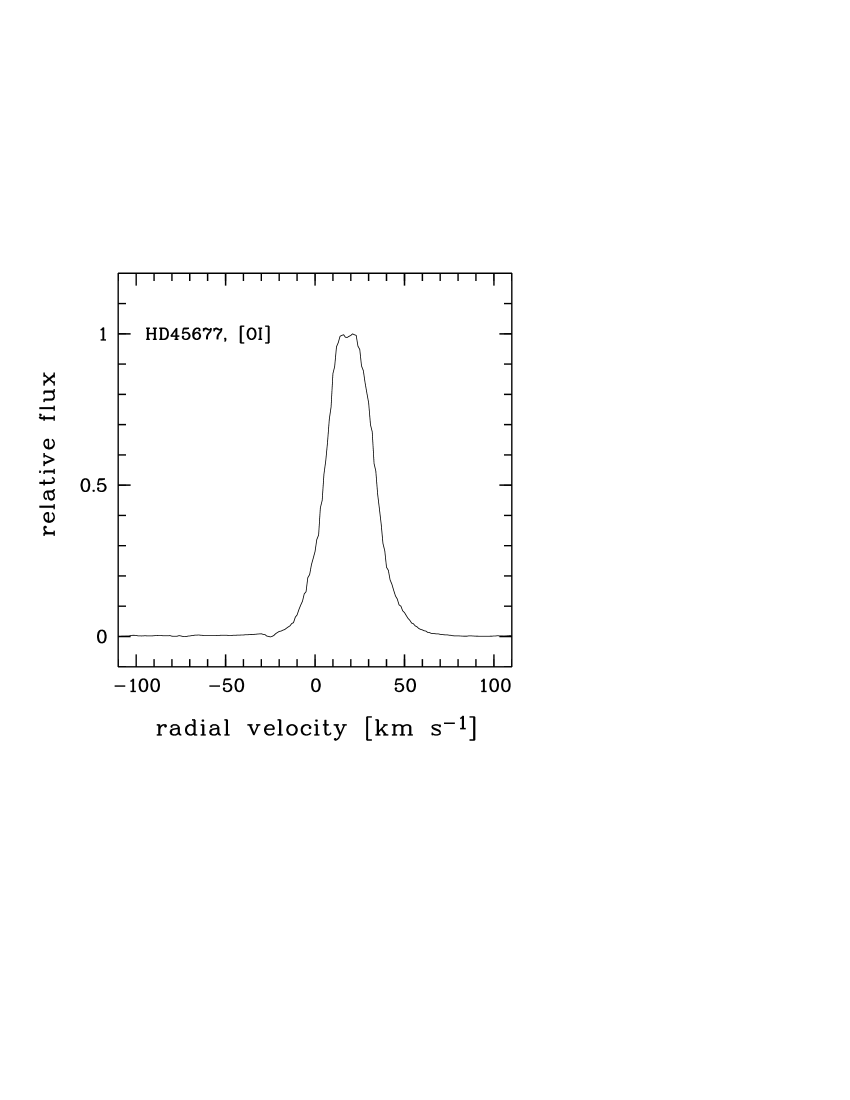
The observed spectral sections are displayed in the Appendix in Figs. 17 to 24 together with remarks on the individual objects in Sect. C. For H see Fig. 1.
3 Observed line profiles
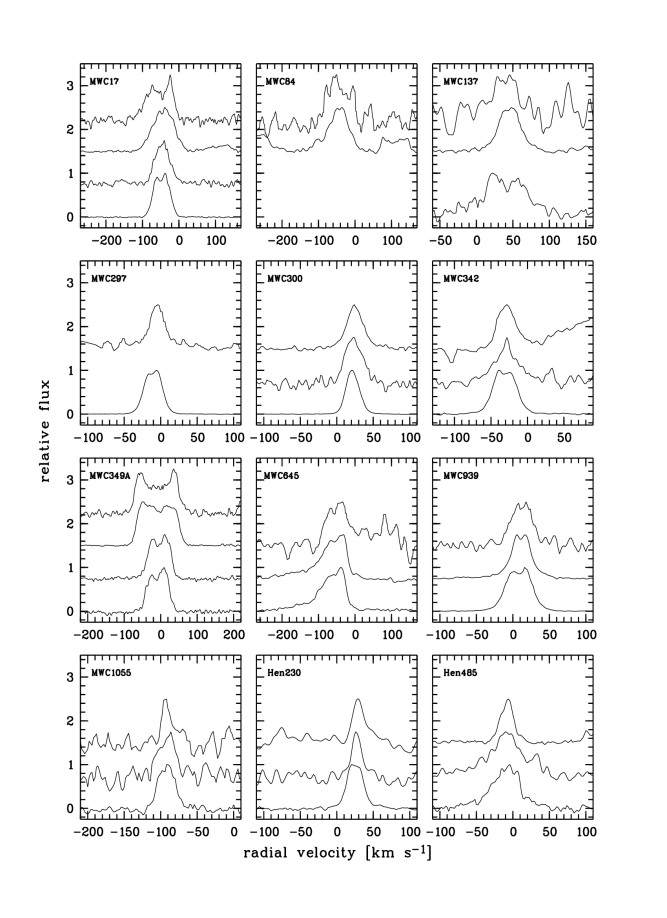
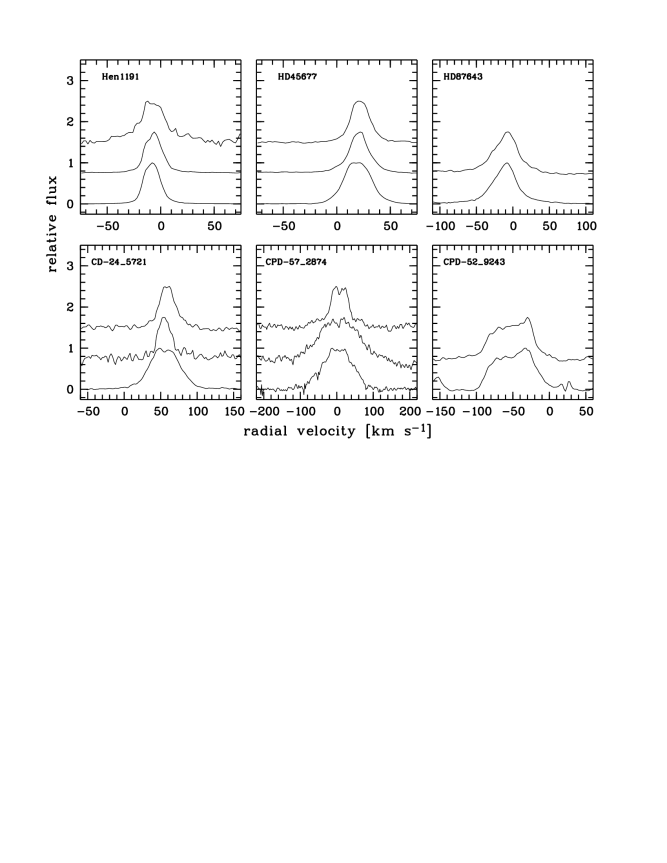
In the following the observed characteristics of the line profiles are summarized. Table 7 in the Appendix lists relevant line parameters. Measurements of heliocentric radial velocities are also listed in the Appendix in Table 8. The profiles of H , of He i emission lines, and of the forbidden lines rebinned on a velocity scale are displayed in Figs. 1 3 and 2a, b.
The line profiles can be categorized into four groups:
-
–
group 1: normal P Cygni-type line profiles with an absorption component reaching below the continuum on the violet side of the profile and an emission component on the red side,
-
–
group 2: single-peaked pure emission lines without absorption components,
-
–
group 3: double-peaked emission lines with a central or almost central absorption component, or at least an intensity dip on one of the line flanks,
-
–
group 4: absorption lines.
These profile groups correspond to Beals types I, V, III, and VII-VIII, respectively, defined by Beals (Beals55 (1955)). The profile types of the observed lines are summarized in Table 5.
3.1 H profiles
| star | H | [O i] | [Fe ii] | [N ii] | [S iii] | Fe ii | He i | Na i D |
| MWC 17 | 2 | – | abs | |||||
| MWC 84 | 2 | ? | ? | 2: | – | 2 | em | |
| MWC 137 | 2 | ?f | ? | – | 4c, 2f | abs | ||
| MWC 297 | 2 | – | 2e | 0 | – | 2 | abs | |
| MWC 300 | 2 | 2 | 2 | 0 | – | 1 | em | |
| MWC 342 | 2 | 2f | 0 | – | 2d | em | ||
| MWC 349A | – | em | ||||||
| MWC 645 | 2:e | 0 | – | – | – | |||
| MWC 939 | 0 | 4f | emf | |||||
| MWC 1055 | 1: | 2f | 2f | 0 | 2f | 4f | emf | |
| Hen 230 | 2 | 2 | 2 | 2 | 0 | 2 | – | – |
| Hen 485 | 1:-2 | 2 | 2 | 2 | 0 | 2: | 2 | em |
| Hen 1191 | 2 | 2 | 0 | 2 | – | – | ||
| HD 45677 | 2 | 2 | 0 | – | – | |||
| HD 87643 | 2 | 2 | 0 | 0 | 2 | 4 | em | |
| CD5721 | 2 | 0 | 4 | 4 | em: | |||
| CPD2874 | 3: | 0 | 1: | em | ||||
| CPD9243 | 1 | 0 | 0 | 1 | 4 | em | ||
| : Fe ii6586 | : He i6678 in emission | |||||||
| : He i6678 possible blue shifted absorption component | ||||||||
| : observed with | : observed with FOCES | |||||||
A general characteristic of all H profiles displayed in Fig. 1 is that they exhibit a narrow single or split emission component with a full width at half maximum (FWHM) of about 3-5 Å, i.e. km s-1, and broad wings on both sides of the emission component extending up to typically Å, i.e. km s-1. These wings are generally ascribed to electron scattering (e.g. Zickgraf et al. Zickgrafetal86 (1986)).
Only one star, CPD$-52°$9243, shows a P Cygni profile which resembles the “normal” (group 1) profile type. Hen 485 in 1988 and MWC 1055 may also be classed with group 1, although the absorption components do not reach below the continuum level.
The H profiles of four stars, MWC 84, MWC 137, MWC 297, and Hen 230, fall into group 2, which exhibits pure emission line profiles. The FWHM is of the order of 3-5 Å. Note, however, that the lines are not symmetric. The asymmetry is particularly pronounced in the case of MWC 84.
Most of the investigated stars belong to group 3 exhibiting double-peaked H emission lines. In all of the eleven cases of this group the blue emission peak is weaker than the red peak. In no case the central absorption components reaches below the continuum level. For the peculiar line profiles of HD 45677 and MWC 645 see Sect. C.
For several stars H was observed more than once. The profiles are plotted in Fig. 1: MWC 137 in 1987 (solid line) and in 2002 (dashed line); MWC 342 in 1987 (solid line) and in 2000 (dashed line); MWC 939 in 1987 (solid line) and 1988 (dashed line), the profile observed in 2000 is indistinguishable that of 1988; MWC1055 in 1987 (solid line) and 2000 (dashed line); HD 87643 in 1986 (solid line) and 1988 (dashed line); Hen 485 in 1986 (solid line) and 1988 (dashed line). For MWC 137 the profiles of 1987 and 2002 are nearly indistinguishable.
3.2 Metal lines
3.2.1 [O i] lines
The spectral section with the [O i]6300Å line is displayed in Fig. 17. It also contains the line [S iii]6312Å (s. Sect. 3.2.4) and a line of neutral magnesium, Mg i6318Å. This line is present in all objects.
The line strength of [O i]6300Å differs widely from object to object, the two extremes being MWC 84 and Hen 1191. Whereas in MWC 84 the line peak is at a 5% level above the continuum in Hen 1191 the [O i] emission line is extremely strong reaching as much as 140 times the continuum flux.
Thirteen of the 18 objects exhibit double-peaked [O i] profiles. In some cases the line splitting is weak yet detected, as e.g. in HD 45677 (cf. Fig.4) and MWC 297, or at least indicated as in MWC 1055 and CPD9243. In 8 cases the flux of the blue peak is weaker than that of the red peak. In 3 stars the blue peak is stronger, i.e. MWC 137, MWC 342, and CD$-24°$5721. In HD 45677 the two peaks are equally strong. CPD$-57°$2874 exhibits a nearly flat-topped profile which was classified type 3 due to the weak flux increase at the blue and red side of the nearly flat top. The [O i] profile of MWC 645 is strongly asymmetric. The remaining objects have single-peaked profiles. Note that in the [O i] profile of Hen 230 the line top is sloping to the red side.
3.2.2 [N ii] lines
The wavelength region around [N ii]6583Å is displayed in Fig. 18. In two stars, CPD$-52°$9243 and HD 87643, the [N ii] line is absent. The lines visible in the spectra of these stars around 6585 Å are probably due to Fe ii 6586.69Å. Heliocentric radial velocities are km s-1for CPD$-52°$9243 and km s-1 for HD 87643. In MWC 1055 [N ii] is only weakly discernible. The majority of stars, however, exhibits clearly visible, in many cases strong, [N ii]6583Å emission. Eight stars show double-peak profiles. Hen 1191 shows a sloping line top inclined towards the red side similar to the [O i] line of Hen 230, however with a weak peak on the blue edge. Due to this feature the line was classified type 3. Eight stars exhibit single-peaked emission lines. However, in two of these cases, respectively, the profiles were observed with the lower resolution of 23 000 and 34 000. They are labelled “” and ”f” in Table 5. Note that each of these stars shows a double-peaked (type 3) [O i] profile.
3.2.3 [Fe ii]
The spectral section with [Fe ii]7155Å is shown in Fig. 19. Note for that CD$-24°$5721 the forbiddden lines [Fe ii]4287, 4276Å were observed instead of the red line (Fig. 20). In five cases the [Fe ii] profiles are double-peaked similar to [O i]. However, contrary to [O i] the majority of objects, i.e. 10, exhibits single-peaked profiles, 2 of them on a resolution level of 9 km s-1.
3.2.4 [S iii] lines
The [S iii]6312Å lines are displayed in Fig. 17. Only four stars exhibit this higher-excitation emission line, i.e. MWC 17, MWC 84, MWC 137, and MWC 349A. In MWC 137 it is very weak and not much can be said about its profile. The [S iii] line of MWC 84 is also weak. The strongest [S iii] was found in MWC 349A.
3.2.5 Fe ii lines
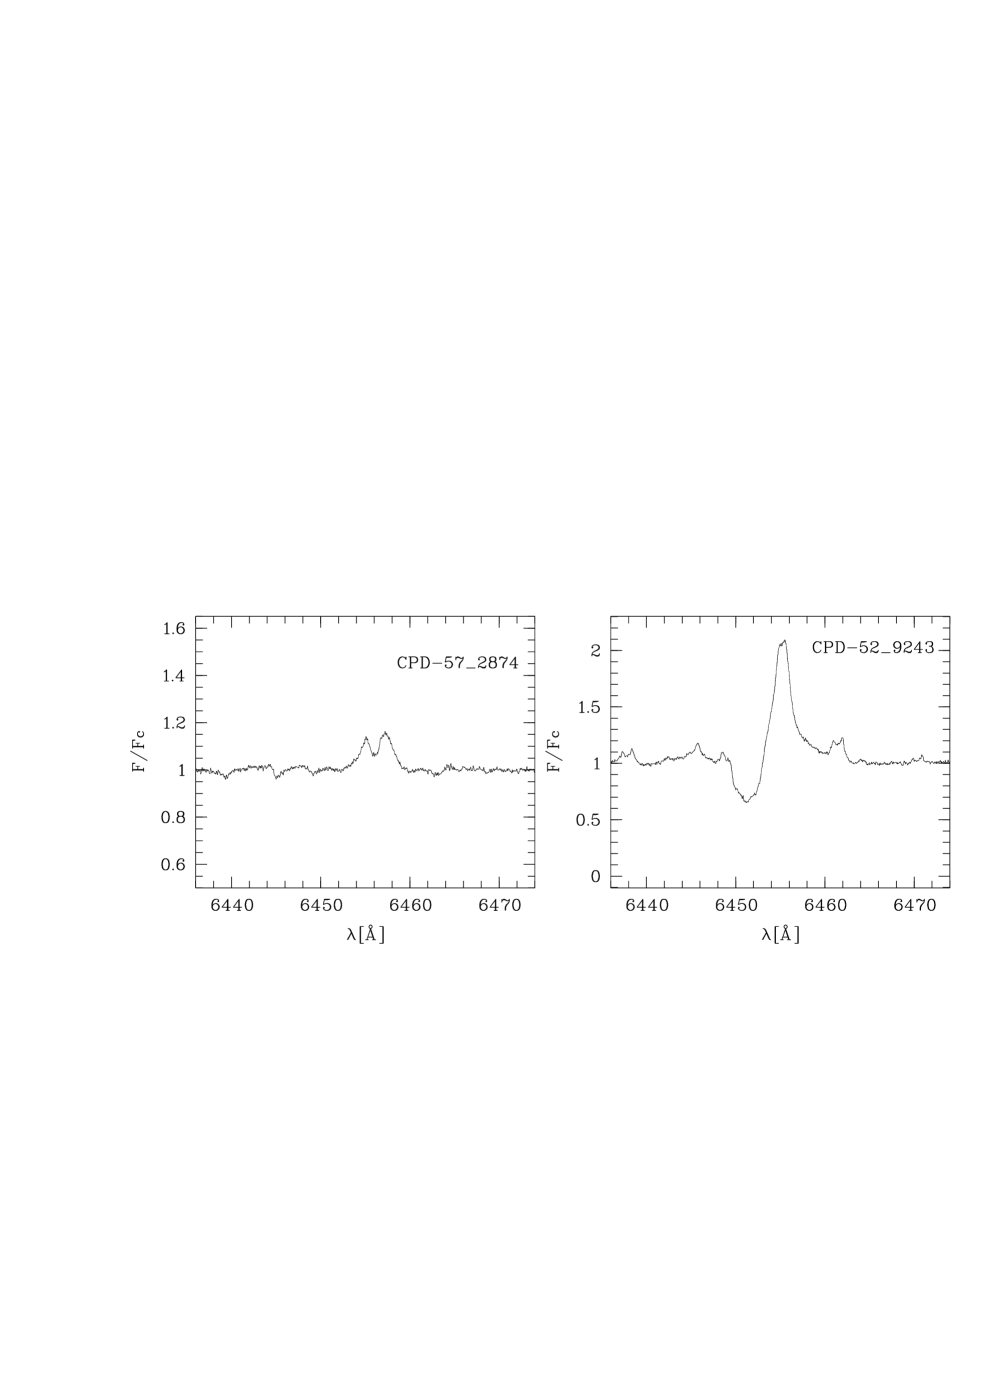
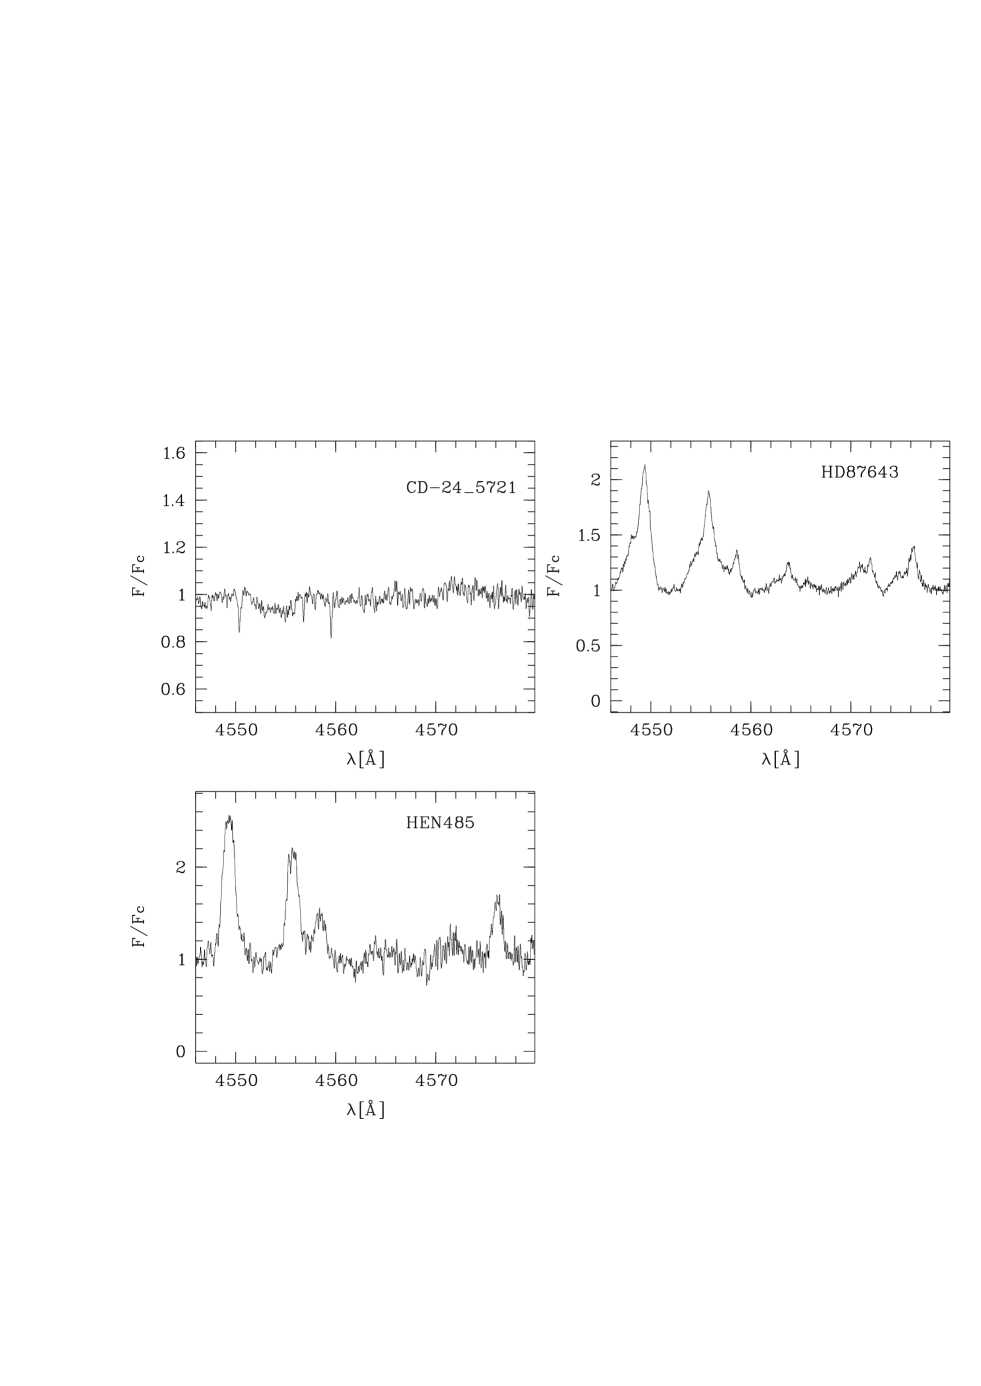
For only half of the sample permitted Fe ii lines were observed, mostly Fe ii6456Å, but also Fe ii lines around 4550Å for a few stars instead. The wavelength region around Fe ii6456Å is displayed in Fig. 21. Three of the observed stars exhibit single-peak emission lines. Four stars show double-peaked profiles. For Hen 485 the double-peak structure is only weakly indicated. CPD is the only star showing a P Cygni profile of group 1. CD is exceptional. This star shows narrow absorption lines (Fig. 22). The lines identified in the observed spectral sections of this star are listed in Table 10.
3.2.6 Na i D lines
The lines of the Na i D doublet are shown in Fig. 23. The spectral section shown in this figure also contains the line of He i5876Å (see below). Most stars clearly show circumstellar Na i emission. Only 4 of the 14 observed stars do not show an emission component of the doublet. In most cases the absorption components are blends of multiple narrow absorption lines which are very likely mainly due to interstellar absorption. This makes it difficult to detect circumstellar absorption features. Because of this problem only the overall appearance of emission or absorption is listed in Table 5. Exceptions are CPD and possibly Hen 485, cf. Sect. C.18 and C.14. Heliocentric radial velocities of the absorption components are listed in Table 9.
3.3 He i lines
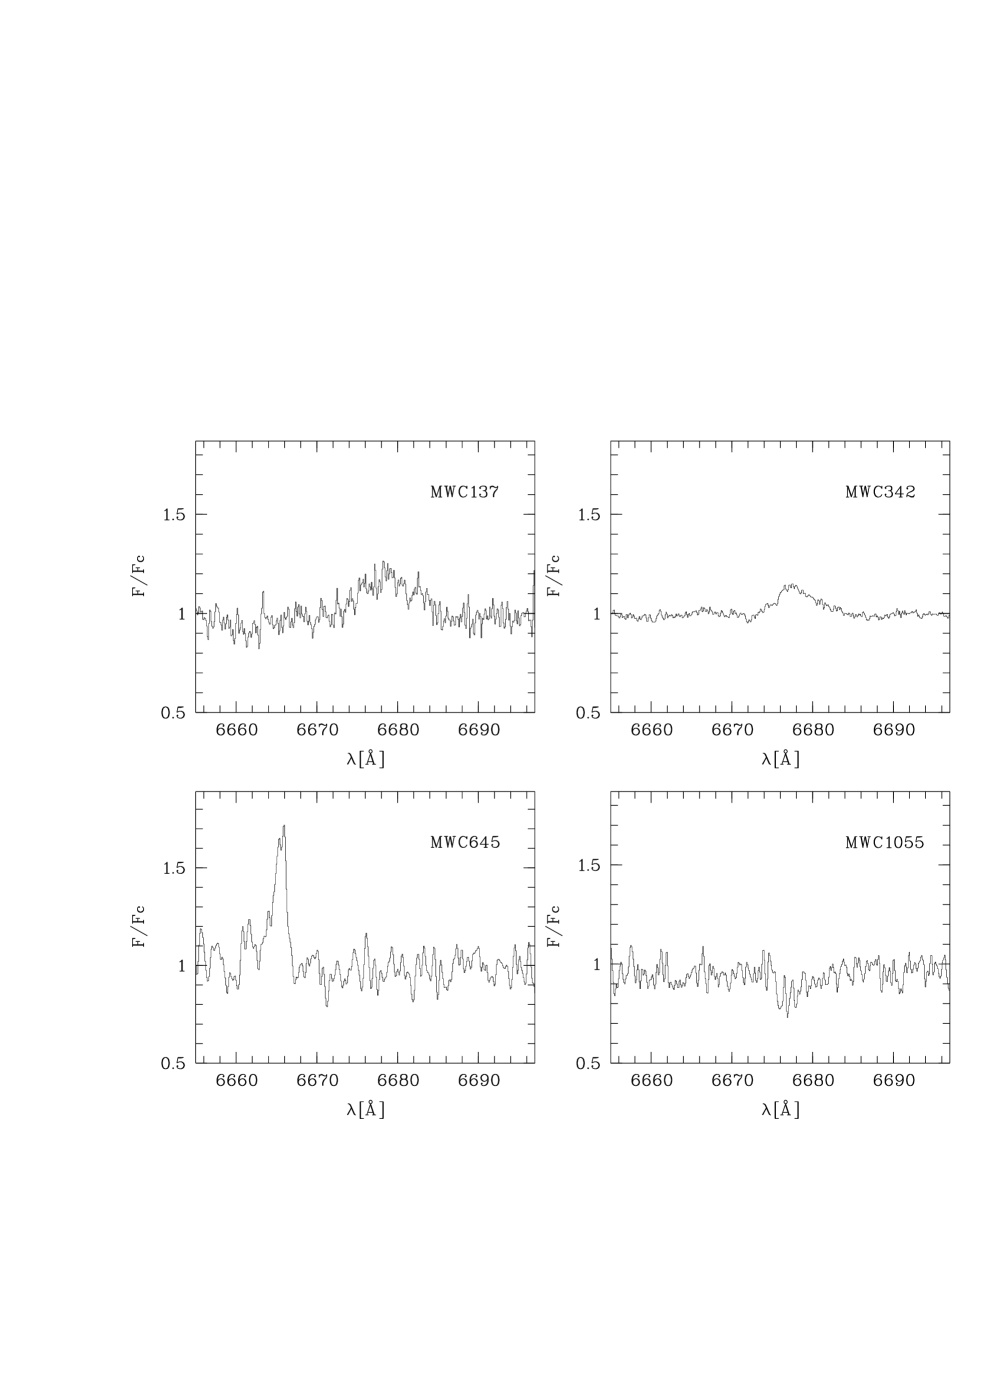
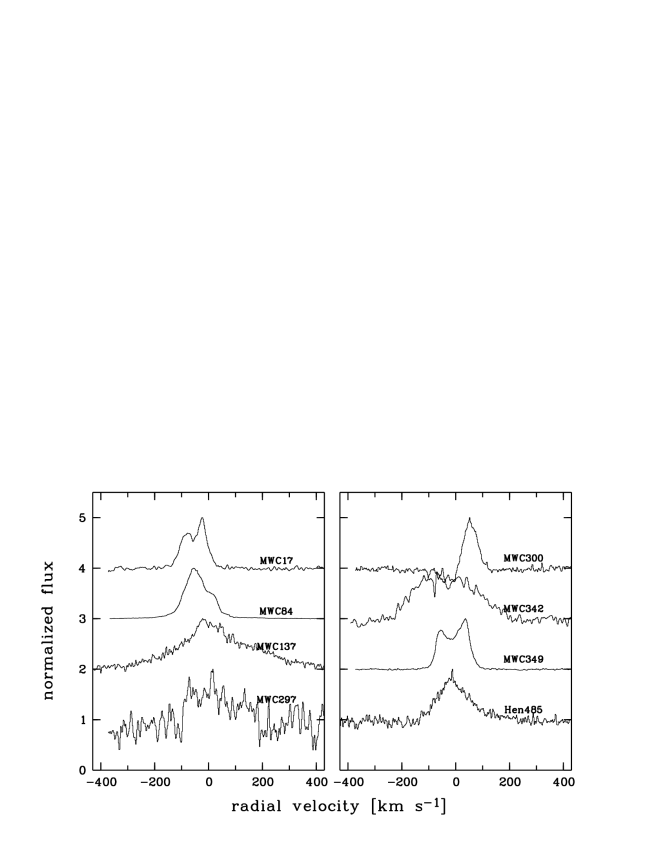
The He i5876Å lines are displayed in Fig. 23. They appear in all four varieties of profile types. However, only one star exhibits a clear P Cyg profile of type 1, namely MWC 300. In CPD$-57°2874$ an emission component seems to partly fill in the absorption component. Two stars show split type 3 profiles and five stars single-peaked emission profiles. Six stars show an absorption line. For four stars no observation of He i5876Å were obtained. In MWC 137 strong variability was found between 1987 and 2002. The He i line changed from absorption to emission (cf. Sect. C.3).
3.4 Summary
An important result of the observations presented here is the detection of one or more double-peaked emission lines in many objects (cf. Table 5). Actually, 15, possibly 16, of the 18 objects show at least one line with a double-peaked profile. This profile type is found for both, permitted and forbidden lines, but not necessarily for each line of a particular star. Eleven of the 18 objects have split H profiles. Split forbidden lines are found in 13 objects. Twelve stars exhibit split [O i] lines. The fraction of split lines of [N ii] and [Fe ii] is smaller. Only 8 of 18 stars exhibit split [N ii] lines, and 5 of 17 stars have split [Fe ii] lines. There are only 2 cases where H is double-peaked, but all forbidden lines are single-peaked emission lines. These are HD 87643 and MWC 300. According to Oudmaijer et al. (Oudmaijeretal98 (1998)), and Wolf & Stahl (WolfStahl85 (1985) and Winkler & Wolf (WinklerWolf89 (1989)), respectively, they belong to the B[e] supergiants and are most likely viewed under intermediate to pole-on inclination angles. Note, however, that the nature of these stars still is controversially discussed (see also Sect. C.5).
A remarkable feature of the double-peaked profiles is that most, i.e., 85%, of the observed lines have an intensity ratio of the violet to red component of . Of the 43 detected type 3 lines only 8 show a ratio larger than 1. These are 6 of 26 forbidden, and 2 of 16 permitted lines (cf. Table 7). The latter are all Fe ii lines.
4 Density conditions in the forbidden-line forming zone
The interpretation of the observed line profiles might be complicated by the fact that the sample of B[e]-type stars is not homogeneous with respect to the intrinsic object characteristics. The discussion by Lamers et al. (Lamersetal98 (1998)) showed that the connection between the different classes of B[e]-type stars is the uniformity of the B[e] phenomenon which calls for invoking a common cause for its occurence in different environments. In the following we will therefore take the view of looking primarily at the B[e] phenomenon itself rather than at specific object classes.
The forbidden-lines in the spectra of B[e]-type stars are dominated by lines of low-excitation ions of neutral or singly ionized metals. Higher excitation lines like [S iii] are rare. This indicates that the temperature in the line emitting region is about K (Lamers et al. Lamersetal98 (1998)). The forbidden lines probe the outer low-density zone of the line formation region. A measure for the maximum density in this region is the critical density, , for which downward collisional and radiative rates are equal. In the approximation of a 2-level ion with upper level and lower level it is given by
| (1) |
with the radiative transition probability , and the rate coefficient for collisional de-excitation (Osterbrock Osterbrock89 (1989)).
At K the critical density of the neutral line [O i]6300Å is 3 106 cm-3 (e.g. Böhm & Catala BoehmCatala94 (1994)). [N ii]6583Å has a lower critical density than [O i]6300Å, cm-3 (Osterbrock Osterbrock89 (1989)). For [S iii]6312 the critical density is 1.4 107 cm-3 This value was obtained with the IRAF task ionic by Shaw & Dufour (ShawDufour94 (1994)).
For the metastable levels of singly ionized iron giving rise to the observed forbidden transitions the critical density can be estimated from Eq. (1). Following Beck et al. (Becketal90 (1990)) this relation can be rewritten as
| (2) |
with the collision strength , the statistical weight and the electron temperature . According to Viotti (Viotti76 (1976)) is given by
| (3) |
with the wavelength in microns. For [Fe ii](14F) Å this leads to cm-3 for K. The critical densities are summarized in Table 6.
| ion | [O i] | [Fe ii] | [N ii] | [S iii] |
|---|---|---|---|---|
| line | Å | Å | Å | Å |
| [cm-3] | 3 106 | |||
| [eV] | 0.0 | 7.90 | 14.53 | 33.70 |
The forbidden lines not only differ with respect to the critical density but also have different ionisation potentials. The ionisation energy necessary to form Fe ii is 7.9 eV. For N ii an energy of 14.53 eV is required. With eV S iii has the highest ionisation energy of the observed forbidden lines. Hence, the forbidden lines probe a density interval of about three orders of magnitude, - cm-3, and a range of ionisation from neutral, [O i], to [S iii] with an ionisation potential of eV.
5 Disk wind: radial expansion vs. rotation
A spherically symmetric and radially expanding wind is expected to form flat-topped profiles if the lines are optically thin. This has already been shown by Beals (Beals31 (1931)). The forbidden lines in particular form at large distances from the central star where the wind has reached the terminal velocity (see below). A constant velocity wind is expected to form box-shaped lines if the emissivity is constant throughout the emitting volume.
In the observed sample of B[e]-type stars there is just one case, CPD 572874, where a line profile comes close to flat-topped, however not box-shaped. This is the line [O i] of this object. The vast majority of the observed profiles are clearly different from flat-topped and therefore are inconsistent with a spherically symmetric and optically thin line formation region. Deviations from flat-topped profiles could be produced in the case of spherical symmetry by additional extinction due to dust distributed evenly throughout the line formation region. This has been discussed e.g by Appenzeller et al. (AJO84 (1984)) for T Tauri stars. However, the profile shape expected for this configuration is not observed in any of the B[e]-type stars of the sample presented here. The polarimetric observations and the forbidden line profiles therefore strongly indicate that the B[e] phenomenon is correlated with an anisotropic distribution of the circumstellar matter.
Split profiles of H similar to those shown in Fig. 1 are frequently found in classical Be stars, although the H equivalent widths in these stars are usually much smaller than in B[e]-type stars and the underlying photospheric absorption component is often discernible. The double-peaked Be star profiles are generally assigned to a disk-like geometry of the line forming region in connection with rotation.
Mihalas & Conti (MihalasConti80 (1980)) discussed the formation of Beals type III, i.e. type 3, line profiles in the context of the combination of rotation and expansion in a disk-like circumstellar environment. Adding expansion could in particular explain the blueshifted absorption components of H and the ratios smaller than 1. It would introduce an asymmetry of the line profiles by shifting the central reversals towards shorter wavelengths as observed for most B[e]-type stars. For the forbidden lines, however, this mechanism would not work because the lines are optically thin and therefore absorption does not contribute. Nevertheless, the combination of expansion and rotation could at least explain the observed double-peaked profiles of H.
The double-peaked profiles of the optically thin lines could quite naturally be produced in rotating disks as shown e.g. by Pöllitsch (Poellitsch81 (1981)). Keplerian disks could for example exist around binary B[e] stars (see Sect. 1). The profiles calculated by Pöllitsch display, however, two emission peaks with due to the axial symmetry. Profiles of this type are found only in a few cases, e.g. [S iii] of MWC 349A, [N ii] of CPD 572874, [N ii] and [Fe ii] of MWC 939, and [O i] of CD 245721 and CPD 572874. However, the majority of double-peak lines has including other lines of the mentioned stars. It is therefore not obvious that rotation is the likely explanation for the double-peaked profiles. Rather, the line profiles seem to be determined by radial outflow.
Let us assume as an example a disk-like configuration with a rotational velocity at 1 of km s-1 and a constant radial expansion velocity of . Angular momentum conservation requires . Hence at a distance of 10 the rotation velocity would have dropped to 30 km s-1. At this point an expansion velocity of 50-100 km s-1 as observed for the disks of B[e] supergiants would dominate the velocity field. Further out in the disk, at , rotation would not play a role anymore. In classical Be stars and sgB[e]s densities of about cm-3 have been observed for wind zones near the star (e.g. Waters Waters86 (1986), Zickgraf et al. Zickgrafetal89 (1989)). The density thus would have dropped to cm-3 at . At this density and distance the forbidden lines are formed. Therefore the forbidden line zone should be dominated by expansion rather than rotation under the assumptions made above. Whereas the forbidden lines are formed in tenuous regions at large distances from the central star H is formed in the inner regions of the disk. Here at distances of the velocity field could still be dominated by rotation.


The observed line widths may help to better understand the possible role of expansion and rotation. In a disk-like circumstellar environment in which rotation dominates over expansion the forbidden lines are expected to be narrower than the permitted lines because the rotational velocity decreases outwards. If rotation is negligible compared to the expansion velocity of a wind accelerated outwards the forbidden lines should have a larger width than the permitted lines. The latter are formed in the accelerating inner wind zone. The forbidden lines originate at large distance from the star where the wind has reached the terminal velocity.
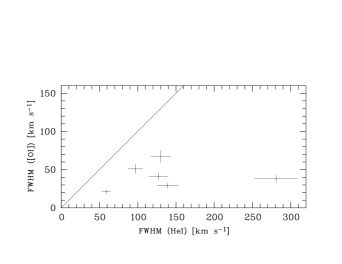
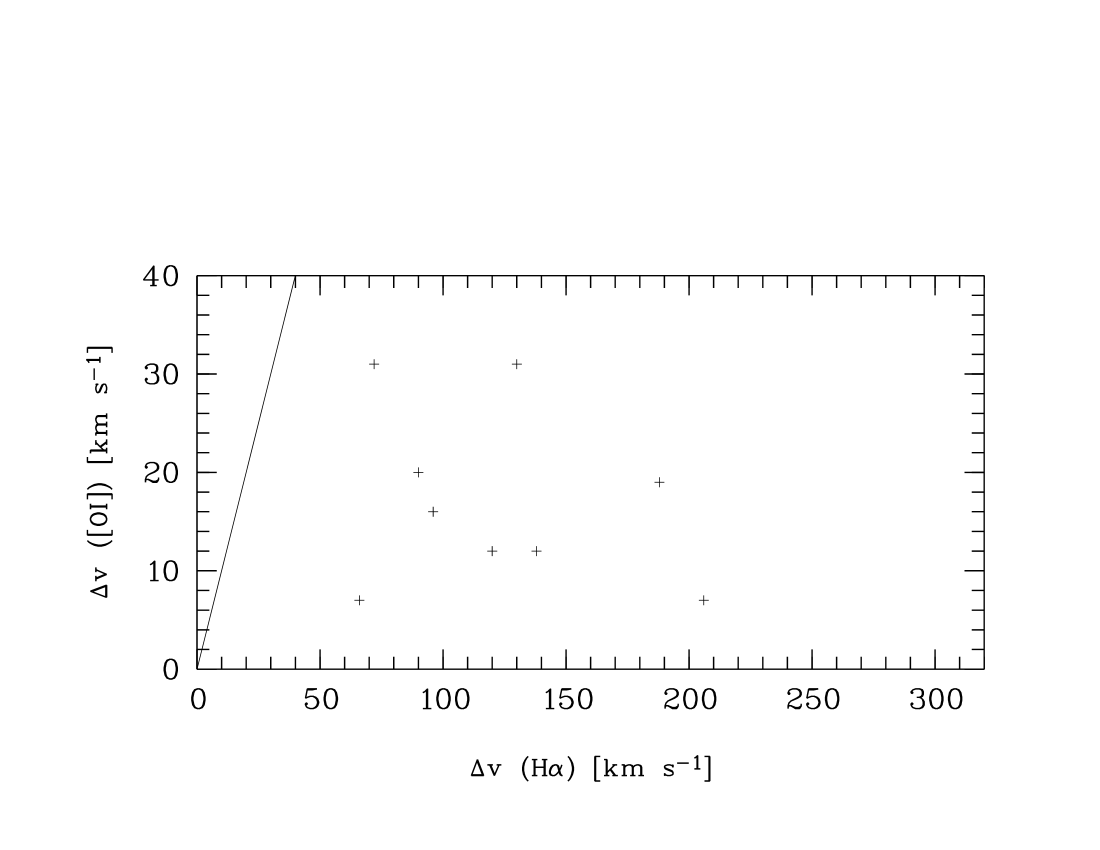
In Figs. 5 and 6 the FWHM of [O i]6300Å is plotted versus the FWHM of H and He i, respectively. They clearly show that the low-excitation forbidden line is on the average significantly narrower than the permitted lines. MWC 645 is exceptional because of the narrow red peak of H. The line widths are thus consistent with the first assumption, i.e. the velocity field in the inner wind zone could be dominated by rotation.
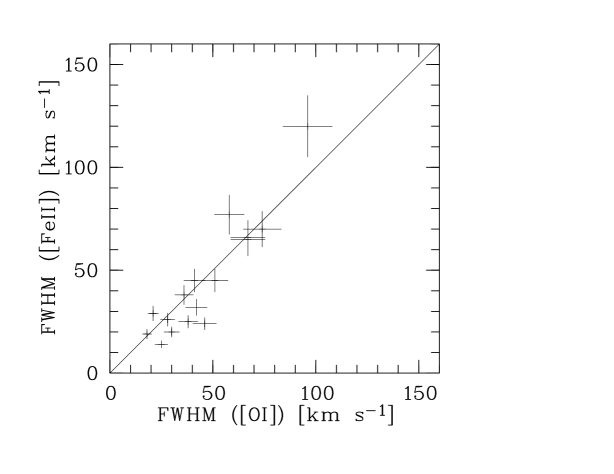
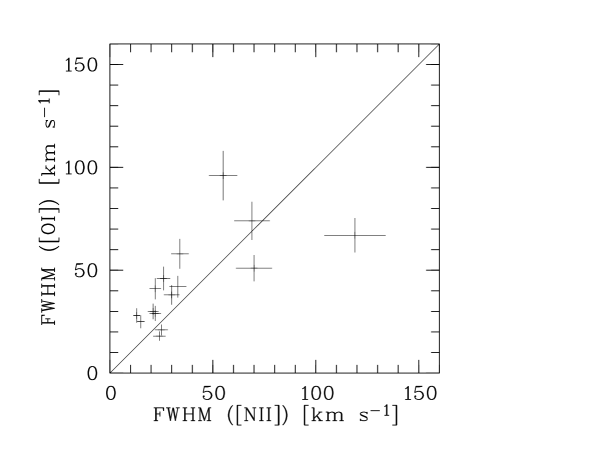
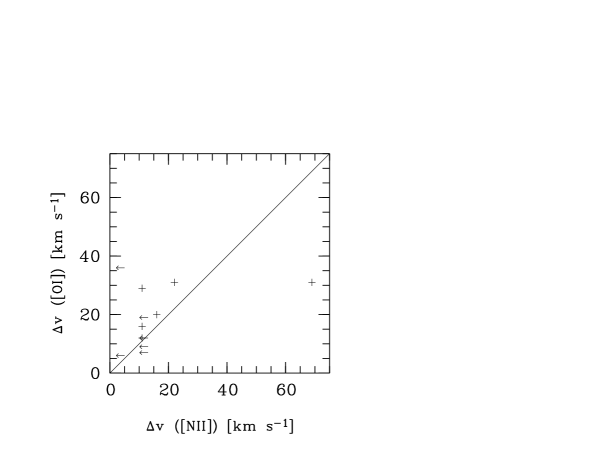
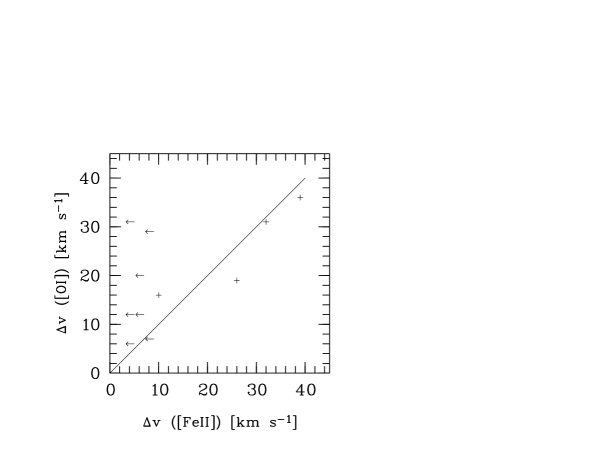
The comparison of the line widths of the forbidden lines shown in Fig. 7 reveals a correlation which is consistent with the assumption that the velocity in the line forming region is constant, and hence that rotation is not important far from the central star. With few exceptions the [O i] line is approximately as broad as the [Fe ii] line. For [N ii] the result is similar, however, with larger scatter. The comparison of [N ii] and [Fe ii] displayed in the lower left panel of Fig. 7 shows four stars with broader [Fe ii] than [N ii]. Note that in two of these cases, MWC 137 and MWC 1055, the lines are very weak and the line widths are uncertain. Only Hen 485 and CPD 572874 show significantly broader [Fe ii] than [N ii]. The general trend is towards equal widths or smaller widths for [Fe ii]. The comparison with [S iii] is not meaningful and therefore not shown because only three stars exhibit this line, i.e. MWC 17, MWC 137, and MWC 349A. Inspecting the line widths listed in Table 7 for [S iii] no clear trend emerges for the few lines.
The line splitting is depicted in Figs. 8 and 9. For single lines the velocity corresponding to the spectral resolution was adopted as upper limit of the line splitting. For the line splitting no clear correlation between different lines exists. However, H exhibits a much larger splitting than the forbidden metal lines, which is again indicative of a higher velocity in the H forming region. A few stars with both, split [Fe ii] and [N ii] are found close to the diagonal line of equal splitting shown in Fig. 9. For [O i] and [N ii] the scatter is large. Most upper limits of the line splitting of [N ii]Å are close to the line of equal peak separation.
The line widths are thus consistent with the assumption that in the inner wind zone rotation could play a role. In the outer regions where the forbidden lines are formed a constant velocity wind seems to prevail.
Alternative to rotation, split optically thin emission-line profiles can result from a radial outflow with a hollow-cone geometry as discussed e.g. by Appenzeller et al. (AJO84 (1984)). Such a configuration may be considered an approximation of the radially outflowing equatorial disk wind adopted by Zickgraf et al. (Zickgrafetal85 (1985),Zickgrafetal86 (1986)) for the B[e] supergiants. However, as before the axial symmetry of this configuration entails the problem of understanding the ratios. In the case of T Tauri stars asymmetric line profiles were explained e.g by Appenzeller et al. (AJO84 (1984)) and Edwards et al. (Edwardsetal87 (1987)) by assuming an opaque dust disk. Because the B[e] phenomenon is characterized by the existence of circumstellar dust, a dust disk is also a possible explanation for line asymmetries in B[e]- type stars. As will be shown in Sect. 6 it is not required that this disk is opaque. The opaque disk configuration with a constant velocity law leads to in contrast to what is observed for the majority of B[e]-type stars, namely . However, modifying the model parameters somewhat profiles similar to the observed ones could be produced. This will be shown in the following section.
6 Theoretical profiles of optically thin lines

6.1 Line profiles for a latitude-dependent wind model
A detailed discussion of optically thin emission-line profiles was given by Edwards et al. (Edwardsetal87 (1987)) (E87 hereafter) for the case of forbidden lines of T Tauri stars. They calculated line profiles for axially symmetric and radially expanding winds with an equatorial opaque dust disk.
In order to study the observed forbidden lines of the B[e]- type stars profiles of optically thin lines were calculated following the method of E87 which is shortly summarized here. The adopted geometry is depicted in Fig. 5 of E87. The requirement of an opaque dust disk was relaxed by allowing arbitrary optical depths for an equatorial dust ring (see below). The inclination angle is measured with respect to the polar axis. Polar coordinates , , of the vector are defined in the stellar reference frame with being the distance from the star, the angle of the vector with the polar axis and the rotation angle around the polar axis.
For the velocity law the latitude-dependent model of E87 was chosen for two reasons. Firstly, it represents a disk-like structure resembling the two-component wind model for B[e] supergiants suggested by Zickgraf et al. (Zickgrafetal85 (1985)) with a fast polar and a slow equatorial wind. Secondly, the profiles for the latitude-independent wind shown in E87 do not resemble the observed line profiles of the B[e]-type stars neither for optically thick nor optically thin dust absorption.
In the latitude-dependent model the wind was chosen to have a constant velocity in radial direction depending on the latitude according to
| (4) |
with being the velocity in polar direction. The latitude-dependent factor describes the variation of the wind velocity from the pole towards the equator. Assuming e.g. a B supergiant wind in the direction towards the pole with a maximum expansion velocity of km s-1 an equatorial wind velocity of km s-1 would correspond to . This assumption is consistent with the equatorial velocities of km s-1 measured for B[e] supergiants by Zickgraf et al. (Zickgrafetal96 (1996)).
For the model calculations presented below in Figs. 10 to 14 a linear decrease of from 1 to 0.2 between and was adopted. Note that the minimum value of specifies the line width at FWHM. The profile shape, however, is independent of this value. The wind velocity was normalized to 1 relative to the velocity in the direction of the polar axis. Other functional dependencies of are possible. For example, in the bi-stable wind model suggested by Lamers and Pauldrach (LamersPauldrach91 (1991)) for outflowing disk winds of early-type stars could be described by a step or ramp-like function which takes constant values within certain ranges around the equator and the pole with some transition region in between. However, the general characteristics of the profiles remain similar unless the constant velocity part of the wind prevails. Then the models approach the latitude-independent case.
The electron density at point normalized to the critical density is given by
| (5) |
where is the density ratio at and . For a given density distribution the parameter thus depends on the critical density of the line considered. Lower critical density lines correspond to larger values. A line with or 10 000 has reached the critical density at or respectively, in the polar direction. Note that due to the dependence the density distribution is disk-like with the density increasing towards the equatorial plane. According to E87 the emissivity for a 2-level atom is
| (6) |
where is the ratio of the collisional rate coefficients of the lower and upper level. The line profiles turned out to be insensitive to which could therefore be set to . The emissivity was set to zero for with given by the condition of , i.e. no line emission for . For each volume element the radial velocity along the direction of the line of sight was calculated from
| (7) |
with
| (8) |
being the angle between and the line of sight. Finally, the flux contributions of all volume elements within were summed up in the suitable velocity intervals evenly distributed between and .
Edwards et al. assumed the presence of an opaque disk blocking entirely the receding part of the wind. For the B[e] stars an equatorial ring structure was adopted instead with an inner ring radius and an optical depth of . The case and corresponds to the configuration of E87. The ring structure with takes into account that the inner rim of the dust disk should depend on the dust condensation radius. According to Lamers & Cassinelli (LamersCassinelli98 (1998)) the equilibrium temperature of the dust varies as . For the B[e]-type stars it can therefore be estimated to be to for between 104 K and 2.5 104 K and K. Volume elements below the equatorial plane, i.e. at , contribute to the observed flux unless the line of sight passes through the central hole. In this case . Hence, for lines with different critical densities can be affected differently by the dust absorption because the inner radius of the line-emitting volume, , depends on .
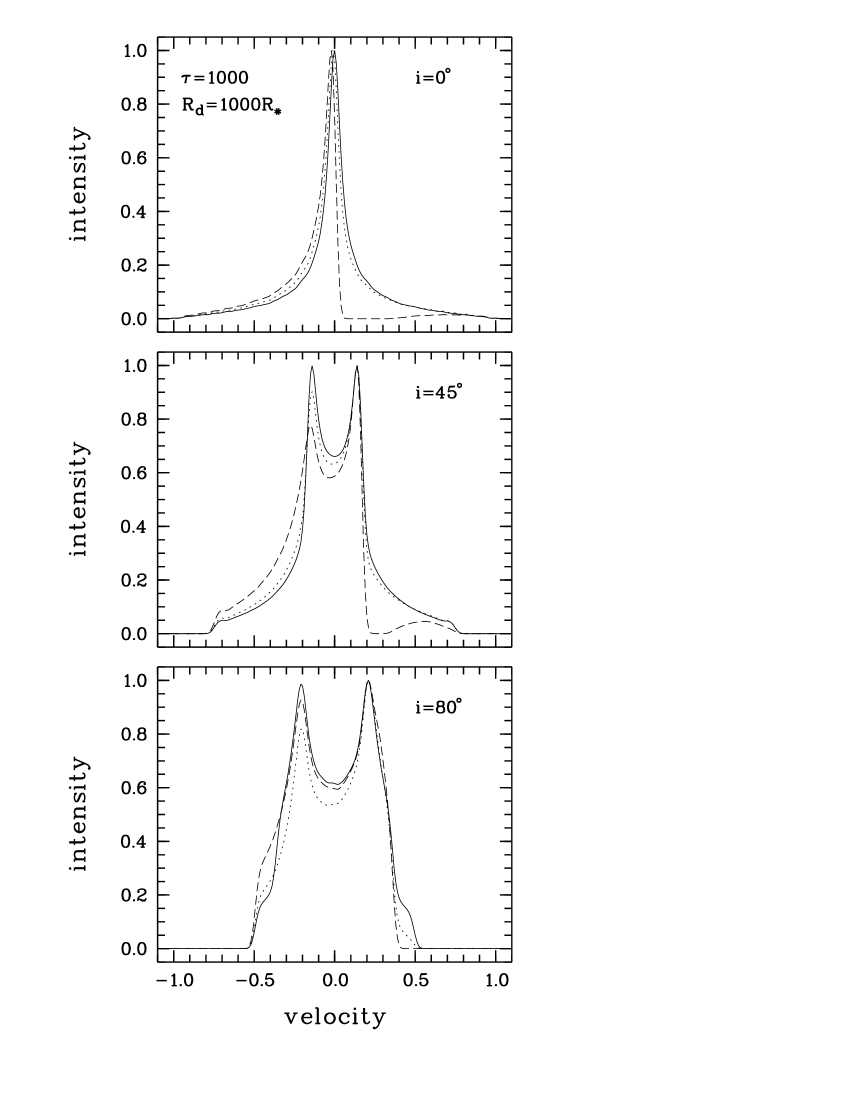
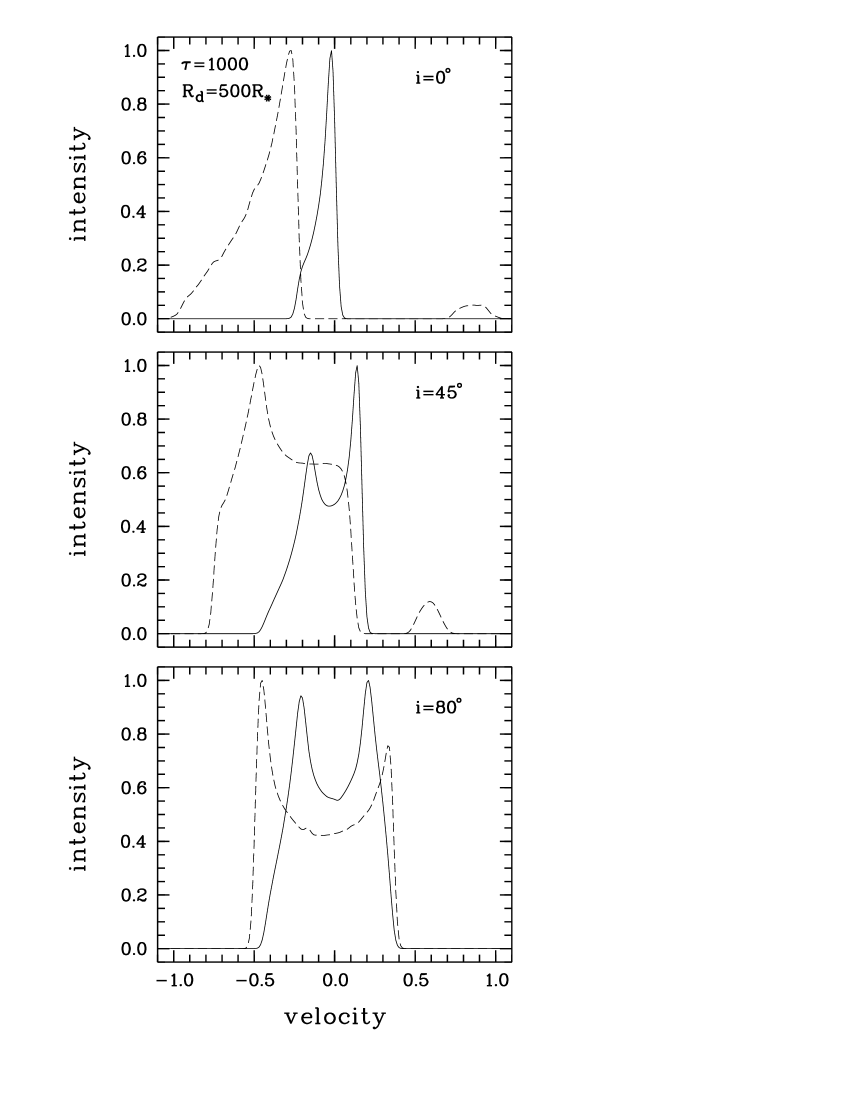
In Figs. 10 to 12 the results of the model calculations are displayed for the linear ) law and various parameter combinations. Figure 10 shows line profiles calculated for , different inclination angles , and three values of the optical depth of 0.1, 1, and 1000. Note that for the profile shape does not depend on . The profiles for are identical to those shown by E87. A smaller leads to a more symmetrical profile. For large inclination angles double-peaked profiles are produced. The ratio of the peak fluxes is always and depends on . A small leads to for all inclination angles. For the ratio deviates significantly from 1 except for large . The peak separation is determined by and depends also on the inclination . Decreasing and/or yields a smaller velocity difference of the line peaks. There is also some weak dependence of the peak separation on .
In Figs. 11 and 12 the influence of as a function of inclination is shown for models with a dust ring. The inner radius of the ring is assumed to be . Two sets of models are shown for which the optical depth of the dust is = 1 and 1000, respectively. Different values were adopted for a polar density at the base of the wind of cm-3 and the critical densities given in Table 6 for [Fe ii], [O i], and [N ii]. This corresponds to an equatorial density of cm-3. For small the profiles remain nearly symmetric with increasing . Only a small decrease of the flux on the red wing can be seen. For intermediate inclination angles the split profiles show a trend of decreasing with increasing . For large the lines become more asymmetric for increasing because the emission for lines with a low critical density starts at a larger distance from the star. Therefore less emission can be seen through the central hole of the dust ring. The configuration thus approaches that of Fig. 10. The receding part of the wind produces a weak bump on the red side of the profile if the inclination angles is not too large. For high inclination the ratio decreases with increasing , passes through a minimum and then increases again. The models thus show that one line may show and at the same time another line with a different can have .

Up to now a disk-like wind model with a latitude-independent ionization structure has been considered. However, lines with different ionization potentials may originate in different zones of the wind. For example, the two-component stellar wind model by Zickgraf et al. (Zickgrafetal85 (1985)) suggests that the cool equatorial zone should give rise to neutral or low-ionisation lines of ions like [O i] and [Fe ii]. Lines with higher ionization potential like [N ii] and [S iii] would originate in hotter yet tenuous regions at higher latitude towards the polar zone. A scenario like this is therefore characterized by a latitude-dependent ionization structure. It can be sketched by the hollow and filled cone model, respectively, of Appenzeller et al. (AJO84 (1984)). In the hollow cone geometry the emission is restricted to a volume within a certain angle from the equatorial plane. Correspondingly, the filled cone is the volume within a certain angle from the polar axis. In the following the terms “equatorial disk” and “polar cone” will therefore be used for the hollow and filled cone geometry, respectively.
Figs. 13 and 14 show line profiles for the case of an opening angle of 30° (measured from the equatorial plane) for the equatorial disk and 60° for the polar cone (measured from the polar axis). In the case of a small optical depth of the dust () the resulting profiles for the polar cone are complex. The equatorial disk produces profiles similar to the latitude-independent ionization model discussed above (opening angle ) . The FWZI of the equatorial disk line decreases with a decreasing opening angle of the disk. With increasing or decreasing the red peak of the polar cone line becomes weaker.

6.2 Comparison with observations
The comparison of the observed profiles in Fig. 2 and of the models displayed in Figs. 10 to 14 shows that the general characteristics of the forbidden lines can qualitatively be reproduced. According to the model calculations split or asymmetric profiles are expected from the latitude-dependent wind model with dust disks or rings of various optical depths. The single and more or less symmetric emission peaks observed for a couple of stars can be produced with small inclination angles and small optical depths of the dust ring or disk. Furthermore, for a given inner radius of the dust ring the different critical densities can lead to differences in the observed line profiles. Likewise, variations of the ratio from to are expected if the lines originate in different regions as e.g. in the equatorial disk and polar cone configuration.
The [O i] lines of MWC 17, MWC 297, MWC 349A, MWC 645, MWC 939, HD 45677, and CPD 529243 qualitatively resemble the profiles shown in Fig. 10 to 12 for intermediate to large inclination angles. In most cases the wings appear symmetric (or nearly symmetric) as expected for a small optical depth of the dust ring. Exceptions are MWC 645 and possibly Hen 485 for which the line profiles resemble those for a large optical depth of the dust and intermediate inclination. In MWC 645 the lines exhibit a strong asymmetry with pronounced blue wings and split peaks. In Hen 485 the [O i] line and, to a lesser degree, the [N ii] line also show an asymmetric profile with a blue wing similar to MWC 645. Line splitting is not discernible, though. The absence of splitting expected for an intermediate inclination could be due to turbulent broadening as discussed below.
The lines of MWC 300 and HD 87643 are similar to the profiles for a small inclination angle and small optical depth of the dust. A near pole-on viewing angle was suggested by Winkler & Wolf (WinklerWolf89 (1989)) for MWC 300 and by Oudmaijer et al. (Oudmaijeretal98 (1998)) for HD 87643.
In Hen 1191 and CPD 572874 the [N ii] lines are characterized by a broad pedestal on top of which a narrow peak is sitting. This bears some resemblance with the profiles calculated for small optical depth of the dust and small to intermediate inclination.
An interesting feature of the polar cone lines shown in Fig. 13 and 14 is that they can have if seen under intermediate to large inclination angle. Neither the models with opening angles of displayed in Figs. 10 to 12 nor the equatorial disk lines in Figs. 13 and 14 show this behaviour. This could explain the [O i] lines in MWC 137, MWC 342, and CD 245721, and the [N ii] lines of MWC 349A and CPD 572874. Likewise, the equatorial disk and polar cone model produces lines with different width, both FWHM and FWZI, which is not the case in the latitude-independent ionization model.
The complex profiles obtained for a equatorial disk and polar cone model with optically thin dust were not observed in the sample discussed here. However, the forbidden lines of MWC 17 and MWC 349A show a strong resemblance with the profiles displayed in Fig. 14 for optically thick dust and inclination . In both stars the lines of [N ii] and [S iii] are broader than [O i] and [Fe ii]. This is expected for the equatorial disk and polar cone model if the higher ionization lines originate in the polar zone (filled cone) and the lower ionization lines in the equatorial region (hollow cone). The profiles displayed in Fig. 11 for optically thin dust also exhibit the double peak structure if the inclination is high. However, in these models the line forming regions are not separate for lines with different ionization potential. Contrary to the observations the lines should thus show the same widths. Note that for MWC 349A there is observational evidence for the existence of a dust disk seen edge-on (White & Becker WhiteBecker85 (1985), Leinert Leinert86 (1986), Hofmann et al. Hofmannetal02 (2002)). The observations are thus in favour of the equatorial disk and polar cone model with optically thick dust.
An interesting feature of this model in the case of large optical depth of the dust disk is the behaviour of the ratio. The polar cone line can have a flux ratio and at the same time the corresponding equatorial disk line has . This could explain qualitatively the different appearance of the lines in MWC 349A which shows simultaneously [O i], [Fe ii], and [S iii] lines with and [N ii] with .
The equatorial disk and polar cone model also seems promising for MWC 137, MWC 342, and CD 245721. In these objects the [O i] exhibits a ratio . In MWC 137 the line widths and the ratio suggest that [O i] is a polar cone line, whereas [S iii] and [N ii] are equatorial disk lines.
In Hen 230 and MWC 1055 the [N ii] line shows a red wing indicating that this line originates in a polar cone seen under an intermediate aspect angle. In Hen 230 the wing is also indicated in [Fe ii].
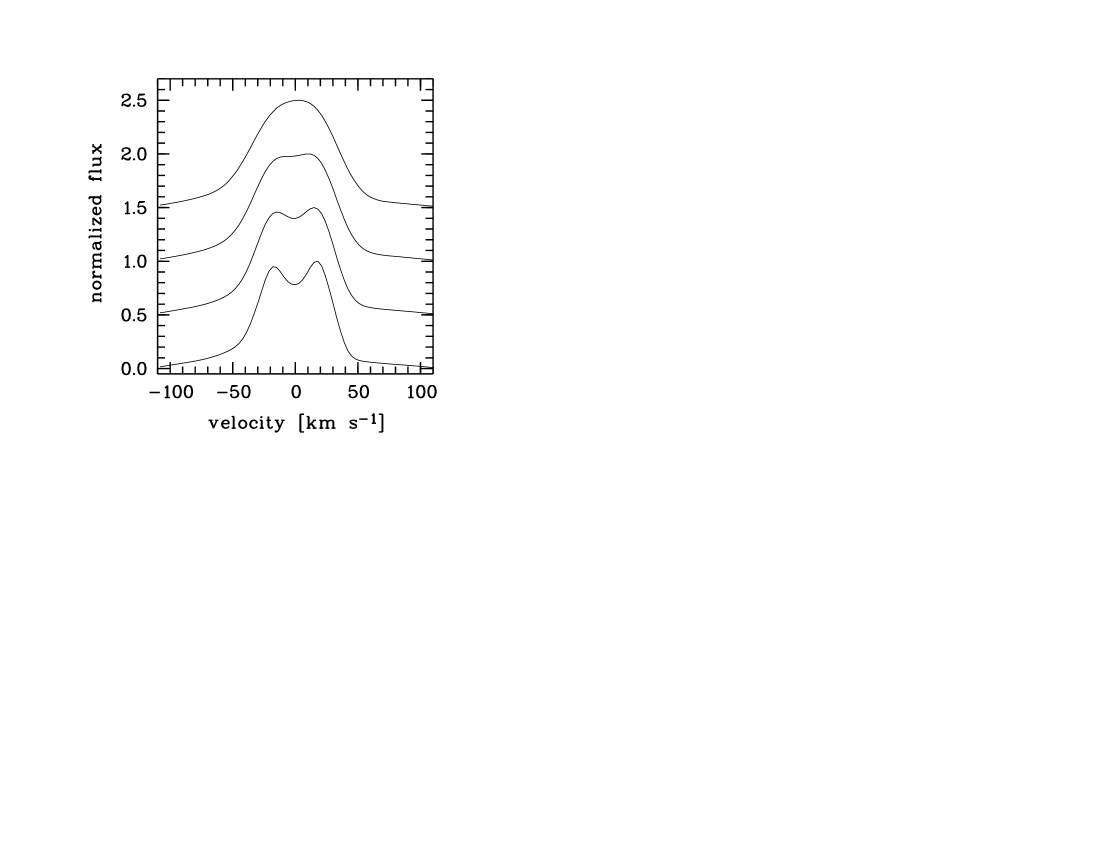
Though many line characteristics can thus be understood in terms of the latitude-dependent wind model there seems to be a problem in explaining simultaneously split and single-peaked forbidden lines as observed in several stars. In many of these cases insufficient spectral resolution or too low an ratio might be an explanation for the apparent differences of the profiles, e.g. in MWC 297, and MWC 1055. In MWC 17, MWC 342, HD 45677, and CD 245721, however, the differences seem to be real. A possible explanation could be the existence of macroscopic turbulent motion of the order of km s-1. It would broaden the local line profile and therefore smear out line splitting if the expansion velocities are small enough. As an example a hollow cone model with an opening angle of 30° and an inclination angle of 45° is shown in Fig. 15. For the wind a polar velocity of km s-1, and an equatorial velocity of km s-1, i.e. , was adopted. The line broadening due to macro turbulence was assumed to have a Gaussian shape with a FWHM given by the turbulent velocity . Four values were assumed for , i.e. 15, 20, 30, and 35 km s-1. The optical depth of the dust disk was . The figure shows that the split profile disappears for high . If the lines originate in different regions, e.g. due to ionization effects, a location-dependent turbulence velocity could therefore lead to the observed differences in the profiles. A high could also be responsible for the sloping tops of the lines of CPD 529243. and [N ii] with (cf. Fig. 2).
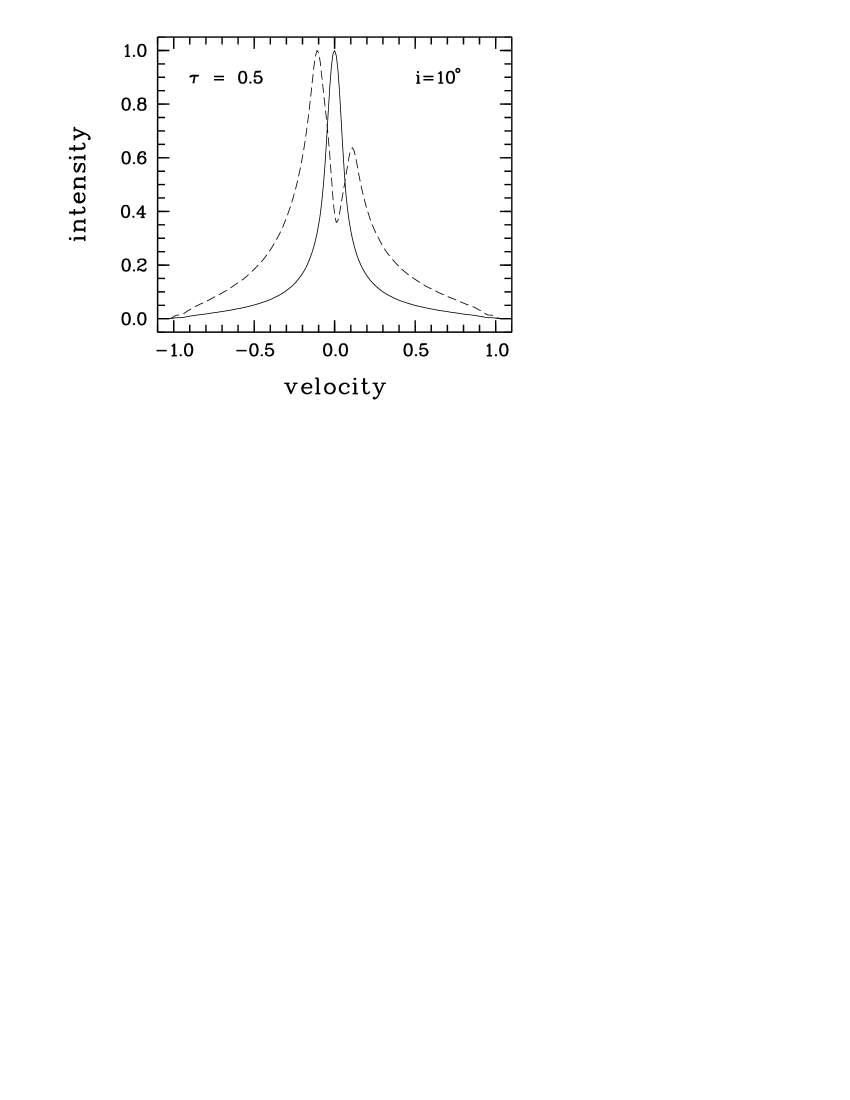
Alternatively, the simultaneous appearance of split and single-peaked lines of the different ions can be explained with the equatorial disk and polar cone model. MWC 342 and HD 45677 show split [O i], but single-peaked [Fe ii] and [N ii]. Surprisingly, such a combination of profiles can be produced in a nearly pole-on geometry. This is illustrated in Fig. 16 for a model with an inclination angle of . Here it is assumed that the split line originates in the polar cone with a large opening angle of about to . The line has a ratio of . The single-peaked line is produced with an opening angle of , which means latitude-independent ionization. This confguration thus can lead to split lines with and simultaneously to single-peaked lines.
7 Conclusions
High-resolution line profiles of selected permitted and forbidden lines of B[e]-type stars were discussed. A main result was the detection of double-peaked forbidden lines in a large fraction of the observed sample. This strongly indicates that the line formation environment has a non-spherical distribution, most likely in a disk-like configuration. Lines formed close to the star like H and He i were compared with forbidden lines formed in the tenuous outskirts. The comparison suggests that rotation could dominate in the inner zones but is overtaken by a radially expanding disk wind in the outer regions.
Line profiles were calculated for the optically thin case. Profiles similar to the observed forbidden lines are expected for a radially expanding latitude-dependent wind. This wind configuration can be considered a parametrization of the generally accepted two-component wind model for B[e]-type stars.
For many objects in the sample the observed line profiles are consistent with models assuming a latitude-independent ionization structure of the wind. There are, however, two other groups of objects for which the models suggest (partly) separated line forming regions for the different ions. In one group the low ionization lines seem to originate in an equatorial disk. In the second group the neutral line of [O i] appears to originate in a polar cone instead.
It is clear, though, that due to simplifying assumptions of the model it cannot be expected to explain all details of the observed profiles. Rather, the discrepancies might suggest that the environments, although in general having a disk-like structure, are apparently more complicated than assumed here. In particular, the ionization structure is taken into account only simplistically with the hollow and filled cone model because of the lack of information on this parameter. For example, charge tranfer reactions can have a strong influence on the ionization balance of oxygen and nitrogen (e.g. Chamberlain Chamberlain56 (1956), Butler & Dalgarno ButlerDalgarno79 (1979)). This has not been investigated for B[e] star disks so far. Binarity could add further complexity. However, as long as an expanding wind dominates the circumstellar environment at large distances from the central object the latitude-dependent wind model could also be applicable to such a subclass of B[e]-type stars. Thus even with the simplifying assumptions the results obtained here support the commonly adopted point of view that the forbidden emission lines of B[e]-type stars are formed in disk-like circumstellar environments.
Acknowledgements.
I would like to thank the Deutsche Forschungsgemeinschaft for granting travel funds (Zi 420/7-1) and for financial support under grants Wo 269/2-1 and Wo 269/2-2. I would also like to thank the referee, Dr. A. S. Miroshnichenko, for his critical comments which helped to improve the paper. This research has made use of the SIMBAD database, operated at CDS, Strasbourg, France.References
- (1) Acker, A., Chopinet, M., Pottasch, S.R., & Stenholm B. 1987, A&AS, 71, 163
- (2) Allen, D.A., 1978, MNRAS 184, 601
- (3) Appenzeller, I., Jankovics, I., & Östreicher, R. 1984, A&A, 141, 108
- (4) Allen, D.A., & Swings J.P. 1976, A&A 47, 293
- (5) Andrillat, Y., Jaschek, M., & Jaschek, C. 1996, A&AS, 118, 495
- (6) Andrillat, Y., & Jaschek, C., 1998 A&AS, 131, 479
- (7) Andrillat, Y., & Jaschek, C. 1999, A&AS, 136, 59
- (8) Barbier, R., & Swings, J.P. 1982, in Be stars, IAU Symp. No. 98, ed. M. Jaschek, & H.-G. Groth (Dordrecht: Reidel), 103
- (9) Beals, C.S. 1931, MNRAS, 91, 966
- (10) Beals, C.S. 1955, Pub. Dominion Astroph. Obs. 9, 1
- (11) Beck, H., Gail, H.-P., Gass, H., & Sedlmaier E. 1990, A&A, 238, 283
- (12) Böhm, T., & Catala, C. 1994, A&A, 290, 167
- (13) Brand, J., & Blitz, L. 1993, A&A, 275, 67
- (14) Brugel, E.W., & Wallerstein, G. 1979, ApJ, 229, L23
- (15) Butler, K., & Dalgarno, A. 1979, ApJ, 234, 765
- (16) Cidale, L., Zorec, J., & Tringaniello, L. 2001, A&A, 368, 160
- (17) Carlson, E.D., & Henize, K. 1979, Vistas Astron., 23, 213
- (18) Clark, J.S., Steele, I.A., Fender, R.P., & Coe, M.J. 1999, A&A, 348, 888
- (19) Chamberlain, J.W. 1956, ApJ, 124, 390
- (20) Cox, A.N. 2000. “Allen’s Astrophysical Quantities”, ed. A.N. Cox, AIP Press, Springer
- (21) de Freitas Pacheco, J.A., Gilra, D.P., & Pottasch, S.R. 1982, A&A, 108, 111
- (22) Dekker, H., Delabre, S., D’Odorico, S., et al. 1986, The Messenger, 43, 27
- (23) de Winter, D., & van den Ancker, M.E. 1997, A&A, 121, 275
- (24) Drew, J.E., Busfield, G., Hoare M.G., et al. 1997, MNRAS, 286, 538
- (25) Edwards, S., Cabrit, S., Strom, S.E., et al. 1987, ApJ, 321, 473
- (26) Esteban, C., & Fernandez, M., 1998, MNRAS, 298, 185
- (27) Finkenzeller, U., & Mundt, R. 1984, A&AS, 55, 109
- (28) Frontera, F., Orlandini, M., Amati, L., et al. 1998, A&A, 339, L69
- (29) Hamann, F., & Simon, M. 1986, ApJ, 311, 909
- (30) Hamann F., & Simon M. 1988, ApJ, 327, 876
- (31) Hartmann, L., Jaffe, D., & Huchra, J.P. 1980, ApJ, 239, 905
- (32) Herbig G.H. 1960, ApJS, 4, 337
- (33) Henize K., 1962, AJ 67, 612
- (34) Hofmann, K.-H., Balega, Y., Ikhsanov, N.R., Miroshnichenko, A.S., & Weigelt, G. 2002, A&A, 395, 891
- (35) Hubert, A.M., Jaschek C. (eds.) 1998, B[e] stars (Dordrecht: Kluwer Academic Publishers)
- (36) Israelian, G., Friedjung, M., Graham, J., et al. 1996, A&A, 311, 643
- (37) Israelian, G., & Musaev, F. 1997, A&A, 328, 339
- (38) Jaschek, C., & Andrillat, Y. 1999, A&AS, 136, 53
- (39) Jaschek, M., Andrillat, Y., & Jaschek, C. 1996, A&AS, 120, 99
- (40) Lamers, H.J.G.L.M., & Cassinelli, J.P., 1998, in Introduction to Stellar Winds (Cambridge University Press)
- (41) Lamers, H.J.G.L.M., & Pauldrach A., 1991, A&A, 244, 5
- (42) Lamers, H.J.G.L.M., Zickgraf, F.-J., de Winter D., et al. 1998, A&A, 340, 117
- (43) Le Bertre, T., Epchtein, N., Gouiffes, C., Heydari-Malayeri, M., & Perrier, C. 1989, A&A, 225, 417
- (44) Leibowitz, E.M. 1977, A&A, 56, 265
- (45) Leinert, C. 1986, A&A, 155, 6
- (46) McGregor, P.J., Hyland, A.R., & Hillier, D.J. 1988, ApJ, 324, 1071
- (47) Magalhaes, A.M. 1992, ApJ, 398, 286
- (48) Mihalas, D., & Conti, P.S. 1980, ApJ, 235, 515
- (49) Miroshnichenko, A., & Corporon, P. 1999, A&A ,349, 126
- (50) Miroshnichenko, A. S., Bjorkman, K. S., Chentsov, E.L. et al., 2002a, A&A, 383, 171
- (51) Miroshnichenko, A. S., Klochkova, V. G., Bjorkman, K. S., & Panchuk, V. E., 2002b, A&A, 390, 627
- (52) Osterbrock, D.E. 1989, Astrophysics of Gaseous Nebulae and Active Galactic Nuclei, (Mill Valley: University Science Books)
- (53) Orr, A., Parmar, A.N., Orlandini, M., et al. 1998, A&A, 340, L19
- (54) Oudmaijer, R.D., & Drew, J.E., 1999, MNRAS, 305, 160
- (55) Oudmaijer, R.D., Proga, D., Drew ,J.E., & de Winter, D. 1998, MNRAS, 300, 170
- (56) Parthasarathy, M., Vijapurkar, J., & Drilling, J.S. 2000, A&AS, 145, 269
- (57) Pfeiffer, M.J., Frank, C., Baumüller, D., Fuhrmann, K., & Gehren, T. 1998, A&AS, 130, 381
- (58) Pöllitsch, G.F. 1981, A&A, 97, 175
- (59) Schulte-Ladbeck, R.E., Clayton, C.G., Hillier, D.J., Harries, T.J., & Howarth, I.D. 1994, ApJ, 429, 846
- (60) Shaw, R.A., & Dufour, R.J. 1994, in Astronomical Data Analysis Software and System III, ed. D.R. Crabtree, R.J. Hanisch & J. Barnes ASP Conference Series Vol. 61, 327
- (61) Sharpless, S. 1959, ApJS, 4, 257
- (62) Surdej, A., Surdej, J., Swings, J.P., & Wamsteker, W., 1981, A&A, 93 ,285
- (63) Swings, J.P. 1973a, A&A, 26, 443
- (64) Swings, J.P. 1973b, Astrophys. Letters, 15, 71
- (65) Swings, J.P. 1981, A&A, 98, 112
- (66) Swings, J.P., & Allen, D.A. 1973, Astrophys. Letters, 14, 65
- (67) Swings, J.P., & Andrillat, Y. 1981, A&A, 103, L3
- (68) Swings, P., & Struve, O. 1941, ApJ, 93, 349
- (69) Thé, P.S., de Winter, D., & Peréz, M.R. 1994, A&AS, 104, 315
- (70) Viotti, R. 1976, ApJ, 204, 293
- (71) Waters, L.B.F.M. 1986, A&A, 162, 121
- (72) White, R.L., & Becker, R.H. 1985, ApJ, 297, 677
- (73) Winkler, H. 1986, Diploma thesis, University of Heidelberg
- (74) Winkler, H., & Wolf, B. 1989, A&A ,219, 151
- (75) Wolf B., & Stahl O., 1985, A&A 148, 412
- (76) Zickgraf, F.-J. 1998, in B[e] stars, ed. A.M. Hubert & C. Jaschek, (Dordrecht: Kluwer Academic Publishers), 1
- (77) Zickgraf, F.-J. 2000, in The Be Phenomenon in Early-Type Stars, ed. M.A. Smith, H.F. Henrichs, & J. Fabregat, ASP Conference Series 214, 26
- (78) Zickgraf, F.-J. 2001, A&A, 375, 122
- (79) Zickgraf, F.-J., & Schulte-Ladbeck R.E. 1989, A&A, 214, 274
- (80) Zickgraf, F.-J., & Stahl, O. 1989, A&A, 223, 165
- (81) Zickgraf, F.-J., Wolf, B., Stahl, O., Leitherer, C., & Klare G. 1985, A&A, 143, 421
- (82) Zickgraf, F.-J., Wolf, B., Stahl, O., Leitherer, C., & Appenzeller, I. 1986, A&A, 163, 119
- (83) Zickgraf, F.-J., Wolf, B., Stahl, O., & Humphreys, R.M. 1989, A&A, 220, 206
- (84) Zickgraf, F.-J., Humphreys, R.M., Lamers, H.J.G.L.M., et al. 1996, A&A, 315, 510
Appendix A Emission line parameters
In Table 7 the line parameters of the observed emission lines are listed. Line peak intensities (for the stronger peak in case of split profiles) and the ratio of blue and red peak intensities, , are given in the first two columns. is the equivalent width in Å, (in km s-1) is the peak separation for lines of type 3. FWZI and FWHM (in km s-1) are the full width at zero intensity and full width at half maximum, respectively. Errors of FWZI and FWHM were found to be about 10-15%. The meaning of “FWHM” is taken literally by measuring the line widths at the 50% flux level of the maximum peak flux independent of the line profile shape. For type 3 profiles with or type 1 P Cygni profiles this only measures the width of the red emission peak which is then used as a rough estimate for the FWHM. For H only a lower limit for FWZI can be given due to the small wavelength intervals covered by the spectra.
| MWC 17 | ||||||
| line | FWZI | FWHM | ||||
| H | 180.1 | 0.72 | 2050 | 178 | 90 | |
| He i5876Å | 5.7 | 0.68 | 200 | 97 | 54 | |
| O i]6300Å | 25.4 | 0.91 | 103 | 51 | 20 | |
| N ii]6583Å | 3.4 | 0.92 | 156 | 70 | 16 | |
| Fe ii]7155Å | 3.6 | – | 101 | 45 | – | |
| S iii]6312Å | 3.1 | 0.76 | 139 | 75 | 45 | |
| MWC 84 | ||||||
| line | FWZI | FWHM | ||||
| H | 109 | – | 1280 | 132 | – | |
| He i5876Å | 30.7 | – | 510 | 112 | – | |
| O i]6300Å | – | – | – | – | ||
| Fe ii]7155Å | 1.08 | – | 96 | (76:) | – | |
| N ii]6583Å | 2.7 | 1.00: | 159 | 58 | 14: | |
| S iii]6312Å | 1.2 | – | 117 | 84 | – | |
| MWC 137 | ||||||
| line | FWZI | FWHM | ||||
| H(1987) | 86.9 | – | 1400 | 197 | – | |
| H(2002) | 105.3 | – | 1600 | 196 | – | |
| He i5876Å (87) | – | – | – | – | – | |
| He i5876Å (02) | 1.9 | – | 796 | 270 | – | |
| O i]6300Å | 1.6 | 1.20 | 141 | 58 | 29 | |
| Fe ii]7155Å | 1.05 | – | 132: | 77: | – | |
| N ii]6583Å | 1.45 | 0.96 | 95 | 34 | 11: | |
| S iii]6312Å | 1.14 | – | 69 | 32 | – | |
| MWC 297 | ||||||
| line | FWZI | FWHM | ||||
| H | 98.2 | – | 1650 | 173 | – | |
| He i5876Å | 1.16 | – | 299 | 139 | – | |
| O i]6300Å | 14.9 | 0.92 | 77 | 29 | 9 | |
| N ii]6583Å | 1.35 | – | 82 | 22 | – | |
| MWC 300 | ||||||
| line | FWZI | FWHM | ||||
| H | 89.0 | 0.38 | 1140 | 65 | 78 | |
| He i5876Å | 2.10 | – | 201 | 59 | – | |
| O i]6300Å | 24.5 | – | 75 | 21 | – | |
| N ii]6583Å | 3.1 | – | 88 | 25 | – | |
| Fe ii]7155Å | 1.90 | – | 65 | 29 | – | |
| MWC 342 | ||||||
| line | FWZI | FWHM | ||||
| H(1987) | 60.5 | 0.27 | 1650 | 117 | 138 | |
| H(2000) | 58.3 | 0.20 | 1600 | 91 | 210 | |
| He i5876Å | 1.21 | – | 440 | 281 | – | |
| O i]6300Å | 3.94 | 1.20 | 124 | 38 | 12 | |
| N ii]6583Å | 1.16 | – | 86 | 30 | – | |
| Fe ii]7155Å | 1.22 | – | 89 | 25 | – | |
| MWC 349 | ||||||
| line | FWZI | FWHM | ||||
| H | 184 | 0.62 | 1230 | 152 | 72 | |
| He i5876Å | 11.4 | 0.79 | 257 | 130 | 86 | |
| O i]6300Å | 3.94 | 0.83 | 114 | 67 | 31 | |
| N ii]6583Å | 6.25 | 1.09 | 175 | 119 | 69 | |
| Fe ii]7155Å | 3.50 | 0.90 | 123 | 66 | 32 | |
| S iii]6312Å | 3.07 | 0.91 | 173 | 122 | 90 | |
| MWC 645 | ||||||
| line | FWZI | FWHM | ||||
| H | 478 | 0.38 | 1330 | 70 | 188 | |
| O i]6300Å | 10.1 | 0.83 | 279 | 74 | 19 | |
| N ii]6583Å | 1.24 | – | 105 | 69 | – | |
| Fe ii]7155Å | 5.55 | 0.82 | 260 | 70 | 26 | |
| MWC 939 | ||||||
| line | FWZI | FWHM | ||||
| H 1987 | 228 | 0.77 | 1260 | 174 | 96 | |
| H 1988 | 191 | 0.87 | 1140 | 169 | 86 | |
| H 2000 | 173 | 0.88 | 2700 | 160 | 83 | |
| O i]6300Å | 20.5 | 0.89 | 138 | 42 | 16 | |
| N ii]6583Å | 2.57 | 0.97 | 56 | 33 | 11 | |
| Fe ii]7155Å | 5.13 | 0.98 | 148 | 32 | 10 | |
| Fe ii6456Å | 1.65 | 1.68 | 153 | 78 | 36 | |
| MWC 1055 | ||||||
| line | FWZI | FWHM | ||||
| H (1987) | 68 | 0.04 | 101 | (206) | ||
| H (2000) | 62 | 0.03 | 3300 | 113 | (330) | |
| O i]6300Å | 2.54 | 0.86 | 54 | 28 | 7: | |
| N ii]6583Å | 1.07 | – | 26: | 13: | – | |
| Fe ii]7155Å | 1.11 | – | 47 | 26 | – | |
| Fe ii6456Å | 1.12 | – | 218 | 99 | – | |
| Hen 230 | ||||||
| line | FWZI | FWHM | ||||
| H | 96.2 | – | 1550 | 119 | – | |
| O i]6300Å | 2.26 | – | 88 | 25 | – | |
| N ii]6583Å | 1.16 | – | 41 | 16 | – | |
| Fe ii]7155Å | 1.25 | – | 36 | 14 | – | |
| Fe ii6456 Å | 1.20 | – | 156 | 89 | – | |
| Hen 485 | ||||||
| line | FWZI | FWHM | ||||
| H 1986 | 45.6 | – | 1800 | 159 | – | |
| H 1988 | 44.7 | 0.04: | 1830 | 133 | – | |
| He i5876Å | 1.32 | – | 374 | 127 | – | |
| O i]6300 Å | 1.34 | – | 116 | 41 | – | |
| N ii]6583Å (86) | 1.67 | – | 53 | 22 | – | |
| N ii]6583Å (88) | 2.86 | – | 62 | 22 | – | |
| Fe ii]7155Å | 1.21 | – | 153 | 45 | – | |
| Fe ii4549 Å | 2.44 | – | 198 | 85 | – | |
| Hen 1191 | ||||||
| line | FWZI | FWHM | ||||
| H | 723 | 0.62 | 1280 | 93 | 69 | |
| O i]6300Å | 124 | – | 90 | 18 | – | |
| N ii]6583Å | 2.36 | – | 93 | 24 | – | |
| Fe ii]7155Å | 39.6 | – | 85 | 19 | – | |
| Fe ii6456 Å | 22.6 | – | 136 | 17 | – | |
| HD 45677 | ||||||
| line | FWZI | FWHM | ||||
| H | 59.9 | 0.70 | 1140 | 172 | 66 | |
| H, red peak | 59.9 | 1.00 | 25 | |||
| O i]6300Å | 8.59 | 1.00 | 97 | 30 | 6 | |
| N ii]6583Å | 1.93 | – | 75 | 21 | – | |
| Fe ii]7155Å | 1.21 | – | 126 | 20 | – | |
| Fe ii6456Å | 1.34 | 1.13 | 249 | 67 | 29 | |
| HD 87643 | ||||||
| line | FWZI | FWHM | ||||
| H 1986 | 55.0 | 0.32 | 1500 | 146 | 215 | |
| H 1988 | 92.0 | 0.24 | 1520 | 108 | 184 | |
| O i]6300Å (86) | 1.92 | – | 180 | 37 | – | |
| O i]6300Å (88) | 2.43 | – | 181 | 36 | – | |
| Fe ii]7155Å | 1.65 | – | 260 | 38 | – | |
| Fe ii6456Å | 2.06 | – | 357 | 69 | – | |
| CD 5721 | ||||||
| line | FWZI | FWHM | ||||
| H | 38.3 | 0.65 | 1740 | 240 | 120 | |
| He i5876Å | – | – | – | 310 | – | |
| O i]6300Å | 2.22 | 1.04 | 141 | 46 | 12 | |
| N ii]6583Å | 1.27 | 1.0 | 69 | 26 | 6: | |
| Fe ii]4287Å | 1.48 | – | 49 | 24 | – | |
| Fe ii4549 Å | – | – | – | 11 | – | |
| CPD 2874 | ||||||
| line | FWZI | FWHM | ||||
| H | 23.2 | 0.30 | 1920 | 146 | 130 | |
| O i]6300Å | 1.18 | 1.00 | 194 | 96 | 31: | |
| N ii]6583Å | 1.19 | 1.05 | 168 | 55 | 22 | |
| Fe ii]7155Å | 1.13 | – | 278 | 120 | – | |
| Fe ii6456 Å | 1.16 | 0.88 | 322 | 175 | 99 | |
| CPD 9243 | ||||||
| line | FWZI | FWHM | ||||
| H | 15.8 | 0.08 | 1460 | 174 | – | |
| O i]6300Å | 1.30 | 0.72: | 111 | 67 | 36: | |
| Fe ii]7155Å | 1.21 | 0.75: | 119 | 65 | 39: | |
| Fe ii6456Å | 2.09 | – | – | 102 | – | |
Appendix B Heliocentric radial velocities
In Table 8 heliocentric radial velocities of the different lines are listed. For double-peaked emission lines “eb” and “er” denote the velocities of the blue and red emission components, respectively. For single-peaked emission lines “c” denotes the velocities of the center of emission. In the case of double-peaked lines “c” is the velocity of the central absorption or of the central dip between the emission peaks. For pure absorption lines it is the central velocity of the absorption feature. Velocities of absorption components are additionally flagged by the letter “a”. For type 1 profiles absorption velocities are listed in the column “eb/a”. The laboratory wavelengths used for the forbidden lines are 6300.31Å for [O i], 7155.14Å for [Fe ii], 6583.37Å for [N ii], and 6312.10Å for [S iii]. Table 9 lists the heliocentric radial velocities of the absorption components of the Na i D doublet. In some cases not all components were detectable in each of the doublet components. This is often due to saturation effects in the strong line cores.
| line | MWC 17 | MWC 84 | MWC 137 | MWC 297 | ||||||||
|---|---|---|---|---|---|---|---|---|---|---|---|---|
| eb/a | c | er | eb/a | c | er | eb/a | c | er | eb/a | c | er | |
| H | ||||||||||||
| O i]6300Å | ||||||||||||
| N ii]6583Å | ||||||||||||
| Fe ii]7155Å | ||||||||||||
| He i5876Å | a | |||||||||||
| He i5876Å(2002) | ||||||||||||
| He i6678Å | ||||||||||||
| S iii]6312Å | ||||||||||||
| MWC 300 | MWC 342 | MWC 349 | MWC 645 | |||||||||
| H | ||||||||||||
| O i]6300Å | ||||||||||||
| N ii]6583Å | ||||||||||||
| Fe ii]7155Å | ||||||||||||
| He i5876Å | a | |||||||||||
| He i6678Å | a | |||||||||||
| S iii]6312Å | ||||||||||||
| MWC 939 | MWC 1055 | Hen 230 | Hen 485 | |||||||||
| H(1986) | ||||||||||||
| H (1987) | ||||||||||||
| H (1988) | a | |||||||||||
| H (2000) | ||||||||||||
| O i]6300Å | ||||||||||||
| N ii]6583Å | ||||||||||||
| Fe ii]7155Å | ||||||||||||
| Fe ii6456Å | ||||||||||||
| He i5876Å | ||||||||||||
| Hen 1191 | HD 45677 | HD 87643 | CD | |||||||||
| H (1986) | ||||||||||||
| H (1988) | ||||||||||||
| O i]6300Å | ||||||||||||
| N ii]6583Å | ||||||||||||
| Fe ii]7155Å | ||||||||||||
| Fe ii6456Å | ac | |||||||||||
| He i5876Å | a | |||||||||||
| CPD | CPD | |||||||||||
| H | a | |||||||||||
| O i]6300Å | ||||||||||||
| N ii]6583Å | ||||||||||||
| Fe ii]7155 | ||||||||||||
| Fe ii6456Å | a | |||||||||||
| He i5876Å | a | e | a | a | ||||||||
| atwo components: / km s-1; | b[Fe ii]4287Å | cmean of Fe ii4549,4556Å; | ||||||||||
| dcentroid of asymmentric line | eadditional narrow absorption component at km s-1 | |||||||||||
| fobserved with FOCES | ||||||||||||
| MWC 17 | |||||||
|---|---|---|---|---|---|---|---|
| Na i D 1 | |||||||
| Na i D 2 | |||||||
| MWC 84 | |||||||
| Na i D 1 | |||||||
| Na i D 2 | |||||||
| MWC 137 | |||||||
| Na i D 1 | |||||||
| Na i D 2 | 1 | ||||||
| MWC 297 | |||||||
| Na i D 1 | |||||||
| Na i D 2 | |||||||
| MWC 300 | |||||||
| Na i D 1 | |||||||
| Na i D 2 | |||||||
| MWC 342 | |||||||
| Na i D 1 | |||||||
| Na i D 2 | |||||||
| MWC 349 | |||||||
| Na i D 1 | |||||||
| Na i D 2 | |||||||
| MWC 939 | |||||||
| Na i D 1 | |||||||
| Na i D 2 | |||||||
| MWC 1055 | |||||||
| Na i D 1 | |||||||
| Na i D 2 | |||||||
| MWC 485 | |||||||
| Na i D 1 | |||||||
| Na i D 2 | |||||||
| HD 87643 | |||||||
| Na i D 1 | |||||||
| Na i D 2 | |||||||
| CPD57°2874 | |||||||
| Na i D 1 | |||||||
| Na i D 2 | |||||||
| CPD52°9243 | |||||||
| Na i D 1 | |||||||
| Na i D 2 |
Appendix C Remarks on individual objects
C.1 MWC 17
The nature of MWC 17 is still unclear (classification unclB[e]), although some indications for a post-AGB evolutionary status exist according to Leibowitz (Leibowitz77 (1977)), i.e. type cPNB[e] . So far this star was only studied using low to medium resolution spectra, e.g. recently by Jaschek & Andrillat (JaschekAndrillat99 (1999)).
In the sample studied here MWC 17 it is the star with the second strongest H emission. It is nearly as strong as that of the cPNB[e] star Hen 1191. The blue peak reaches an intensity of % of the red peak (cf. Sect C.15 and Table 7). The H profile of MWC 17 is twice as broad as that of Hen 1191. The shapes profile, however, are very similar. Unlike the cPNB[e] star Hen 1191 most forbidden lines of MWC 17 show a double-peak structure. Only [Fe ii]Å is a single-peaked emission line. Furthermore, the widths (FWHM) of the forbidden lines of MWC 17 are a factor of 2-3 larger than those of Hen 1191 and are among the broadest lines in the sample.
Radial velocity measurements were published by Swings & Struve (SwingsStruve41 (1941)). They measured km s-1 for the Balmer lines for which the double peak was not resolved, and km s-1 for [Fe ii]. The latter value is in reasonable agreement with the velocity of km s-1 measured here from the coudé spectrum.
C.2 MWC 84 (= CI Cam)
In the studied sample MWC 84 is exceptional. It is the known binary system CI Cam for which recently an X-ray-to-radio flare was observed (Frontera et al. fronteraetal98 (1998), Orr et al. orretal98 (1998)). The X-ray properties of MWC 84 suggest the presence of a compact companion. Frontera et al. discuss the possibility of a neutron star, black hole and white dwarf companion.
Based on -band spectra Clark et al. (Clarketal99 (1999)) suggest the classification sgB[e]. Miroshnichenko et al. (2002b ) discussed in detail high resolution spectra observed in 2002. They find a distance of less than 3 kpc and a luminosity of . The lack of significant [O i] emission (cf. Fig. 17), casts some doubt on the classification as B[e] star. This line seems to be always present in B[e]-type stars. Despite its similarities with B[e] stars MWC 84 is therefore possibly not a typical member of this object class.
H is a very strong single-peaked emission line, Likewise, He iÅ is a strong emission line with a profile resembling closely that of H. Both lines show a bump on the red flank indicating a more complex structure (cf. also Miroshnichenko et al. 2002b ).
Na i D is also present in emission. The line of MgIÅ shows a split profile. There is some indication for a split profile also for [N ii]. The width of the weak line of [Fe ii]7155 is similar to that of [S iii], but appears narrower than [N ii].
C.3 MWC 137
MWC 137 is emdedded in the nebula S 266. In the past, this star has usually been considered to be a Herbig Ae/Be star (e.g. Finkenzeller & Mundt FinkenzellerMundt84 (1984), Thé et al. Theetal94 (1994)). Recently, Esteban & Fernandez (EstebanFernandez98 (1998)) studied high resolution spectra (resolution ) and direct narrow band images of MWC 137 and S 266. They measured a heliocentric radial velocity of km s-1 for the nebula. From this they derived a kinematical distance of about 6 kpc and concluded that MWC 137 most likely is a B[e] supergiant.
The velocity of H of km s-1 and km s-1 measured from the Calar Alto coudé of 1987 and the FOCES spectrum of 2002, respectively, is significantly higher than the nebular velocity quoted by Esteban & Fernandez. Unfortunately, they do not give the heliocentric radial velocity of the stellar component of H. Measuring the wavelength of the H peak from their Fig. 2 yields km s-1, which is also significantly smaller than the velocity measured in the Calar Alto spectrum of 1987. More observations are needed to check whether these differences are due to radial velocity variations. Interestingly, the velocity measured from the He i5876Å absorption line, km s-1 (s. Table 8), agrees remarkably well with the nebular velocity.
The absorption features of the Na i D doublet are each split into three components with heliocentric radial velocities of and +36 km s-1, corresponding to velocities with respect to the local standard of rest (LSR) of and km s-1, respectively. Comparing these velocities with the galactic rotation curve determined by Brand & Blitz (brandblitz93 (1993)) reveals that for interstellar lines LSR velocities above km s-1 should not be found along the line of sight towards MWC 137 if the distance of 6 kpc as estimated by Esteban & Fernandez is correct. However, it is not clear whether all components are of interstellar origin. The distance estimate based on the radial velocity should therefore be taken with caution.
MWC 137 appears to be spectroscopically variable. In contrast to the strong and rather broad He iÅ emission line detected by Esteban & Fernandez in the 1994 observations and in the FOCES spectrum of February 2002, the spectrum of 1987 shows a broad absorption feature. Note, however, that in 1987 He iÅ appeared in emission (Fig. 24). The heliocentric radial velocity of He iÅ in 2002 was km s-1. The P Cyg profile reported for Na i D2 by Esteban & Fernandez is not visible in the 1987 spectrum. Weak broad Na i emission was visible in February 2002.
C.4 MWC 297
MWC 297 is generally classified as a Herbig Be star (e.g. Sharpless Sharpless59 (1959), Herbig Herbig60 (1960), Finkenzeller & Mundt FinkenzellerMundt84 (1984)). For an extensive line list based on intermediate resolution spectra cf. Andrillat & Jaschek (AndrillatJaschek98 (1998)). Drew et al. (Drewetal97 (1997)) carried out a detailed analysis of this star and concluded that it is B1.5Ve zero-age main-sequence star with a rotational velocity of km s-1. Oudmaijer & Drew (OudmaijerDrew99 (1999)) obtained spectropolarimetry but could not detect intrinsic polarization from the observation of H. They suggest that the aspect angle might be close to pole-on. The spectroscopic observations presented here show very narrow forbidden lines of [O i] and [N ii] with widths of 31 km s-1 and 21 km s-1, respectively (Tab 7). Likewise, H exhibits a single emission peak. These observations in fact seem to be consistent with a near pole-on viewing angle. However, the [O i] line though being narrow shows a split profile suggesting a viewing angle somewhere between intermediate and edge-on rather than pole-on. Likewise, the high rotational velocity found by Drew et al. (Drewetal97 (1997)) is inconsistent with a pole-on viewing angle. The presence of a flat structure of the circumstellar matter around MWC 297 seen at radio wavelength (Drew et al. Drewetal97 (1997)) also suggests a more edge-on aspect angle. The question which viewing angle is correct thus still remains controversial. However, the split [O i] profile argues for a non-spherical distribution of the circumstellar envelope of MWC 297.
C.5 MWC 300
MWC 300 was considered for a long time to be a Herbig Be star (Herbig Herbig60 (1960), Finkenzeller & Mundt FinkenzellerMundt84 (1984)). Allen & Swings (AS76 (1976)) listed this object as peculiar Be star with infrared excess. Based on the analysis of high-resolution spectra Wolf & Stahl (WolfStahl85 (1985)), suggested that this star is actually a B hypergiant of spectral type B1Ia+. Here the classification as sgB[e] is adopted although the nature of MWC 300 is still controversial.
While H exhibits a double-peak type 3 profile a P Cygni profile of group 1 is found for He i5876Å. MWC 300 is the only star in the observed sample exhibiting a type 1 P Cygni profile of He i. This line shows an additional narrow blue shifted absorption component which is very likely also due to He i5876Å. Both, [O i]6300Å and [N ii]6584Å are single-peaked emission lines. The emission components of Na i D are disturbed on the blue side by the interstellar absorption components.
Winkler & Wolf (WinklerWolf89 (1989)) analyzed the emission line spectrum of MWC 300 using ESO CASPEC spectra () observed in August 1984. The radial velocities measured for the forbidden lines of [Fe ii] and [O i] of km s-1 agree well with the velocities measured from the Calar Alto coudé spectra of km s-1 and km s-1, respectively. Winkler (Winkler86 (1986)) also lists detailed velocities for the Balmer line profiles based on the same spectroscopic material. He measured km s-1 and km s-1 for the two emissson peaks and km s-1 for the central absorption of H. The central and blue peak velocities are in good agreement with the results listed in Table 8, while for the red emission peak a slight difference of 10 km s-1 might be present.
C.6 MWC 342 (= V1972 Cyg)
The status of MWC 342 is still poorly known leading to a classification of “unclB[e]”. Intermediate resolution spectra were described by Andrillat & Jaschek (AndrillatJaschek99 (1999)). Miroshnichenko & Corporon (MP99 (1999)) discussed high resolution spectra and published radial velocities for the Balmer lines H to H. Comparison with the velocity of H listed in Table 8 shows good agreement with their measurement.
Both, H and [O i] exhibit a split line profile. The velocity difference of the peaks of [O i] is only 12 km s-1 which is about a factor of 10 smaller than for H. [Fe ii] and [N ii] show single-peaked emission lines with FWHM of 25 km s-1 and 30 km s-1, respectively, whereas [O i] has a FWHM of 69 km s-1. The width of the Na i D emission lines at continuum level (FWZI) is 250 km s-1. For He i a FWZI of 440 km s-1 was measured. The forbidden lines are significantly narrower at continuum level with FWZI of the order of 100 km s-1.
C.7 MWC 349A
MWC 349A has been studied extensively during the past decades. The observations have been carried out mainly at radio wavelengths and in the infrared, but there are still only a few spectroscopic studies in the optical wavelength region, e.g. Allen & Swings (AS76 (1976)), Brugel & Wallerstein (BrugelWallerstein79 (1979)), and Hartmann et al. (Hartmannetal80 (1980)). For a recent investigation presenting a line list based on medium resolution data cf. Andrillat et al. (Andrillatetal96 (1996)). Despite the observational efforts it s still discussed controversially whether MWC 349A is a massive pre-main sequence or a post-main sequence object (type “unclB[e]” in Table 1).
Based on velocity-resolved infrared spectroscopy Hamann & Simon (HamannSimon86 (1986)) suggested a model for MWC 349A consisting of a disk and a bipolar outflow similar to the model for B[e] supergiants by Zickgraf et al. (Zickgrafetal85 (1985)). Split line profiles observed by Hamann & Simon (HamannSimon88 (1988)) in the wavelength region 7500-9300 Å with a resolution of 30 km s-1 were consistent with this model. It is also supported by the speckle observations described by Leinert (Leinert86 (1986)) and Hofmann et al. (Hofmannetal02 (2002)). In both studies a flat disk-like structure oriented perpendicular to the radio lobe found by White & Becker (WhiteBecker85 (1985)) could be resolved.
All lines observed in this work exhibit clear double-peaked profiles. The lines of the different ions show different line widths depending on excitation potential. With 130 km s-1 the line of He iÅ has the largest width (FWHM). The lines of [O i]Å and [Fe ii]Å are the narrowest with 67 and 66 km s-1 , respectively. [N ii]Å and [S iii] Å are intermediate with 120 km s-1 and 124 km s-1, respectively. MWC 349A shows the strongest [S iii] line in the sample. The line widths agree well with those given by Hamann & Simon (HamannSimon88 (1988)).
C.8 MWC 645
MWC 645 is a poorly known object which is listed as unclB[e] in Table 1. Swings & Allen (SwingsAllen73 (1973)) studied the blue spectral region of MWC 645 using 20 Å mm-1 coudé spectra observed in 1971. They found that all strong emission lines of Fe ii and [Fe ii] were double with a radial velocity difference between the stronger red and weaker blue peak of 150 km s-1. The profiles of H and H exhibited three components. Swings & Allen compared the spectrum with that of Car and found a strong resemblance even for the line profiles.
Low-resolution spectra have been investigated by Swings & Andrillat (SwingsAndrillat81 (1981)). The peculiar line profile of H shown in Fig. 1 was visible also in their data. More recently, medium resolution spectra were studied by Jaschek et al. (Jascheketal96 (1996)). They measured a heliocentric radial velocity of km s-1 from the emission lines. This is in reasonable agreement with the results listed in Table 8 when the different spectral resolutions are taken into account.
The H profile of MWC 645 is very peculiar. It consists of a broad blue and a narrow red emission component. The other objects with H profiles of type 3 exhibit blue and red components of similar witdhs. A fit of Gaussian profiles to each component yields widths of 5.0 Å and 1.3 Å (FWHM) for the blue and red component, respectively.
The profiles of all other lines of MWC 645 exhibit a characteristic asymmetry with a steep red flank and a wing on the blue side. This is not found in any other object of the sample studied here. In [O i] and [Fe ii] the central emission peaks are split by 19 km s-1 and 26 km s-1, respectively. This is much less than reported by Swings & Allen (SwingsAllen73 (1973)) and indicates spectral variability. The profile of [N ii] (observed with the lower resolution of 23 000) is not split although being well resolved with a FWHM of 64 km s-1. It exhibits a single peak, however with an asymmetric line shape like the other metal lines.
The line of He i visible in the 1995 spectrum of Jaschek et al. was absent in 1987 (cf. Fig. 24). The identification of the emission line near 6665 Å is uncertain. It could be due to a blend of Fe i lines around 6667Å.
C.9 MWC 939
MWC 939 is a little studied object of unknown evolutionary status. Until now no high-resolution spectra have been published. Based on medium resolution spectra Parthasarathy et al. (Partha00 (2000)) suggested a spectral type of B5.
All emission lines observed exhibit double-peaked profiles with the red peak being stronger than the blue peak. The velocity difference of the peaks of H is km s-1. This line shows some variability with the ratio changing between 1987 and 1988. In 2000 the ratio was nearly the same as in 1988. The velocity of the central absorption did not vary.
The metal lines have a much smaller line splitting than H of about 10-15 km s-1. [O i] appears to be split slightly more than the lines of [Fe ii] and [N ii]. The permitted line Fe ii6456Å is also split. However, contrary to the forbidden lines the blue peak is stronger than the red.
C.10 MWC 1055
Little is known about MWC 1055. In Table 1 it is entered as unclB[e]. The only spectroscopic study has been carried by Allen & Swings (AS76 (1976)) who classify the object as member of their group 1 comprising objects with an appearance similar to conventional Be stars. They found possible [O i] emission but Fe ii was absent.
The H profile is variable. In 1987 it exhibited a strong red and a very weak blue emission peak. The absorption component was weak and did not reach below the continuum. In 2000 the absorption component was much broader and the blue emission peak was even weaker. The velocity of the blue absorption edge changed from km s-1 in 1987 to km s-1 in 2000. The velocity of the red emission peak remained constant.
The coudé spectrum shows clear [O i] emission with a possible double-peak structure. In the lower resolution FOCES spectrum [Fe ii]Å is present as weak single-peaked emission line. Likewise, numerous Fe ii lines are weakly present in the FOCES spectrum. He iÅ appears in absorption. The Na i D doublet shows a P Cyg profile with red-shifted emission components and blue-shifted possibly circumstellar absorption components in addition to interstellar absorption.
C.11 HD 45677 (= FS CMa)
HD 45677 is probably the best-studied B[e] star in the Milky Way. Nevertheless, its nature is still controversial (cf. Lamers et al. Lamersetal98 (1998), Cidale et al. Cidaleetal01 (2001)).
The first detailed spectroscopic investigation was carried out by Swings (1973a ). He detected split Fe ii lines. The photospheric absorption line spectrum was analyzed by Israelian et al. (Israelianetal96 (1996)) who derived K and , consistent with the spectral type of B2V. Spectroscopic variablitity was studied by Israelian & Musaev (IsraelianMusaev97 (1997)). Short and long-term photometric and spectroscopic behaviour was studied in detail by de Winter & van den Ancker (deWinterAncker97 (1997)).
The H line of HD 45677 observed in 1988 exhibits a complex profile similar to that reported by de Winter & van den Ancker (deWinterAncker97 (1997)). Their spectra were obtained in 1993 and 1994. The line profile of 1988 shows a red emission component which is split into two subcomponents. The peak separation is 25 km s-1. Comparison with the high-resolution line profiles of de Winter & van den Ancker (deWinterAncker97 (1997)) indicates some slight long-term variability of the line profile. The ratio of the subcomponents of the main H peak changed from 1.0 in March 1988 to 0.92 in October 1993 and 0.80 in January 1994, as measured from the plots in de Winter & van den Ancker (deWinterAncker97 (1997)).
Whereas [O i]6300Å is marginally split by 6 km s-1 into two components, [Fe ii]7155Å shows only a single emission peak although the FWHM and FWZI of the latter line are larger. Likewise, [N ii] is a single-peaked emission line, however significantly narrower than [O i]. The permitted Fe ii line at 6456Å exhibits two well separated peaks with a velocity difference of 29 km s-1, similar to the subcomponents of H. Swings (1973a ) measured a similar line splitting of 32 km s-1 for the Fe ii lines.
C.12 HD 87643
HD 87643 was originally classified by Carlson & Henize (CarlsonHenize79 (1979)) as P Cygni type or nova-like star. It is now generally listed as B[e] supergiant.
HD 87643 is embeddded in a reflection nebula (Henize Henize62 (1962)) for which Surdej et al. (Surdejetal81 (1981)) found an expansion velocity of about 150 km s-1. On the other hand, a much higher outflow velocity of km s-1 measured from the P Cygni profile of H was reported by Carlson & Henize (CarlsonHenize79 (1979)). From H de Freitas Pacheco et al. (deFreitasetal82 (1982)) obtained an outflow velocity of 1200 km s-1. A recent optical study of HD 87643 was carried out by Oudmaijer et al. (Oudmaijeretal98 (1998)). They found blue edge velocities of the P Cygni profile of H of 1500-1800 km s-1 in spectra observed in 1997 with clear indication of variability on a time scale of 3 months.
The wavelength interval covered by the 1986/88 CES spectra is to small to include the broad P Cygni absorption component. It only covers the central part of the profile within a velocity range of km s-1. The comparison of this part of the line profile with the profiles displayed in Oudmaijer et al. shows that the has changed significantly from in 1986/88 to 0.55 in January 1997 and 0.8 in April 1997. From 1986 to 1988 the equivalent widths of H and of [O i]6300Å increased by about 20%.
The FWHM of the forbidden lines of [O i]6300Å and [Fe ii]7155Å are 37 km s-1 and 43 km s-1, respectively. Oudmaijer et al. (Oudmaijeretal98 (1998)) measured 40 km s-1 for [O i] in 1997, which is in good agreement with the CES spectra. The line of [Fe ii]7155Å appears slightly asymmetric. It exhibits a faint blue wing which leads to a FWZI of 260 km s-1. The FWZI of [O i] on the other hand is only 180 km s-1. Note, however, that [O i]6300Å is slightly disturbed on the blue side by Fe i(62)6297Å, which could mask a blue wing as observed in the [Fe ii] profile.
The splitting of the emission peak of H is km s-1 with some indication for an increase by 30 km s-1 from 1986 to 1988. This is mainly due to an increased blue shift of the blue emission component. Oudmaijer et al. measured a line splitting of 180 km s-1, again in good agreement with the CES spectra. The central dip of H is shifted to the blue relative to the forbidden lines by km s-1.
Oudmaijer et al. mention the possible presence of an absorption feature of He i5876Å. In the CES spectrum of 1988 this line is clearly present in absorption. Its heliocentric radial velocity is shifted to the red by 32 km s-1 relative to the forbidden lines. The permitted line of Fe ii6456Å on the other hand is shifted to the blue by 12 km s-1 relative to [O i] and [Fe ii]. Furthermore, this line and the Fe ii lines around 4550 Å exhibit blue wings.
C.13 Hen 230 (= He 2-17)
Very little is known about this object of type unclB[e]. It appeared in lists of planetary nebulae, but was recognized as “misclassified” PN by Acker et al. (Ackeretal87 (1987)).
Swings (1973b ) described spectra of this object. He detected lines of H, H, H, H, [O i]6300Å, [S ii]4068Å, a possible blend of [Fe ii] and possible He i4471Å. However, no indication of [N ii] or [O iii] lines was found. He concluded that Hen 230 resembles more a peculiar Be star than a planetary nebula.
The CES spectra show single-peaked profiles of all observed lines. With km s-1 the forbidden lines of [Fe ii] and [N ii] are very narrow, but resolved. The permitted line of Fe ii6456Å is 6 times broader than the forbidden line [Fe ii]7155Å. Furthermore, it is slightly blue shifted by km s-1 relative to the forbidden lines whereas the peak of H is red shifted by km s-1.
C.14 Hen 485 (=Wray 15-642)
First described by Allen & Swings (AS76 (1976)) this stars was classified by Allen (Allen78 (1978)) using low resolution spectra as Be!pec. He noted that it appeared to be surrounded by a low density emission nebula with high excitation. Apart from this not much is known about Hen 485. Thé et al. (Theetal94 (1994)) list it among “other Bep or B[e] stars with strong IR-excess and unknown spectral type”. It is classified “unclB[e]” in Table 1.
Hen 485 exhibits a variable H line profile. In 1988 an absorption component was visible which was absent in 1986. The heliocentric radial velocity of the blue edge in 1988 is km s-1. Adopting the mean velocity of the forbidden lines of km s-1 as systemic velocity this leads to a wind expansion velocity of 371 km s-1. The forbidden lines are single-peaked whereas the permitted line Fe ii6456Å is split into two components by 29 km s-1.
He i5876Å is a broad emission line with FWZI of 410 km s-1, centred on the velocity of the forbidden lines but with a slightly asymmetric red wing. Na i D shows emission components and possibly also a circumstellar absorption component. On the blue side of Na i5889Å an absorption feature is visible. If identified with this line the central radial velocity would be kms . The corresponding red doublet component would then be filled in by the emission of the blue doublet component explaining its absence.
C.15 Hen 1191
Le Bertre et al. (LeBertreetal89 (1989)) classified Hen 1191 as a possible proto-planetary nebula, i.e. as an object in a stage intermediate between the asymptotic giant branch and the PN stage. They detected a bipolar nebula which is even visible on the Digital Sky Survey. In Table 1 the star is therefore listed as cPNB[e].
Hen 1191 exhibits double-peaked H and very narrow emission lines. The peak separation of H is 79 km s-1. The average widths at half maximum is 19 km s-1 for [O i], [N ii] [Fe ii], and Fe ii. Note that the lines are resolved. The forbidden lines of Hen 1191 are the strongest of the sample.
Le Bertre et al. also observed a high-resolution H line profile using the same instrumentation at ESO as for the observations presented here. The spectrum was obtained in 1988 just 10 days before the one shown in Fig.1. The radial velocities measured from the H profile by Le Bertre et al. seem to differ from the results given here in this paper in Tab 8. From the wavelengths they list in their Table 3 radial velocities of km s-1 and km s-1 can be calculated, which correspond to a peak separation of 10 km s-1 only. However, this contradicts the peak separation visible in the spectrum shown in their Fig. 6a, which is consistent with a separation of km s-1, and hence is in good agreement with the line profile presented here in Fig. 1.
C.16 CD245721
The unknown evolutionary status leads to a classification of “unclB[e]” in Table 1. Allen & Swings (AS76 (1976)) detected P Cygni profiles in the Balmer lines from H to H. Furthermore, emission lines of [S ii], [Fe ii], and Fe ii were found. He i5876Å appeared in emission while He i4471Å was present in absorption.
The CES spectrum shows a double-peaked H emission line with a peak separation of 120 km s-1. Likewise, [O i] is double-peak, however with a peak separation of only 12 km s-1. [N ii] and [Fe ii] are single-peaked emission lines. Unlike any other star in the sample the permitted lines of Fe ii appear as narrow absorption lines which are unshifted relative to the forbidden lines (Fig. 22). In this respect CD245721 resembles strongly the shell-type classical Be stars. Heliocentric radial velocities of the detected absorption lines are listed in Table 10. The absorption line FWHM is 11 km s-1. Contrary to the observation by Allen & Swings (AS76 (1976)) He i5876Å is present as broad absorption line with a FWHM of 310 km s-1, indicating spectroscopic variability. It is slightly blue shifted relative to the forbidden lines.
| line | [Å] | [Å] | [km s-1] |
|---|---|---|---|
| Cr ii(31) | 4285.09 | 4284.210 | 62 |
| Fe ii(27) | 4303.95 | 4303.166 | 55 |
| Fe ii(28) | 4297.41 | 4296.567 | 52: |
| Fe ii(38) | 4550.36 | 4549.467 | 59 |
| Fe ii(37) | 4556.79 | 4555.890 | 59 |
| Cr ii(44) | 4559.54 | 4558.659 | 58 |
C.17 CPD572874 (= Wray 15-535, Hen 394)
The spectrum of CPD572874 has been described by Carlson & Henize (CarlsonHenize79 (1979)) as that of a fairly typical P Cygni star. They detected blue shifted absorption components from H through H8, but not in H. The average velocity of the Balmer emission lines is 28 km s-1, the average absorption velocity is -223 km s-1. Broad He i absorption lines at 4471Å and 3964Å were found. In He iÅ they suspected an emission component on the red side. McGregor et al. (McGregoretal88 (1988)) classified this star as B[e] supergiant.
The CES observations show a double-peaked H line with a relatively broad red emission peak. The velocity of the red peak of +22 km s-1 is in good agreement with the measurement of Carlson & Henize. The central absorption component has a velocity of km s-1, i.e. it is less blue shifted than the absorption components of the higher Balmer lines observed by Carlson & Henize. The helium line He i5876Å clearly shows the emission component suspected by Carlson & Henize. It sits on the red side of a broad absorption feature. The blue absorption component exhibits an absorption wing extending to a radial velocity of km s-1. The centre of the blue absorption component is at a velocity of km s-1.
[O i]Å has a nearly flat-topped emission profile. [Fe ii]Å exhibits a double-peaked profile slightly broader than [O i]. [N ii]Å is narrower than the two other forbidden lines, however it displays a split line profile. Likewise, the permitted line Fe iiÅ has a double-peaked structure with the central absorption blue shifted relative to the centres of the forbidden lines. The peak separation is 99 km s-1. It is the broadest (FWHM) metal line observed for CPD572874.
C.18 CPD529243
Detailed studies of the B[e] supergiant CPD529243 based on high-resolution spectra were carried out by Swings (Swings81 (1981)) and Winkler & Wolf (WinklerWolf89 (1989)). The latter detected Balmer lines exhibiting P Cygni profiles with a separation between emission and absorption components of 145 km s-1. He i lines were present only in absorption. Numerous lines of singly ionized and neutral metals were found, the stronger lines exhibiting P Cygni profiles. Many of these lines displayed double-peaked emission components with peaks at heliocentric radial velocities of km s-1 and km s-1. The only forbidden lines found were [O i]6300, 6364Å. No forbidden singly ionized iron lines were found by these authors.
The CES spectra are only partly consistent with these findings. H has a P Cygni profile similar to that shown by Winkler & Wolf. The absorption component reaches below the continuum level. Fe ii6456Å also exhibits a P Cygni profile. Its absorption component is more blue shifted by 44 km s-1 than the P Cygni absorption of H .
In addition to [O i]6300Å the line [Fe ii]7155Å is present. This is the first detection of a forbidden line other than those of [O i]. The profiles of the forbidden lines are asymmetric. However, in contrast to the findings of Winkler & Wolf no clear double-peak structure is discernible neither in the forbidden lines nor in the permitted line Fe ii6456. This is surprising, since Swings (Swings81 (1981)) noted that a doubling of the red emission component exists for most of the strong emission lines.
He i appears in absorption only. The centre of the absorption line of He i5876Å shows the same velocity as the P Cygni absorption components, i.e. it is blue shifted relative to the emission peaks. The radial velocity is km s-1. The blue edge velocity is km s-1.
Whereas the Na i D doublet in the other stars shows very likely pure interstellar absorption features, in CPD9243 a circumstellar absorption component is clearly visible. The Na i D1 line exhibits a rather broad absorption wing visible in the bluest feature of the multi-component absorption complex. The velocity of the blue edge is km s-1, i.e. close to the velocity of the blue edge of He i5876Å. The Na i D2 line seems to show a similar profile. However, the extended absorption wing is strongly disturbed by the interstellar absorption lines of the blue doublet component.
Appendix D Observed spectra
In this section the observed spectra are presented except H which is shown in Fig. 1. The wavelength section around [O i]6300Å shown in Fig. 17 additionally contains the lines of [S iii]6312Å and Mg i6318Å. The profiles of [N ii]6583Å are displayed in Fig. 18. Note that the profiles of MWC 137, MWC 342, and MWC 1055 were observed with FOCES. MWC 297 and MWC 645 were observed with the lower coudé resolution of 23 000. The spectrum in the wavelength section shown contains additionally the line of Fe ii6587Å and in the case MWC 84 of C ii6578Å. The wavelength section around the forbidden line of [Fe ii]7155Å is displayed in Fig. 19. The line of [Fe ii]7172Å belonging to the same multiplet 14F is also visible in most cases, however, heavily disturbed by strong telluric absorption features which could not be well corrected. For two stars the forbidden [Fe ii] lines at 4276, 4287Å were observed. They are shown in Fig. 20. The line profiles of the permitted Fe ii line at 6456 are displayed in Fig. 21. In addition, sections of the spectra of three stars around 4560Å containing numerous Fe ii lines are shown in Fig. 22. The lines of He i5876Å and of the Na i D doublet are shown in Fig. 23. For four stars the wavelength region around He i6678Å was observed. They are shown in Fig. 24