Abstract
This chapter provides a review of -ray sources lying at high Galactic latitudes. Their statistical properties and variability status, as well as studies involving cross correlations with lower frequency catalogs and multiwavelength observations, are summarized. The case for active galactic nuclei is analyzed with special emphasis, since they represent the largest population of high energy sources known to date. Other potential -ray emitters (including nearby starburst galaxies, normal galaxies, molecular clouds in the Galactic halo, galaxy clusters, and radio galaxies) that may appear in the next generation of -ray catalogs and, perhaps, that might have been already observed by EGRET as unidentified detections, are also discussed.
Extragalactic gamma-ray sources
Introduction
The first extragalactic -ray source ever detected was the quasar 3C273, observed by the COS-B satellite in an active state (Swanenburg et al. 1978). Since then, many Active Galactic Nuclei (AGNs) have been detected at high energies. The Third EGRET Catalog (3EG) lists several tens of sources labelled as AGNs at various levels of confidence (Hartman et al. 1999), and there are 120 unidentified detections above . This chapter provides a discussion on these sources, the level of confidence with which it is known that AGNs have been detected, the physical mechanisms by which -rays are emitted from active nuclei, and several related problems.
1 Low-, mid-, and high-latitude sources
Gehrels et al. (2000) presented an analysis of the 3EG sources classified as steady, i.e. those sources having the most significant catalog detection both during a timescale of years (as opposed to those having the most significant detection in one single viewing period), and within 3 of the flux calculated using the full data set. The objective in cutting the sample with this criterion is to get rid of those sources that are most likely flaring and thus, perhaps, AGNs.
Plotting the flux of each unidentified source as a function of their Galactic latitude, a distinction between bright sources at low latitudes () and weak sources at mid latitudes () appears. This is supported by a – plot (see Gehrels et al. 2000), which shows how different these two samples are. The distinction is also supported by the different average photon spectral index (which is 2.180.04 for low-latitude sources, compared to 2.400.04 for mid-latitude sources).
There is unambiguous evidence for the existence of a population of -ray sources at mid latitudes which is a) fainter, b) softer, and c) has a steeper – distribution than sources located at lower Galactic heights. The origin of such a population has been connected with the Gould Belt (e.g., Grenier 1995, 2000, Grenier & Perrot 2001). The Gould Belt, comprising massive and late type stars, molecular clouds, and expanding interstellar medium, and located asymmetrically across the sky, tilted across the Galactic plane, 100–400 pc away from Earth, could provide a natural scenario for several of the weak sources detected. The Belt has an enhanced supernova rate, 3 to 5 times higher than the Galactic value, and the remnants (both diffuse and compact) of these explosions could constitute the origin of the -ray emission (see Grenier 2000).
– plots are very useful in exploring features of high-latitude sources too, and in particular, in comparing the high-latitude unidentified source distribution with that of AGNs. The first such attempt was made by Özel and Thompson (1996), who found that the difference between unidentified and AGN-labelled – distributions could be understood in terms of the superposition of an isotropic (extragalactic) and a Galactic population of sources. Reimer & Thompson (2001), using the 3EG compilation, noticed that care should be taken in distinguishing between the – plots using the peak and the average flux of each detection. AGNs extend to higher flux levels compared to unidentified sources at high galactic latitudes and the contrast between the average and the peak flux distributions is even more pronounced for unidentified sources. The latter happens because sources at high latitude are preferentially identified by their peak flux only, in some cases rendering the average flux distribution meaningless. The similarity between the peak-flux distribution for unidentified high-latitude sources and AGNs might support the case for the latter being the counterparts of all unidentified -ray sources. However, as for low Galactic latitudes, although trends are indicative, a case-by-case analysis is the only way to judge this fairly.
2 The case for AGNs
2.1 Definitions
Blazars are AGNs with a) strong flat spectrum radio emission [the power law index , with ] and/or b) significant optical polarization, and/or c) significant flux variability in the optical and in other wavelengths. When the optical variability occurs on short timescales, the objects are referred to as optically violently variable –OVV– quasars. The blazar classification also includes BL Lacertae (BL Lac) objects, which present a complete or nearly complete lack of emission lines, and highly polarized quasars (HPQs). It also refers, sometimes, to flat spectrum radio quasars (FSRQs), although these are generally more distant, more luminous, and have stronger emission lines.
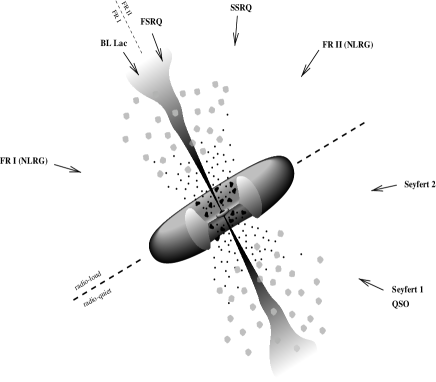
Within the unification model, the underlying scenario for all AGNs is intrinsically similar. At the very center of the galaxy there is a supermassive black hole (106 to 10M⊙) which accretes galactic matter forming an accretion disk. Broad emission lines are produced in clouds orbiting above the disc at high velocity (the Broad Line Region, BLR), and this central region is surrounded by an extended, dusty, molecular torus. A hot electron corona populates the inner region, probably generating continuum X-ray emission. Narrower emission lines are produced in clouds moving much farther from the central black hole. Two-sided jets of relativistic particles emanate perpendicular to the plane of the accretion disc, the generation of which is still not fully understood. Unification of different AGN classes is achieved taken into account the intrinsic anisotropy of the phenomenon, as shown in Fig. 1 (see Urry & Padovani 1995 and Padovani 1997, for a detailed discussion).
2.2 Gamma-ray emission from blazars
The fact that some -ray blazars have been observed to flare dramatically on timescales of days imposes severe constraints on the size of the emitting region. A direct constraint can be put on the compactness of the source considering that the optical depth for attenuation is (e.g., Schlickeiser 1996):
| (1) |
where is the Thomson cross section, is the -ray photon density, is the source size inferred from the intrinsic variability timescale and simple light-travel arguments, is the mean photon energy, and is the compactness parameter defined as the ratio of the intrinsic source luminosity to its radius. Considering a mean photon energy of 1 MeV, and (see below) luminosities of erg s-1, the optical depth can be scaled as . For fiducial values, the source is opaque to the escape of -ray photons, contrary to the observed fact that -ray blazars present a power-law spectrum over several decades of energy (see below).
On the contrary, if the emission is beamed, special relativistic effects have to be taken into account. These enter basically through one quantity, the Doppler factor, where, as usual, is the velocity of the jet in units of the speed of light, is the angle between the jet and the line of sight, and is the bulk Lorentz factor . The Doppler factor regulates the value of the observed luminosity (with –4, Begelman et al. 1984), the blueshift of the observed frequency , and the time dilation of events . Naively, note that when , fast jets get Doppler boosted by a large factor, biasing the detections to closely aligned blazars. Doppler boosting then makes the compactness factor , which is then reduced significantly, such that the optical depth become less than 1.
The Elliot-Shapiro (1974) relation is a similar argument against isotropic emission of -rays in the rest frame. For spherical accretion onto a black hole, the source luminosity is limited by the Eddington luminosity where the mass of the black hole is given in solar units and is a correction factor accounting for the difference between Klein-Nishima and Thomson cross sections (e.g., Dermer and Gehrels 1995, Pohl et al. 1995). If the center of the blazar is a black hole, the central source has to be larger than the Schwarzschild radius, implying M s. Using the latter two equations, the relation , or, equivalently,
| (2) |
which, for strictly equal to 1 is known as the Elliot-Shapiro relation, holds. This inequality is violated for the most rapidly varying AGNs detected by EGRET. However, this effect, too, is alleviated if the radiation is beamed, since the reduction in the compactness parameter similarly applies here.
In addition, the redshift distribution of detected EGRET sources (blazars with are part of the sample, see below) shows that the source distance is not a critical parameter for detection. The combination of high luminosity, redshift distribution, short-term variability, and —as it is shown below— superluminal motion observed in blazars, all support the argument for relativistic beaming in these objects.
2.3 Models for -ray emission from blazars
Whereas it is generally accepted that blazar emission originates in relativistic jets, both their nature and the main radiation mechanism responsible for the observed radiation is still under debate. If protons are responsible for the radiation, photo-pair and photo-pion production, followed by decay and synchrotron emission by secondary particles (e.g., see Mannheim 1993) would be the main mechanisms by which this radiation is emitted. If electrons and positrons are the main constituents of the jets, instead, they would produce -rays in inverse Compton scattering interactions with the various seed photon fields traversed by the jet (e.g Marscher & Gear 1985, Dermer et al. 1992, Sikora et al. 1994, Böttcher et al. 1997). Rachen (1999) and Böttcher (1999) respectively provide focused reviews on each of these two possibilities. Both scenarios have to explain the broadband spectra of blazars, consisting of two components. The first one extends, in the case of flat-spectrum radio quasars (FSRQs) from radio to optical/UV frequencies, and in the case of high frequency peaked BL Lacs (HBLs) up to soft and even hard X-rays. The second spectral component appears at -ray energies and peaks at several MeV to a few GeV in most quasars, or at TeV energies in some extreme cases. As an example, the spectral energy distribution of the blazar 3C 279 is shown, for different observation epochs, in Fig. 2 (left panel). It illustrates these general features showing a) strong flux variability, b) strong spectral variability, especially when flaring, and c) the dominance of the -ray emission over all other wavelengths.


Leptonic jet models explain the radio to UV continuum as synchrotron radiation from high energy electrons in a relativistically outflowing jet (e.g., Blandford & Königl 1979). The emission in the MeV-GeV range is believed to be inverse Compton scattering of low energy photons by the same relativistic electrons in the jet. Possible target photon fields for inverse Compton scattering are the synchrotron photons produced within the jet (the SSC or Self-Synchrotron Compton process, Marscher & Gear 1985, Maraschi et al. 1992, Bloom et al. 1996), the UV/soft X-ray emission from the disk, either entering the jet directly (the ECD or External Comptonization of Direct disk radiation process, Dermer et al. 1992, Dermer & Schlickeiser 1993) or after reprocessing at the broad-line regions or other circumnuclear material (the ECC or External Comptonization of radiation from Clouds, Sikora et al. 1994, Dermer et al. 1997, Blandford and Levinson 1995), or jet synchrotron radiation reflected at the broad-line regions (the RS or Reflected Synchrotron mechanism, Ghisellini & Madau 1996, Böttcher & Bednarek 1998, Bednarek 1998).
In the SSC process, the relativistic electrons move along the magnetized jet, generating synchrotron photons with frequency , where is the magnetic field strength and is the energy of the particles. These photons are upscattered in energy by the same population of electrons that emitted them, to frequencies . To first order, the shape of the IC spectrum will follow the synchrotron spectrum, which naturally explains the spectral turnover in the MeV band, seen in many blazars.
The same turnover in the spectrum is explained as an integrated-in-time Compton cooling of the electrons in those models involving external Compton scattering (EC). The idea is that when a blob of relativistic electrons is injected into the jet, and generates an IC spectrum, the high-energy cutoff in that spectrum (corresponding to the high-energy cutoff of the electron spectrum) will move towards lower energy as time goes on (higher energy particles cool first). Integrating the individual spectra over time generates the spectral turnover at MeV energies (see, e.g., Hartman et al. 2001 for details on the implementation of the time average in an individual situation).
Both SSC and EC processes actually occur at the same time, and their relative importance will depend on the different energy densities of the target fields. This is the case, for instance, of PKS 0528+134, which was observed by EGRET from 1991 to 1997 (Mukherjee et al. 1999) and 3C 279, which has simultaneous optical and X-ray coverage (Hartman et al. 2001, see Fig. 2, right panel). These results show that for high -ray states, when the ratio between the power of the -ray and low energy spectral components increased, the bulk Lorentz factor of the jet increases and the BLR emission Comptonized in the jet dominates the high-energy spectrum. The SSC mechanism seems to play a larger role if the blazars are in a low flux state, whereas for very low activity, even the thermal emission from the disc may be apparent (see the spectral energy distribution time interval P2 in Hartman et al. 2001, and Pian et al. 1999).
In general, the broadband spectra of HBLs are consistent with pure SSC models (e.g., Mastiachidis & Kirk 1997, Pian et al. 1998, Petry et al. 1999), whereas for FSRQs, a strong contribution of radiation external to the jet is necessary to reproduce the observed spectra. Low-frequency peaked BL Lacs, like BL Lacertae itself, or W Comae (e.g., Böttcher et al. 2002), are expected to be intermediate cases between radio quasars and HBLs. Ghissellini et al. (1998) studied this phenomenology analyzing the spectrum of 51 -ray loud quasars for which sufficient data (non-simultaneous in most cases) were available. They considered SSC and SSC + EC models and found that there is a well defined sequence in the properties of HBLs, LBLs, and FSRQs, with increasing importance of the external radiation field, supporting a physical (in addition to a geometrical) foundation for the unification of all quasars.
A different flavor of models, so-called hadronic, assume that the observed -ray emission is initiated by accelerated protons interacting with either ambient gas or lower frequency radiation. In the proton induced cascade (PIC) model (e.g., Mannheim & Biermann 1992, Mannheim 1993, Mannheim 1996), the relativistic protons interact electromagnetically and hadronically by producing secondary pairs (or mesons which eventually decay into pairs), photons, and neutrinos. The observed -radiation is related to the development of pair cascades in the jet. The efficiency of this model increases with the energy of the accelerated protons, usually requiring . The synchrotron radiation of protons becomes a very effective channel of production of high energy -rays at such energies. Aharonian (2000), Protheroe & Mücke (2000), and Mücke & Protheroe (2000) have shown that for a reasonable set of parameters characterizing the small-scale (sub-parsec) jets in Mrk 421 and Mrk 501, the synchrotron radiation of extremely high energy protons not only may dominate over other possible radiative and non-radiative losses, but also could provide adequate fits to the observed TeV spectra of both objects. This hypothesis could help to explain the essentially stable spectral shape of Mrk 501, despite spectacular variations of the TeV flux on sub-day timescales.
The problem some hadronic models confront when attempting to explain TeV flares in blazars is that they require extremely high luminosities in high energy protons. For instance, for , the density of the thermal plasma in the jet exceed in order to explain the reported TeV flares of Mrk 501 by -decay -rays produced by - interactions (Aharonian 2000). However, alternative hadronic models assume -ray production in interactions from the collision of jets with surrounding gas clouds (e.g., Dar & Laor 1997, Beall & Bednarek 1999, Purmohammad & Samimi 2001). Due to the enhanced density in the cloud, interactions can dominate the process, contrary to the case of the PIC cascade models where interactions in the jet are reduced significantly by the lower jet density. Bednarek & Protheroe (1997) proposed that another possible target for the jet could be the wind of an OB star moving through the jet. Protons have also been suggested as responsible only for the injection of energetic electrons, which in turn produce the observed -ray emission by SSC mechanism (Kazanas & Mastiachidis 1999).
Correlations of the flux variability at different wavelengths and on different timescales has been considered as a way to decide between models. Variability at the highest energies (TeV) ranges from less than 1 hr (flare on 1996 May 15 of Mrk 421) to long high states lasting several months (Mrk 501 in 1997); see Aharonian (1999) and Catanese & Weekes (1999) for reviews. Multi-wavelength campaigns revealed that the TeV flares of both, Mrk 501 (see, e.g., Pian et al. 1998; Catanese et al. 1997; Aharonian et al. 2001; Sambruna et al. 2000) and Mrk 421 (see, e.g., Buckley et al. 1996; Maraschi et al. 1999; Takahashi et al. 1999, also Rebillot et al. 2003) were correlated with X-ray emission. This fact appears to favor the synchrotron Compton jet emission models, in which the same population of relativistic electrons is responsible for the production of both X-rays and TeV -rays. However, hadronic models were also shown to be able to reproduce such correlations as well (see, e.g., Rachen 1999).
Strictly from a ‘fitting perspective’, simultaneous multiwavelength observations of blazars provide enough elements to distinguish between leptonic and hadronic models. Such is the case of W Comae (Böttcher et al. 2002) for which the best currently available contemporaneous optical-to-X-ray spectrum shows clear evidence for the onset of the high-energy emission component beyond keV. This translates into an accurate indication of the level of hard X-ray SSC emission in the framework of leptonic models. Böttcher et al. (2002) found that all acceptable leptonic fits to the optical-to-X-ray emission of W Comae predict a cutoff of the high-energy emission around 100 GeV. The synchrotron-proton blazar model, when fitted to the same data, predicts similar fluxes at 40 GeV but noticeable greater fluxes above 100 GeV, at levels reachable by ground-based telescopes. This contrast may then be used as a diagnostic of the main emission mechanism.
One unambiguous signature of a hadronic production of -rays is the concurrent emission of neutrinos. Charge pion decay, as opposed to neutral pions, will unavoidably produce energetic neutrinos. The detection of a strong neutrino flux —in the next generation km2 neutrino telescopes— from blazar jets would identify hadrons as the primary accelerated particles (e.g., Nellen et al. 1993, Bednarek & Protheroe 1999, Stecker et al. 1996, Schuster et al. 2001).
Independently of how the -rays are produced, they must traverse the strong X-ray field produced in the innermost region of the accretion disk. The observed -ray photons cannot originate from too small a radius, otherwise they would be absorbed through pair creation in the disk photosphere (e.g., Blandford & Levinson 1995). This naturally leads to the concept of -spheres in AGNs: for each -ray photon energy there is a radius beyond which the pair production opacity to infinity equals unity. The size of the -sphere depends on both the energy of the -ray photons and the soft photon flux, as further discussed below.
3 EGRET Observations of AGNs
The 3EG catalog distinguishes with an ‘A’ those detections classified as ‘high confidence AGNs’ and with an ‘a’ those which are considered lower confidence identifications. A-AGNs were found within the 95% confidence location contours, and present a 5 GHz radio flux in excess of 1 Jy together with a radio spectral index generally above . The ‘a’ class is more vaguely defined: they are near, but outside, the 95% confidence contour and the candidate counterpart has a lower radio flux. A description of the main features of presumed EGRET AGNs follows. See von Montigny et al. (1995a) and Mukherjee et al. (1997) for further details.
Power: The -ray luminosity often dominates the bolometric power of the blazar.
Redshift and Spectra: The redshifts of 3EG catalog blazars range from 0.03 to 2.28. Mukherjee et al. (1997) have noticed that there are marginal (less than 2.5) indications suggesting that BL Lacs have slightly harder spectrum in the EGRET energy range than FSRQs. Also, for some individual blazars, a trend for the spectrum to harden during a flare (e.g., in blazars PKS 1222+216, 1633+382, and 0528+134, Sreekumar et al. 1996, Mukherjee et al. 1996) has been noted.
Luminosity: Given the redshift, the -ray luminosity can be estimated by considering the relationship between the observed differential energy flux and the power emitted in
| (3) |
where with in the Friedman universe, (70 km s-1 Mpc-1) is the Hubble parameter, (0.5) is the deceleration parameter today, is the redshift, and is the beaming factor (Mukherjee et al. 1997). Luminosities larger than 1045 erg s-1 are typically deduced.
Variability: It is not uncommon, as discussed above, for EGRET blazars to be detected by their peak flux. Therefore, flux variations can span more than one order of magnitude between different observations. PKS 1622297 (Mattox et al. 1997b), for instance, had a doubling time, i.e. the times during which the source flux doubled, of less than 3.8 hr. For 3C 279 (Wehrle et al. 1998), the doubling time was hr. Wallace et al. (2000) presented a systematic search for short-term variability (sensitive to variations in 1 to 2 days); six 3EG catalog sources were found to exhibit variability in this study (PKS 0528+134, 3C 66A, and four other unidentified detections).
3.1 Comparison of properties of AGNs and unidentified EGRET sources at high latitudes
Fig. 3 shows the distribution of the -ray photon spectral index for 45 unidentified EGRET sources above and the 66 3EG catalog AGNs. The mean value of the photon index is 2.360.36 for AGNs and 2.490.34 for the unidentified detections. These are compatible within the uncertainties and, on average, steeper than what is observed for low-latitude sources.
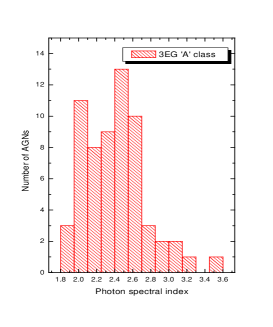
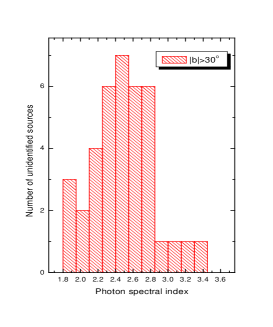
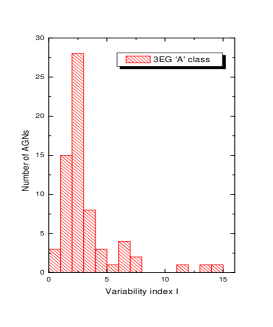
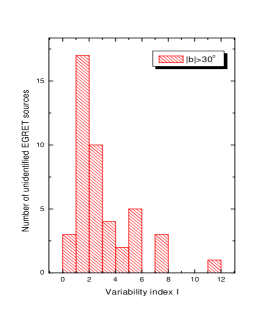
Fig. 3 also shows the variability distributions, under the -index (Torres et al. 2001a) —use of Tompkins’ (1999) index (see also Nolan et al. 2003) would provide statistically correlated results (see Torres et al. 2001b). The mean value for AGNs (lower left panel) is 3.32.6. A peak in the plot is seen at , which represents a value above that shown by pulsars. Clearly, most of the AGNs are likely variable sources. The mean for the unidentified sources is also high: 3.02.3. When considered separately, BL LACs seem to be less variable than quasars, a trend first noticed by Mukherjee et al. (1997) –see also Nolan et al. 2003.
There is no clear dependence of the variability of the sources with latitude. However, an apparent trend of increasing the variability status for the sources with the steepest spectra is found (Torres et al. 2001a-b, Reimer 2001). Nevertheless, the latter is not yet conclusive: results for a Spearman Rank test are in the range of a few percent for this to be a random phenomenon. Both samples look quite similar, with no apparent deviation from one other in their variability or photon spectral index distributions.
No correlations appear either considering the flux, i.e. vs. or vs. , but there is a clear contrast on the flux values: whereas most 3EG catalog -ray AGNs have average fluxes above photons cm-2 s-1, most of the unidentified sources have lower values.
3.2 The multiwavelength approach for the identification of EGRET blazars
3EG catalog AGNs were largely selected from the Green Bank 4.85 and 1.4 GHz single dish surveys (Condon et al. 1991, White & Becker 1992) and the 4.85 GHz Parkes-MIT-NRAO (PMN, Griffith and Wright 1993) for the southern sky. Both surveys have a threshold flux density of mJy and a position uncertainty of , and both are confusion-limited within 3 degrees of the Galactic plane. The use of 5 GHz to establish potential counterparts has no special physical meaning, rather it is used because of the existence of a complete survey. The -ray/radio correlation was discussed by several authors (both in fluxes and luminosities, e.g., Padovani et al. 1993, Stecker et al. 1993, Salamon & Stecker 1994, Dondi & Ghisselini 1995, Stecker & Salamon 1996, Mücke et al. 1997, Zhang et al. 2001, and Cheng et al. 2000). Mattox et al. (1997) noted that, at least, all EGRET blazars with peak -ray flux above photons cm-2 s-1 were bright ( Jy) radio sources. For dimmer ( mJy) radio sources, the search for associations is more difficult (e.g., Wallace et al. 2002, Mirabal et al. 2000, Halpern et al. 2003, Sowards-Emmerd et al. 2003). Should the radio/-ray correlation be non-linear, but present a trend toward low MeV] with increasing -ray flux, then the identifications of Mattox et al. (1997) must necessarily be incomplete, since they would be lacking the low end in radio flux. 3EG J0743+5447, with mJy, is representative of a small group of EGRET blazars that are dim and flat at 5 GHz but have been found to have brighter and flatter spectra extending beyond 200 GHz (Bloom et al. 1997). 3EG J20062321, recently identified with PMN J20052310, a flat-spectrum radio quasar with a 5 GHz flux density of 260 mJy, may be another source of this type (Wallace et al. 2002).
Mattox et al. (2001) searched for potential radio counterparts to all sources listed in the 3EG, allowing for sources (up to the extent of their catalogs) with arbitrarily low . They list 46 blazar identifications with a ‘high probability’ of being correct, and 37 additional ‘plausible’ radio associations (including 15 unidentified sources, none at high latitudes). As noted by Wallace et al. (2002), the fact that there is no unidentified -ray source at high latitude at least plausibly associated with a blazar under this identification method seems to indicate it might lack identification power. However, four ‘high-probability’ blazars were reported with Jy.
Sowards-Emmerd et al. (2003) additionally used the 3.5 cm CLASS survey (Myers et al. 2002) to search for counterparts. The CLASS survey targeted compact gravitational lens candidates, preselecting flat spectrum sources by comparing the NVSS (21 cm) and Green Bank (6 cm) fluxes. CLASS observed sources lying at DEC and , and having spectral index () and resolved structure up to sub-arcsecond scales. Such resolution showed that some flat sources were actually produced by extended high frequency emission. Sowards-Emmerd et al. introduced a new figure of merit to evaluate the plausibility of counterparts defined as Each -value computes the over-density of sources near high-latitude () -ray detections in bins of radio flux, spectral index, and X-ray flux, respectively. The last factor corresponds to the source position weighting, given by the value of the -ray likelihood at the radio source position, extracted from EGRET maps. Sources with FoM are designated as ‘likely’ counterparts and those having are considered ‘plausible’ counterparts. Out of 116 Northern 3EG catalog sources (excluding the Solar flare), 66 have at least one plausible blazar-like radio counterpart within this new scheme. Noteworthy, this method proposes 50% more high-confidence classifications than Mattox et al. (2001), with nearly twice maximum redshift. Several identifications are proposed with low (well below 1 Jy) radio fluxes.
If the latter identification scheme proves to be valid, some of the population studies using both the sample of A-AGN out of the 3EG catalog and the 46 high-confidence AGNs of Mattox et al. (2001) could have serious problems. Nevertheless, it is expected that multiwavelength correlations using these samples can still be useful to guide the forthcoming research (see, e.g., Cheng et al. 2000, and Mei et al. 2002).
Bloom et al. (1997) noted that blazars thought to have been detected by EGRET often have flatter spectra from 5 to 22 GHz than blazars that were not. Higher radio frequency observations (90 and 230 GHz) of 12 southern AGNs classified as possible EGRET identifications were made by Tornikokski et al. (2002). They found that several are blazars, and confirmed that the AGN identifications in the 3EG catalog are objects that are bright and variable in the mm domain, having a flat spectrum up to 100 GHz. Optical microvariability (Romero et al. 2002) was searched for a sample of 20 southern EGRET AGNs, and timescales of variation of the order of several hours were found. These results place some doubt on earlier claims (e.g., Dai et al. 2001) on the existence of tens-of-minutes optical variability timescales.
von Montigny et al. (1995a), among other authors, reported that EGRET tended to detect superluminal radio sources. Recently, Jorstad et al. (2001a) completed an extensive VLBA monitoring program of 42 presumed -ray bright blazars, finding apparent superluminal jet velocities in 33 sources.111Earlier studies on superluminal blazars that were not detected by EGRET were reported by von Montigny et al. (1995b). Jorstad et al. (2001b) concluded, from the relative timing of superluminal ejections and -ray flares, that superluminal phenomena and -ray flares are correlated. The population of bright -ray blazars detected by EGRET can therefore be categorized as highly superluminal, with apparent speeds as high as (for a Hubble constant of 65 km s-1 Mpc-1); the peak of the distribution being at 8–9 h, significantly higher than the average speed of jet components in the general population of strong compact radio sources.
The COMPTEL experiment (0.75–30 MeV) detected 11 AGNs: 9 FSRQs, 1 BL Lac (Mrk 421), and the radio galaxy Centaurus A (see e.g., Schönfelder et al. 2000, Collmar 2002). Upper limits were obtained for several tens of presumed EGRET AGNs and unidentified high-latitude EGRET detections. COMPTEL detected also a handful of unidentified high-latitude -ray sources itself. COMPTEL AGNs were often visible during flaring episodes that were simultaneously detected by EGRET, and many, at threshold level in at least one channel, limiting the knowledge of their spectra. For those observations that admitted a spectral fit, power-laws with slopes 2 were found. When a simultaneous flaring detection in EGRET was observed, COMPTEL usually saw a hardened spectrum, showing that the upper end of the COMPTEL band was being affected by the EGRET-detected phenomenon. COMPTEL also detected MeV-variability of AGNs. The shortest timescale was seen for 3C279 (the most observed COMPTEL AGN), whose flux changed by a factor of within a period of 10 days correlated with the large EGRET flare of early 1996 (Collmar et al. 1997). In any case, no COMPTEL AGN was detected in all corresponding pointings, implying, too, time variation in their MeV emission. COMPTEL (together with OSSE and EGRET) data have shown that there is a spectral turnover in the MeV band, e.g., that is clearly seen in the already commented cases of PKS 0528+134 and 3C279, for which it was shown that the luminosity across the electromagnetic spectrum peaks near the COMPTEL band.
Of special interest to the INTEGRAL mission are the MeV blazars (AGNs that are exceptionally bright at MeV energies and do not present significant emission in the GeV band). The first detection of a MeV blazar was found by COMPTEL (GRO J0516609, Bloemen et al. 1995) and quickly, other such object was reported (PKS 0208512, Blom et al. 1995). Different theoretical models to explain these objects are discussed by Bednarek (1999), see also Romero (1996).
At higher energies, the class of EGRET blazars has been thoroughly observed by Čerenkov telescopes, but only a few have been detected (including the already mentioned Mkn 421, Mkn 501, PKS 2155-304). Mrk 421 constituted the first detection of -ray emission from a BL Lac object (Lin et al. 1992). Mkn 501, instead, was initially not an EGRET source, but by raising the energy threshold and looking for flares, Kataoka et al. (1999) were able to report its detection. A power-law fit to the EGRET data suggested a spectral index of for Mrk 501; the hardest known blazar spectrum at GeV energies. EGRET spectra extrapolation down to TeV-energies are, however, consistent with non-detection by current Čerenkov telescopes.
3.3 Are all unidentified high-latitude -ray sources AGNs?
Whichever the classification scheme adopted to identify EGRET sources at high-latitudes, they fail to associate all unidentified detections with AGNs. For instance, out of Mattox et al.’s (2001) sample, only one source not classified by Hartman et al. (1999) as A-AGNs was suggested as a high confidence AGN, leaving all unidentified sources out of this category. In the work by Sowards-Emmerd et al. (2003), the technique used also selects individual sources that are most likely non-blazars: 28 previously unidentified sources are so selected, some of which are located at high latitudes.
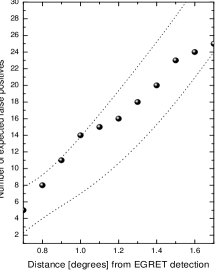
Furthermore, some of the associated AGNs are probably false positives (i.e. AGNs that are mis-associated with EGRET sources by failure of the statistical methods used in the classification). This fact is particularly important for statistical methods based only on the relative positions between the candidate and the EGRET source center. If the confidence contours have any significance at all, a source should appear beyond the 95% contour only a few percent of the time (Punsly 1997). Working with 114 sources above , Punsly have estimated the number of random coincidences as a function of the field radius: (10) quasars with more than 1 Jy of 5 GHz flux are expected to correlate by random chance if the size of the typical EGRET angular uncertainty is 0.7o (1.7o). This sheds some doubt on several of the ‘plausible’ correlations that occur beyond the 95% location contours of EGRET sources, which are associated only by position (see Fig. 4, left panel). The significance of the Sowards-Emmers’ et al. (2003) FoM statistic is evaluated by shifting the radio sources positions, allowing for an average FoM distribution to be computed and compared with the true sources result. Fig. 4 (right panel) shows these results. The hashed region (right scale) shows the range for the estimate of the fraction of sources in a given FoM bin that are in excess of random counts. The number of false positives using the FoM statistics is expected to be low: of the 35 likely sources so selected, less than 3 false positives are expected, whereas out of the 32 plausible sources, the number of false positives is expected to be less than 6. In any case, any number of false positives implies that different physical interpretation for the origin of some EGRET sources lying at high latitude should be sought.

The evolution and luminosity function of the EGRET blazars was used to estimate the contribution of similar unresolved objects to the diffuse extragalactic background (Chiang & Mukherjee 1998). It was found that no more than % of the extragalactic background can be ascribed to unresolved sources with jets close to the line of sight. Additionally, only –40% of the diffuse extragalactic emission can be attributed to unresolved -ray emitting BL LACs or FSQRs located up to (Mücke & Pohl 2000). Even integrating up to , unresolved AGNs underproduce the intensity of the extragalactic -ray background, probably by more than 20%. Previous results (e.g., Stecker & Salamon 1996) assumed a linear correlation between the measured radio and -ray fluxes and obtained a much larger contribution to the -ray background. However, this correlation is at least a noisy one, as discussed above.
In a sense, the search for origins of -ray sources at high latitudes, other than AGNs, mirrors the efforts to distinguish the origin of those low-latitude Galactic sources that display transient behavior but which cannot be associated with radio quasars. Examples of those are 3EG J1837-0606 (Tavani et al 1997) and 3EG J0241+6103 (Kniffen et al. 1997, Tavani et al. 1998). Whatever objects these are (e.g., Romero et al. 1999, 2001, 2003, Kaufman-Bernadó et al. 2002, Paredes et al. 2000, Punsly et al. 2001), perhaps some of them could also be found at high Galactic latitudes.
4 Microlensing of -ray blazars
Notwithstanding the discussion of the previous section, AGNs could also be related to some of the -ray detections by the enhancement of the radiation they produce in an event extrinsic to the source itself: in a microlensing event (see Combi and Romero 1998, Torres et al. 2002a, 2003a).
Gravitational light deflection is an achromatic phenomenon: i.e. the deflection angle does not depend on the energy of the photon. However, it is nevertheless possible to have chromaticity effects when the size of the source is dependent on wavelength. It was mentioned before that the size of the -spheres depends on both the energy of the -ray photons and the soft photon flux. For an isotropic, power-law, central source of soft photons scattered by free electrons, Blandford & Levinson (1995) obtain: with depending on the details of the central source, typically: –2.
The parameters that describe a microlensing scenario are the dimensionless surface mass density and the external shear (e.g., Kayser et al. 1986; Schneider & Weiss 1987). In ray-shooting simulations (Wambsganss 1999), a large number of light rays (of order ) are followed backwards, from the observer to the distant source plane, through the field of point lenses.222The minimal number of lenses that have to be considered depends on the focusing and shear values, as well as on the ratio between the diffuse and the total flux. The diffuse flux () is that coming from rays that are deflected into the receiving area from stars far outside the region where microlenses are considered, and should be consistently low. An approximated expression for the number of lenses to be included in each magnification map is (Wambsganss 1999): which entails values from several hundreds (for ) up to several hundred thousands (for ) stars, in the case of zero shear and . In the lens plane, the deflections from individual lenses are then superposed for each ray and these are then followed to the source plane. There, they are collected in small pixels. The number of rays per pixel (on average for a region typically of pixels) is proportional to the magnification at that position. A two-dimensional map of the ray density —a magnification or caustic pattern— is then produced. Sharp lines correspond to locations of very high magnification, i.e. the caustics. Source, lens, and observer are moving relative to each other; this produces a variable magnification as a function of time. When a source crosses a caustic, formally two very bright new (micro) images appear or disappear. However, their angular separation is much smaller than the resolution of any telescope and only the combined total brightness is measured, producing dramatic jumps in the observed flux.
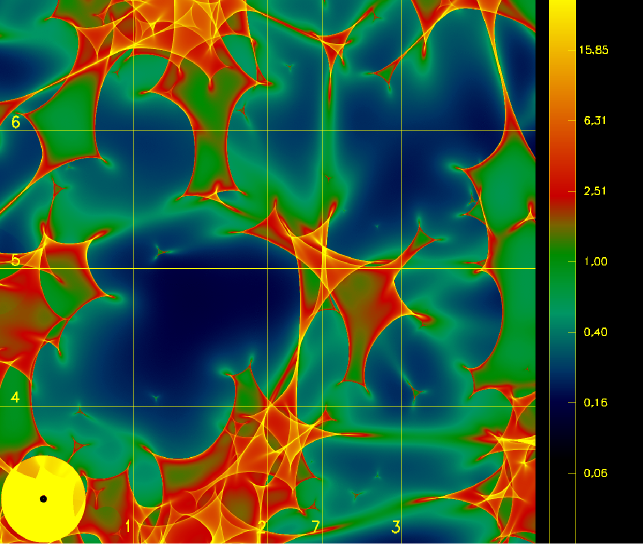
The magnification map for the case and is shown in Fig. 5. The -spheres will be affected according to their size while moving in the caustic pattern.
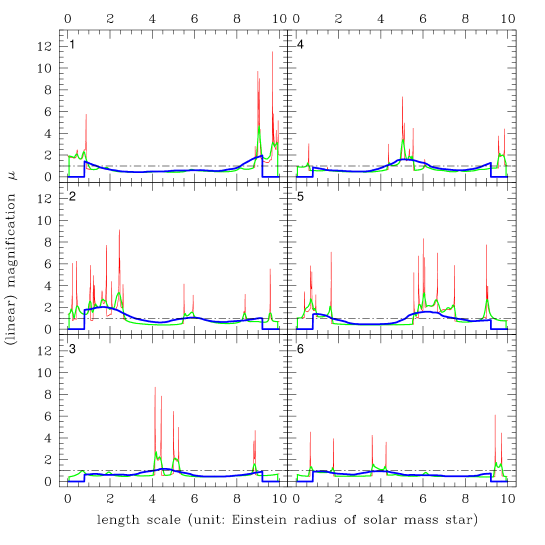
The numbered lines in Fig. 5 represent arbitrary source trajectories, the resulting light curves are given in Fig. 6. There is a typical factor of 10 more magnification for the innermost regions than for the larger -spheres (for different examples with other values of and , see Torres et al. 2003a). The maximum possible magnification () that this caustic pattern can produce is shown by an extra trajectory that crosses exactly over a conglomerate of several caustics (#7). Concerning timescales, the innermost -spheres (having ) would have a rise time of about 5 days, well within an observing EGRET viewing period. Here, is the Einstein radius the length scale of the microlensing problem. and are the angular diameter distances between the observer and the lens, between the observer and the source, and between the lens and the source, respectively. and have their usual meaning. The largest -spheres, with , can have a rise time of about 1 yr. Higher (lower) velocities would imply lower (higher) timescales.
Recent results (Wyithe & Turner 2002), taking into account the clustering of stars in interposed galaxies, give for the a priori probability of finding magnified sources in random directions of the sky values between 10-2 — 10-3. In those directions where there is gravitational lensing, the probability of having large local optical depths is high.333The concept of optical depth was originally introduced in gravitational microlensing studies by Ostriker and Vietri (1983). If the actual total number of -ray emitting blazars is in excess of 107 (1 blazar out of 10 000 normal galaxies) even when considering reduced probabilities for microlensing, scaling as with being the local optical depth and the magnification, an interesting number of GLAST detections (from a handful to some tens) could be potentially ascribed to microlensing.
5 Alternative origins of high-latitude -ray sources
5.1 Galaxy clusters
Very recently, an interest in galaxy clusters as possible EGRET counterparts has been sparked by strong claims of positive correlations between unidentified -ray sources and -ray excesses and the position of clusters in the Abell Catalog (Colafrancesco 2001, Kawasaki & Totani 2002, Scharf & Mukherjee 2002). In the next chapter O. Reimer analyzes in detail the possibility of such association.
There are several reasons to expect that galaxy clusters emit -rays. Hadronically produced -rays, via interactions of high-energy cosmic rays with the intracluster medium (Berezinsky et al. 1997), or as the origin of a secondary population of relativistic electrons (Atoyan & Völk 2000) have been considered. -ray radiation could also arise as a result of large-scale cosmological structure formation (Dar & Shaviv 1995, Colafrancesco & Blasi 1998, Waxman & Loeb 2000, Totani & Kitayama 2000; Kawasaki & Totani 2002, Miniati 2002, Berrington & Dermer 2002). Reimer et al. (2003) analyzed Phase 1 to 9 of EGRET observations of a sample of 58 X-ray bright galaxy clusters with . The sample selection assumed a plausible assumption, i.e. that the brightest and nearest clusters already detected in X-rays should be the most likely candidates to emit observable amounts of -rays (this sample includes, for instance, all known clusters exhibiting EUV excesses, or hard non-thermal X-ray emission). The main result of this analysis is that no galaxy cluster in the sample has been seen by the EGRET experiment. Interestingly, even if all observations for all clusters are added up, this results only in an upper limit of photons cm-2 s-1 for an average galaxy cluster.
Upper limits for particular galaxy clusters for which there are theoretical predictions already rule out the models by Enlin et al. (1997) and Dar & Shaviv (1995) and defer for further tests those of Berrington & Dermer (2002), Colafrancesco & Blasi (1998) and Miniati (2002). It is to be noted, however, that the null results for EGRET observations of bright X-ray clusters do not imply that such systems will not be detected by future instruments with improved sensitivity, both ground- and space-based.
Totani & Kitayama (2000) have also argued for merging clusters of galaxies (which have low X-ray brightness and thus are excluded from the Reimer et al.’s analysis) to be possible EGRET source counterparts. To produce the high-energy radiation, they invoked inverse Compton scattering of accelerated electrons with photons of the CMB. Totani and Kitayama estimated that about 30 EGRET sources and several thousands of future GLAST sources will be produced by merging galaxy clusters. Berrington & Dermer (2002) and Colafrancesco (2002) have already presented strong objections to the estimation of the number of sources (which would have entailed half of the expected GLAST catalog). The main argument is the hardness of the spectral index of injected non-thermal electrons, for which Totani & Kitayama obtained 2.0, assuming that the merger shocks have large Mach numbers. Detailed estimates of Berrington & Dermer are between 2.2 and 2.3. Since the energies of electrons that Compton scatter the CMB radiation to MeV energies exceed GeV, the steeper injection spectrum reduces the available power in these electrons by 1–2 orders of magnitude. Only a few of the unidentified EGRET sources could then possibly be associated with merging clusters of galaxies, and these would involve the less frequent events involving collisions of clusters with masses near 1015M⊙, hard spectral indices, or dark matter density profiles with strong central peaks.
5.2 Normal Galaxies
The only normal galaxy, other than the Milky Way, detected by EGRET is the Large Magellanic Cloud (LMC, Sreekumar et al. 1992). It was detected using data taken along four weeks, with a flux of photons cm-2 s-1 above 100 MeV. This result had been predicted by Fichtel et al. (1991) as the output of pion decay resulting from the interaction between cosmic ray protons and interstellar gas, assuming galactic dynamic balance between the expansive pressures of the cosmic rays, magnetic fields, and kinematic motions and the gravitational attraction of matter.
It is instructive to show how to obtain the predicted flux. One can consider that the electron spectrum is a power-law , with being the number of electrons per unit energy per unit volume, and the spectrum normalization. The intensity of the synchrotron radiation in the presence of random magnetic fields is
| (4) |
(Ginzburg & Syrovatskii 1964) where is the observing radio frequency in Hz, is a numerical coefficient of order 0.1, is the length over which the electrons and magnetic fields are present and is the magnetic field strength. The normalization of the spectrum is assumed proportional to both in the LMC and our Galaxy, and the shape of the spectrum in the LMC is assumed the same as that in the Milky Way. Then, if and are the corresponding values of these parameters in our Galaxy, and is the value in the LMC, . Using this expression in Eq. (4) the scaling can be determined:
| (5) |
where is the distance in kpc. Assuming best guesses for all parameters involved (see, for instance, the Appendix of Fichtel et al. 1991), the electron normalization can be determined. The additional assumption that the electron-to-proton ratio is the same in the LMC as in the Galaxy yields the proton spectrum. An estimation of the matter column density then allows the -ray flux to be computed as:
| (6) |
with being the solid angle subtended by the emitting region, photons s-1 sr-1 H-atom-1 being the -ray production, and , with and the atomic and molecular density, respectively, being the column density. Note that the prediction allows different emission level contours to be plotted, depending on the position in the galaxy. However, in order to make a direct comparison with EGRET or any other experiment, the predicted -ray intensity has to be compared with the corresponding point-spread function. Although the predicted intensity based on the dynamic balance is in good agreement with the EGRET result, it is also in agreement with the cosmic ray density being the same throughout the galaxy, as if, for instance, the cosmic ray density is universal in origin (e.g., Brecher and Burbidge 1972)
The LMC EGRET detection did not allowed to distinguish between these two possibilities, although an ever increasing amount of evidence favored the Galactic hypothesis. It was the non-detection of the Small Magellanic Cloud (SMC) what would settle this issue. There were three separate EGRET observations of the SMC amounting several weeks of off-axis SMC pointings. No significant deviation was found in the SMC region, implying an upper limit of photons cm-2 s-1 (Sreekumar et al. 1993). If the cosmic ray density in the SMC were as high as it is in our galaxy, the intensity in -rays would be photons cm-2 s-1, a level incompatible with the experimental result. Therefore, the distribution of cosmic rays can not be universal.
A feeling of what future instruments can do by observing the SMC can be obtained by looking at the different assumptions for Galactic origins of the cosmic ray flux. As done for the LMC, Sreekumar and Fichtel (1991) have previously computed the -ray emission expected from the SMC, showing that there was a strong disagreement in the magnitude of the cosmic ray density, and then of the -ray flux, between that obtained using the matter distribution and the assumption of dynamic balance and that deduced from synchrotron radiation. Unlike the LMC, the SMC is not expected to be in equilibrium, but in a disrupted state. If that is the case, the synchrotron radiation estimation is more reliable. An instrument like GLAST, then, will shed light on the issue of the dynamical state of the SMC, by comparing different predictions for the cosmic ray density.
It is to be noted that a significant contribution to the diffuse flux can be due as the sum of unresolved point like sources, e.g., pulsars. Numerical simulations have been done both within the polar cap (Hartmann et al. 1993) and outer gap (Zhang & Cheng 1998) models for -ray emission, and the results are comparable. In the case of the outer gap model applied to the LMC EGRET observations, the ratios of expected fluxes to those observed in 100, 500 and 1000 MeV are 7.5%, 30%, and 95%, respectively, showing that unresolved sources will provide most of the flux at high -ray energies, something that must be taken into account when interpreting the high energy radiation.
Very recently, Pavlidou and Fields (2001) presented an observability study for several of the local group galaxies, assuming that the -ray flux above 100 MeV is represented by
| (7) |
with being the ratio between the galaxy and the Milky Way supernova rates, and the gas mass-to-distance squared ratio. This amounts to the assumption that supernova remnants alone are the source of cosmic rays, and that once produced, their propagation is described by a leaky box model, with the additional supposition of an equal time/length of escape to that of our Galaxy. This approach is far simpler than that followed by Fichter, Sreekumar and coworkers when analyzing the LMC and SMC cases, although probably not quite correct for those galaxies which are different from ours, like the SMC. 444Using the same approach, Pavlidou and Fields (2002) have presented a computation of the contribution to the -ray background produced by cosmic-ray interactions with diffuse gas of normal galaxies. They found that a multi-component fit (e.g., blazars + normal galaxies) of the extragalactic -ray background emission is better than the one obtained with unresolved active nuclei alone. Notwithstanding, their results do not differ much from Fichtel & Sreekumar’s (1991), and are compatible with current constraints (Sreekumar et al. 1994). For example, the Andromeda galaxy M31, a case studied previously by Özel and Berkhuijsen (1987), presents a flux of photons cm-2 s-1, consistent with the observational upper limit set by Blom et al. (1999) using more recent EGRET data. This flux could be detected by GLAST in the first 2 years of its all-sky survey with 14 significance. If such is the case, it will be possible to study the correlation between regions of higher column density and higher -ray emission. It could even be possible to observe effects of the magnetic torus (e.g., Beck et al. 1996) and the star forming ring (e.g., Pagani et al. 1999), a morphological feature analogous to the Milky Way’s H2 ring extending in radius from 4 to 8 kpc (e.g., Bronfman et al. 1988), which has been detected in -ray surveys (Stecker et al. 1975). Other results for Local Group Galaxies show that, unless the assumptions are severely misrepresenting the physics, only M33 might have some chance of being detected by future instruments (Digel et al. 2000).
5.3 Starburst Galaxies
Starburst galaxies are subject to tremendous rates of star formation and, consequently, of supernova explosions. As such, it is expected that starbursts should have a -ray flux significantly higher than normal galaxies. The EGRET experiment, however, did not detect any starburst, but rather put upper limits on a handful of them. Such is the case of M82, with photons cm-2 s-1, and NGC 253, with photons cm-2 s-1 (Blom et al. 1999), the two nearest starbursts from Earth. These limits improved previous estimates by Sreekumar et al. (1994), obtained with shorter exposures.
M82 in the northern hemisphere, and NGC 253 in the south, are alike. NGC 253, at a distance of Mpc, has been described as an archetypal starburst galaxy by Rieke et al. (1980), and it has been extensively studied from radio to -rays (e.g., Beck et al. 1994, Paglione et al. 1996, Ptak 1997). More than 60 individual compact radio sources have been detected within the central 200 pc (Ulvestad et al. 1999), most of which are supernova remnants (SNRs) with ages of only a few hundred years. The supernova rate is estimated to be as high as yr-1, comparable to the massive star formation rate, estimated as M⊙ yr-1 (Ulvestad et al. 1999, Forbes et al. 1993). The central region of this starburst is packed with massive stars. Watson et al. (1996) have discovered four young globular clusters near the center of NGC 253; they alone can account for a mass well in excess of 1.5M⊙ (see also Keto et al. 1999). Assuming that the star formation rate has been continuous in the central region for the last 109 yrs, and a Salpeter IMF for 0.08–100 M⊙, Watson et al. (1996) find that the bolometric luminosity of NGC 253 is consistent with 1.5 M⊙ of young stars. Physical, morphological, and kinematic evidence for the existence of a galactic superwind has been found for NGC 253 (e.g., McCarthy et al. 1987, Heckman et al. 1990). This superwind creates a cavity of hot ( K) gas, with cooling times longer than the typical expansion timescales. As the cavity expands, a strong shock front is formed on the contact surface with the cool interstellar medium. Shock interactions with low and high density clouds can produce X-ray continuum and optical line emission, respectively, both of which have been directly observed (McCarthy et al. 1987). The shock velocity can reach thousands of km s-1.
A generally similar situation applies to M82, at 3.2 Mpc. The supernova rate in M82, for instance, may be as high as 0.3 yr-1 (Rieke et al. 1980). The total star formation rate of the central regions of the galaxy can be as high as M⊙ yr-1 (O’Connell & Mangano 1978). The far infrared luminosity of the region within 300 pc of the nucleus is L⊙ (Rieke et al. 1980). There is M⊙ of ionized gas and M⊙ of neutral gas in the IR source (Rieke et al 1980, Satyapal et al. 1997). The total dynamical mass in this region is –2) M⊙, of which % might be in the form of young stars (Satyapal et al. 1997).
Early computations of the expected flux from M82 (Akyüz et al. 1991), have been improved recently by Vöelk (1996), Paglione et al. (1996) and Blom et al. (1999). Paglione et al.’s approach to compute the -ray flux of a starburst is based on a previous study for interstellar clouds by Marscher and Brown (1978). Results for NGC 253, M82, and that of an average starburst galaxy [constructed co-adding observations of 10 starbursts selected by distance ( Mpc), far infrared luminosity () and Galactic latitude ()], are given in Fig. 7. Models with different values for the magnetic field, the proton-to-electron ratio, and the efficiency of energy transfer from a supernova to cosmic rays, were considered, producing different curves in the figure.
At TeV energies, at least one starburst galaxy has been detected (NGC 253, Itoh et al. 2002). Its emission at high energy has been interpreted as non-thermal radiation due to TeV electrons interacting through inverse Compton scattering with the different background photon fields (Itoh et al. 2003). The contribution of hadronic processes in star winds was discussed by Romero & Torres (2003). It is to be noted, however, that the star wind modulation of the proton flux would inhibit protons with energies of GeV to enter into the wind, and this process would essentially produce a negligible output at EGRET-range energies.

The discovery of new nearby starbursts (see for example the Pico Dos Dias Catalog, Coziol et al. 1998), enhances the probability of -ray detections with GLAST, if the standard models for their emission are basically correct (Torres et al. 2004).
5.4 Radio galaxies
Since the number density of radio galaxies can be a factor of 103 above those of BL LACs and FSRQs, the prospects of them being a new population of high-latitude -ray sources looks promising. Centaurus A (), at a distance of 3.5 Mpc and redshift (Hui et al. 1993), is the closest AGN, and the only radio galaxy positively detected in the 3EG. It was detected with 6.5 confidence, appearing point-like (Sreekumar et al. 1999). The average 100 MeV flux is photons cm-2 s-1. This photon flux implies a luminosity of 1041 ergs s-1, about 105 times less than that typical of detected blazars. This low luminosity, if typical for radio galaxies, could explain the fact that Cen A is the only radio galaxy in the 3EG: more distant members of its class were just beyond the reach of EGRET. Cen A is identified at optical frequencies with the galaxy NGC 5128 (Israel 1998), which has a jet that is offset by an angle of from the line of sight (Bailey et al. 1986; Fujisawa et al. 2000). It further presents a one-sided X-ray jet, collimated in the direction of the giant radio lobes (Kraft et al. 2002, Hardcastle et al. 2003). The radio luminosity is ergs s-1, and is currently classified as a Faranoff-Riley type I radio galaxy, and earlier, as a misaligned blazar (Bailey et al. 1986). The high-energy flux of Cen A appears to be constant, but this could be either an intrinsic phenomenon or a biased result due to the near-threshold detection associated with the individual observations. The 3EG catalog 30 MeV–10 GeV photon spectrum is well characterized by a single power law of index 2.400.28. Apart from the positional coincidence, which could be suspect because of the large localization uncertainty of EGRET, co-spatial detections by OSSE (Kinzer et al. 1995) and COMPTEL (Steinle et al. 1998) which provide a consistent spectrum going from 50 keV to 1 GeV, further argue for emission from single source coincident with Cen A. The detection of Cen A raises the possibility that several other unidentified -ray sources could be radio galaxies.
Indeed, there are two additional EGRET sources, one of them at high latitude, for which a possible radio galaxy counterpart has been suggested. One such source is 3EG J1621+8203 (Mukherjee et al. 2002). 3EG J1621+8203 observations in individual viewing periods yielded near-threshold detections by EGRET, as for Cen A. However, in the cumulative exposure, it was clearly detected and the measured flux above 100 MeV was photon cm-2 s (Hartman et al. 1999). The photon spectral index for this source is 2.270.53, steeper than the usual blazar-like spectrum. Mukherjee et al. (2002) analyzed the X-ray and radio field coincident with 3EG J1621+8203. They concluded that NGC 6251, a bright Faranoff-Riley type I radio galaxy (Bicknell 1994; Urry & Padovani 1995) at a redshift of 0.0234 (implying a distance 91 Mpc for km s-1 Mpc-1), and the parent galaxy of a radio jet making an angle of 45o with the line of sight (Sudou & Taniguchi 2000), is the most likely counterpart of the EGRET source. With this identification, the implied -ray luminosity is also a factor of below that typical of blazars. Compared with Cen A, the greater distance to NGC 6251 could, perhaps, be compensated by the smaller angle between the jet and the line of sight.
Combi et al. (2003) have also recently reported the discovery of a new radio galaxy, J173715, within the location error box of the low-latitude -ray source 3EG J17351500, whose photon index is . The radio galaxy morphology at 1.4 GHz is typical of the double-sided Faranoff-Riley type II. The integrated radio flux is mJy at 1.4 GHz, the source is non-thermal and it is not detected at 4.8 GHz (Griffith & Wright 1993). Using the relation between approaching and receding jets (e.g., Mirabel & Rodríguez 1999): as well as the radio fluxes of each jet component, a viewing angle in the range for a velocity between 0.3 and 0.9 and is derived. Depending on the jet and ambient medium parameters, most double-sided radio sources have sizes below kpc (Begelman et al. 1984). In the case of J173715, and using standard Friedmann-Robertson-Walker models, this size translates into a possible distance less than 350 Mpc. If 3EG J17351500 is indeed the result of -ray emission in J173715, the intrinsic luminosity at MeV, at the distance quoted, should then be less than erg s-1, also several orders of magnitude smaller than that of blazars.
Concerning other possible radio galaxies that might have been observed by EGRET, Cillis et al. (2003) have used an stacking procedure to establish upper limits of the order of photons cm-2 s-1. M87, a giant radio galaxy for which there has been a recent detection of a TeV excess at a level of 4 (Aharonian et al. 2003), is also expected to be a source for GLAST, having an EGRET upper limit of photons cm-2 s-1 above 100 MeV (Reimer et al. 2003, who improved the limit imposed by Sreekumar et al 1994), and theoretical flux predictions not much smaller that this value (Dermer and Rephaeli 1988).
5.5 Cold molecular clouds in the galactic halo
Very recently, Walker et al. (2003) have proposed that most of the unidentified -ray sources at all latitudes are cold, dense gas clouds of baryonic dark matter. These clouds would emit -rays mainly by interactions between atoms of the cloud and cosmic rays residing in the Galactic halo.
Walker et al.’s model predicts about 300 unidentified EGRET detections. All of these sources are expected to be extended and non-variable, both facts at variance with current observations. It is also expected that there will be thermal emission from the clouds, implying bright microwave sources coincident with the -ray sources. In Walker et al.’s model, the microwave and -ray flux are both proportional to the same parameters (the mass of the cloud and the cosmic-ray density). Consequently, it is possible to scale down in frequency the -ray flux, in order to obtain an estimate of the expected bolometric microwave emission. The result is erg cm-2 s-1, where is the -ray flux above 100 MeV in units of 10-7 ph cm-2 s-1. The spectrum of emission plays a crucial role: depending whether it is a blackbody or a dusty spectrum, at low frequencies, it can be approximated by mJy or mJy, with in GHz, respectively. However, the Wilkinson Microwave Anisotropy Probe data constrain this possibility. Of the 208 sources in the WMAP catalog, 203 sources have known counterparts. The five without counterparts are all near the detection threshold, and this number is compatible with the expected number of false positives. Thus, there is no evidence for a population of bright microwave sources without known radio counterparts (Bennett et al. 2003).
6 EGRET detections and cosmic rays
Gorbunov et al. (2002) claimed that a set of -ray loud BL Lacs can be selected by intersecting the EGRET, the ultra-high energy cosmic ray, and the BL Lac catalogs (all conveniently cut). The only requirement Gorbunov et al. considered for an object (a BL Lac) to be physically associated with an EGRET source is that the angular distance between the best estimated position of the pair does not exceed , where is the 95% confidence level contour of the EGRET detection. This is an unjustified assumption (see Fig. 4, left panel), and is contrary to previous results (Sigl et al. 2001). Torres et al. (2003b) have searched for correlations between the same set of BL Lacs and the arrival directions of 33 cosmic rays of ultra high energy not used by Gorbunov et al. The latter constitutes a blind sample statistically relevant to test the hypothesis. No positional coincidences within the accuracy of the angular determination was found. The probability that this result arises as a statistical fluctuation from the strongly correlated sample was found to be more than a deviation.
7 Concluding remarks
In this chapter, some aspects of our knowledge of high-latitude -ray sources were reviewed. As during the last decade of the previous century, we will soon enter into a period where simultaneous multiwavelength observations will be possible. It is expected that both a tremendous impact on the phenomenological understanding of AGNs and the yet-unidentified high-latitude sources, and concrete new theoretical challenges, will arise from such forthcoming campaigns. We are on the verge of producing, once again, an observationally driven -ray astrophysics.
Acknowledgments
This work was performed under the auspices of the U.S. Department of Energy (NNSA) by UC’s LLNL under contract No. W-7405-Eng-48. I acknowledge W. Collmar, R. Hartman, R. Romani, A. Wehrle, J.J. Blom, and the AAS for their kind permission to reproduce their figures, and O. Reimer, G. Romero, S. Digel, R. Hartman, and C. Mauche for critical readings and discussions.
1
References
- [1] Aharonian F.A. 1999, Astron. Nach. 320, 222
- [2] Aharonian F.A. 2000, New Astronomy, 5, 377
- [3] Aharonian F.A., et al. 2001, ApJ 546, 898A
- [4] Akyüz A., Brouillet N., & Özel M. E. 1991, A&A 248, 419
- [5] Atoyan A.M. & Völk H.J. 2000, ApJ 535, 45
- [6] Bailey J., et al. 1986, Nature, 322, 150.
- [7] Beall & Bednarek 1999, ApJ 510, 188
- [8] Beck R., et al. 1996, ARAA, 34, 155
- [9] Bednarek W. 1998, A&A, 342, 69
- [10] Bednarek W. 1999, Mem. Soc. Astron. Ital. 70, 1249
- [11] Bednarek W. & Protheroe R. 1997, MNRAS 287, L9
- [12] Bednarek W. & Protheroe R. 1999, MNRAS 302, 373
- [13] Begelman M.C., Blandford R.D., & Rees M.J. 1984, Rev. Mod. Phys. 56, 255
- [14] Bennett C.L. et al. (the WMAP Collaboration), ApJ, in press. astro-ph/0302208
- [15] Berrington R. & Dermer C., ApJ, in press, astro-ph/0209436
- [16] Bicknell, G.V. 1994, ApJ, 422, 542
- [17] Blandford R.D. & Königl A. 1979, ApJ 232, 34
- [18] Blandford R.D., & Levinson A. 1995, ApJ 441, 79
- [19] Blom J.J., Paglione T.A.D. & Carramiñana A. 1999, ApJ 516, 744
- [20] Blom J.J., et al. 1995, A&A 298, L33
- [21] Bloom S.D. & Marscher A.P. 1996, ApJ 461, 657
- [22] Bloom S.D., et al. 1997, ApJ 488, L23
- [23] Bloemen H., et al. 1995, A&A 293, L1
- [24] Böttcher M. & Dermer C.D. 1998, ApJ 501, L51
- [25] Böttcher M., Mause H. & Schlickeiser R. 1997, A&A 324, 395
- [26] Böttcher M. 1999, in Proc. of the workshop ‘GeV-TeV Gamma-Ray Astrophysics’, Snowbird, Utah, 1999 astro-ph/9909179
- [27] Böttcher M., Mukherjee R. & Reimer A. 2002, ApJ 581, 143
- [28] Brecher K., Burbidge, G. R. 1972, ApJ 174, 253
- [29] Bronfman L., et al. 1988, ApJ, 324, 248
- [30] Buckley J. H. et al. 1996, ApJ 472 L9
- [31] Catanese M. et al. 1997, ApJ 487 L143
- [32] Catanese M. & Weekes T.C. 1999, PASP 111, 1193
- [33] Cheng K.S., Zhang X., & Zhang L. 2000, ApJ 537, 80
- [34] Chiang J. & Mukherjee R. 1998, ApJ 496, 752
- [35] Cillis A. et al. 2003, submitted
- [36] Colafrancesco S. & Blasi P. 1998, Astropart. Phys., 9, 227
- [37] Colafrancesco S. 2001, AIP Conference Proceedings 587, 427
- [38] Colafrancesco S. 2002, A&A 396, 31
- [39] Collmar W. et al. 1997, AIP 410, 1341
- [40] Collmar W. 2001, In the proceedings of the 4th INTEGRAL Workshop ‘Exploring the Gamma-Ray Universe’, astro-ph/0105193
- [41] Collmar W. 2002, Mem. Soc. Astron. Ital. 73, 99
- [42] Combi J.A., & Romero G.E. 1998, A&AS 128, 423
- [43] Combi J.A., Romero G.E., Paredes J.M., Torres D.F. & Ribó M. 2003, ApJ 588, 731
- [44] Condon J.J., et al. 1991, AJ 102, 2041
- [45] Coziel R., et al. 1998, ApJS 119, 239
- [46] Dai B.Z. et al. 2001, AJ 122, 2901
- [47] Dar A. & Shaviv N.J. 1995, Phys. Rev. Lett. 75, 3052
- [48] Dar A. & Laor 1997, ApJ 478, L5
- [49] Dermer C., & Rephaeli Y. 1988, ApJ 329, 687
- [50] Dermer C.D., Schlickeiser R. & Mastichiadis A. 1992, A&A 256, L27
- [51] Dermer C.D. & Schlickeiser R. 1993, ApJ 416, 458
- [52] Dermer C.D. & Gehrels N. 1995, ApJ 447, 103
- [53] Dermer C.D., Sturner S.J. & Schlickeiser R. 1997 ApJS 109, 103
- [54] Digel S.W., Moskalenko I.V., Ormes J.F. et al. 2000, Proceedings of the workshop: New worlds in Astroparticle Physics, astro-ph/0009271
- [55] Dondi L. & Ghisellini G. 1995, MNRAS 273, 583
- [56] Elliot J.L., Shapiro S.L. 1974, ApJ 192 L3
- [57] Enlin T.A., et al. 1997, ApJ 477, 560
- [58] Fichtel C.E., Ozel M.E., Stone R.G. & Sreekumar P. 1991, ApJ, 374, 134
- [59] Forbes D.A., et al. 1993, ApJ 406, L11
- [60] Fujisawa K., et al. 2000, PASJ 52, 1021
- [61] Gehrels N. & Michelson P. 1999, Astrop. Phys. 11, 277
- [62] Gehrels N., et al. 2000, Nature 404, 363
- [63] Ghisellini G., & Madau P. 1996, MNRAS 280, 67
- [64] Ghisellini G.,et al. 1998, MNRAS 301 451
- [65] Gorbunov D.S., Tinyakov P.G., Tkachev I.I. & Troitsky S.V. 2002, ApJ 577, L93
- [66] Grenier I.A. 1995, Adv. Space. Res. 15, 73
- [67] Grenier I. 2000, A&A 364, L93
- [68] Grenier I. & Perrot C.A. 2001, AIP Conf. Proc. 587, 649
- [69] Griffith M.R. & Wright, A.E. 1993, AJ 105, 1666
- [70] Halpern J.P., Eracleous M. & Mattox J.R. 2003, AJ 125, 572
- [71] Hardcastle M.J. et al. 2003, astro-ph/0304443
- [72] Hartman R.C., et al. 1999, ApJS, 123, 79
- [73] Hartman R.C., et al. 2001, ApJ 558, 583
- [74] Hartman R.C., et al. 1993, ApJ, 407, L41
- [75] Hartmann C.H., Brown L.E., & Schneff N. 1993, ApJ 408, L13
- [76] Heckman T.M., Armus L., & Miley G.K. 1990, ApJS 74, 833
- [77] Hui X., et al. 1993, ApJ 414, 463
- [78] Iler A.L., Schachter J.F. & Birkinshaw M. 1997, ApJ 486, 117
- [79] Israel F.P. 1998, A&A Rev. 8, 237
- [80] Itoh C., et al. 2002, A&A 396, L1
- [81] Itoh C., et al. 2003, ApJ 584, L65
- [82] Jorstad S. et al. 2001a, ApJS 134, 181
- [83] Jorstad S. et al. 2001b, ApJ 556, 738
- [84] Kataoka, J., et al., 1999, Astropart. Phys. 11, 149
- [85] Kawasaki W. & Totani T. 2002, ApJ 576, 679
- [86] Kaufman Bernadó M. M., Romero G. E. & Mirabel, I. F. 2002, A&A 385, L10
- [87] Kayser R., Refsdal S., & Stabell R. 1986, A&A 166, 36
- [88] Kazanas D. & Mastiachidis A. 1999, ApJ 518, L17
- [89] Kinzer R.L. et al. 1995, ApJ 449, 105
- [90] Kniffen D.A., et al. 1993, ApJ 411, 133
- [91] Kniffen D.A., et al. 1997, ApJ 486, 126
- [92] Kraft R.P. et al. 2002, ApJ 569, 54
- [93] Lin Y.C, et al. 1992, ApJ 401, L61.
- [94] Lovell J.E.J., et al. 1996, ApJ 472, L5
- [95] Mannheim K. 1993, A&A 269, 67
- [96] Mannheim K. & Biermann P. 1992, A&A 253, L21
- [97] Mannheim K. 1996, Space Sci. Rev. 75, 331
- [98] Maraschi L., Ghisellini G. & Celotti A. 1992, ApJ 397, L5 (1992).
- [99] Maraschi L., et al. 1999, ApJ 526, L81
- [100] Marscher A.P., & Brown R.L. 1978, ApJ 221, 588
- [101] Marscher A.P. & Gear W.K. 1985, ApJ 298, 114
- [102] Mastichiadis A. & Kirk J. G. 1997, A&A 320, 19
- [103] Mattox J.R., et al. 1997, ApJ 481, 95
- [104] Mattox J.R., et al. 1997b, ApJ, 476, 692
- [105] Mattox J.R., Hartman R.C. & Reimer O. 2001, ApJS 135, 155
- [106] Mei D.C., Zhang L. & Jiang Z.J. 2002, A&A 391, 917
- [107] McCarthy P.J., Heckman T., & van Breugel W. 1987, AJ 93, 264
- [108] Mirabal N., et al. 2000, ApJ 541, 180
- [109] Mirabel I.F., & Rodríguez L.F. 1999, ARA&A, 37, 409
- [110] Miniati F. 2002, MNRAS, 337, 199
- [111] von Montigny C., et al. 1995a, ApJ 440, 525
- [112] von Montigny C., et al. 1995b, A&A 299, 680
- [113] Mücke A. et al. 1997, A&A 320, 33
- [114] Mücke A. & Pohl M. 2000, MNRAS 312, 177
- [115] Mücke A. & Protheroe R. 2000, Astropart. Phys., astro-ph/0004052.
- [116] Mukherjee R., et al. 1996, ApJ, 470, 831
- [117] Mukherjee R., et al. 1997, ApJ 490, 116
- [118] Mukherjee R., et al. 1999, ApJ 527, 132
- [119] Mukherjee R., et al. 2002, ApJ 574, 693
- [120] Mukherjee R. 2001, in High Energy Gamma-Ray Astronomy, F.A. Aharonian, H.J. Völk (Eds.) (AIP, Melville NY, p.324), astro-ph/0101301
- [121] Myers S.T. et al. 2002, astro-ph/0211073
- [122] Nellen L., Mannheim K. & Biermann P.L. 1993, Phys. Rev. D 47, 5270
- [123] Nolan P., et al. 2003, astro-ph/0307188, to appear in ApJ
- [124] O’connell R.W. & Mangano J.J. 1978, ApJ 221, 62
- [125] Ostriker J., & Vietri M. 1985, Nature 318, 446
- [126] Özel M.E. & Thompson D.J. 1996, ApJ 463, 105
- [127] Özel M.E. & Berkhuijsen E.M. 1987, A&A, 172, 378
- [128] Padovani P., et al. 1993, MNRAS 260, L21
- [129] Padovani P. 1997, astro-ph/9701074
- [130] Pagani L., et al. 1999, A&A 351, 447
- [131] Paglione T.A.D., et al. 1996, ApJ 460, 295
- [132] Paredes J.M., et al. 2000, Science, 288, 2340
- [133] Pavlidou V. & Fields B. 2001, ApJ 558, 63
- [134] Pavlidou V. & Fields B. 2002, ApJ 575, L5
- [135] Petry D., et al. 1999, ApJ
- [136] Pian E., et al. 1998, ApJ 492, L17
- [137] Pian E., et al. 1999, ApJ 521, 112
- [138] Pohl M. et al. 1995, A&A 303, 383
- [139] Protheroe R. & Mücke A., astro-ph/0011154.
- [140] Ptak A., et al. 1997, AJ 113, 1286
- [141] Punsly B. 1997, AJ 114, 544
- [142] Punsly B., et al. 2000, A&A 364, 55
- [143] Purmohammad D. & Samimi J. 2001, A&A 371, 61
- [144] Rachen J. 1999, in Proc. of the workshop ‘GeV-TeV Gamma-Ray Astrophysics’, Snowbird, Utah, 1999 astro-ph/0003282
- [145] Rebillot P. et al. 2003, astro-ph/0305583
- [146] Reimer O. & Thompson D.. 2001, in Proc. of 27th Int. Cosmic Ray Conf., Hamburg, 2001, 2566
- [147] Reimer O. 2001, in: The Nature of Galactic Unidentified Gamma-ray Sources, O. Carramiana, O. Reimer, D. Thomson (Eds.) (Kluwer Academic Press, Dordrecht, p.17), astro-ph/0102495
- [148] Reimer O., et al. 2003, ApJ 588, 155
- [149] Reimer O. 2003, this volume
- [150] Rieke G.H., et al. 1980, ApJ 238, 24
- [151] Rieke G.H., et al. 1993, ApJ 412, 99
- [152] Romero G.E. 1996, A&A 313, 759
- [153] Romero G.E., Benaglia P., & Torres D.F. 1999, A&A, 348, 868
- [154] Romero G.E., et al. 2001, A&A 376, 599
- [155] Romero G.E., et al. 2002, A&A 390, 431
- [156] Romero G.E., et al. 2003, submitted to A&A Lett.
- [157] Romero G.E., & Torres D.F. 2003, ApJ 586, L33
- [158] Salamon M.H. & Stecker F.W. 1994, ApJ 430, L21
- [159] Sambruna R.M., et al. 2000, ApJ 538, 127
- [160] Satyapal S., et al. 1997, ApJ 483, 148
- [161] Schlickeiser R. 1996, Space Sci. Rev. 75, 299
- [162] Scharf C.A. & Mukherje, R. 2002, ApJ, 580, 154
- [163] Schneider P. & Weiss A. 1987, A&A 171, 49
- [164] Schenider D.P., et al. 1988, AJ 95, 1619
- [165] Schönfelder V. 2000, A&AS 143, 145
- [166] Schuster C., Pohl M. & Schlickeiser R. 2001, AIP 587, 363
- [167] Sigl G., et al. Phys. Rev. D 63, 081302
- [168] Sikora M., Begelman M.C. & Rees M. J 1994, ApJ 421, 153 (1994).
- [169] Sowards-Emmerd D., Romani R.W., Michelson P.F. 2002, ApJ 509, 109
- [170] Sreekumar P., et al. 1999, Astropart. Phys. 11, 221
- [171] Steinle H. et al. 1998, A&A, 330, 97
- [172] Sreekumar P. & Fichtel C.E. 1991, A&A 251, 447
- [173] Sreekumar P. et al. 1992, ApJ 400, L67
- [174] Sreekumar P. et al. 1993, Phys. Rev. Lett., 70, 127
- [175] Sreekumar P. et al. 1994, ApJ 426, 105
- [176] Sreekumar P. et al. 1996, ApJ, 464, 628
- [177] Sreekumar P. et al. 1998, ApJ 494, 523
- [178] Sreekumar P. et al. 1999, Astropart. Phys., 11, 221
- [179] Sreekumar P. et al. 1999, AIP Conf. Proc. 510, 318
- [180] Stecker F.W. & Salamon M.H. 1996, ApJ 464, 600
- [181] Stecker F.W., et al. 1975, ApJ, 201, 90
- [182] Stecker F.W., Salomon M.H. & Malkan M.A. 1993, ApJ 410, L71
- [183] Stecker F.W., et al. 1996, Phys. Rev. Lett. 66, 2697
- [184] Sudou H. & Taniguchi Y. 2000, AJ 120, 697
- [185] Swanenburg B.N., et al. 1978, Nature 275, 298.
- [186] Tavani M., et al. 1997, ApJ 479, L109
- [187] Tavani M., et al. 1998, ApJ 497, L89
- [188] Tompkins W. 1999, Ph.D. Thesis, Stanford University
- [189] Tornikoski M., et al. 2002, ApJ 579, 136
- [190] Torres D.F., et al. 2001a, A&A, 370, 468
- [191] Torres D.F., Pessah M.E. & Romero G.E. 2001b, Astron. Nachr. 322, 223
- [192] Torres D.F., Romero G.E. & Eiroa E.F. 2002a, ApJ 569, 600
- [193] Torres D.F., et al. 2003, MNRAS 339, 335
- [194] Torres D.F., et al. 2003b, ApJ 595, L13
- [195] Torres D.F., Reimer O. Domingo-Santamaria E, & Digel S. W. 2004, ApJ 607, L99
- [196] Totani T., & Kitayama T. 2000, ApJ 545, 572
- [197] Ulvestad J.S., & Antonucci R.R.J. 1999, ApJ 488, 621
- [198] Urry C.M. & Padovani P. 1995, PASP 107, 803
- [199] Véron-Cetty M.-P. & Véron P., 2001, A&A 374, 92
- [200] Völk H.J., Aharonian F.A., & Breitschwerdt D. 1996, Sp. Sci. Rev. 75, 279
- [201] Völk H.J. & Atoyan A.M. 1999, Astropart. Phys., 11, 73
- [202] Walker M., Oshishi M. & Mori M. ApJ 589, 810
- [203] Wambsganss J. 1999, Jour. Comp. Appl. Math. 109, 353
- [204] Wambsganss J. 2001, in: Proc. of the XXth Moriond Astrophysics Meeting ”Cosmological Physics with Gravitational Lensing”, eds. J.-P. Kneib, Y. Mellier, M. Moniez & J. Tran Thanh Van, p. 89, astro-ph/0010004
- [205] Waxman E. & Loeb A. 2000, ApJ 545, L11
- [206] Wallace P.M., et al. 2000, ApJ 540, 184
- [207] Wallace P.M., et al. 2002, ApJ 569, 36
- [208] Wehrle A., et al. 1998, ApJ 497, 178
- [209] White R.L. & Becker R.H. 1992, ApJS 79, 331
- [210] Wyithe S. & Turner E.L. 2002, ApJ 567, 18
- [211] Zhang L., & Cheng K.S. 1998, MNRAS 294, 729
- [212] Zhang L., Cheng K.S. & Fan J.H 2001, PASJ 53, 207 \chapbblnamechapbib \chapbibliographylogic