Far UV Spectra of Fast Coronal Mass Ejections Associated with X-class Flares
Abstract
The Ultraviolet Coronagraph Spectrometer (UVCS) aboard the SOHO satellite has observed very fast Coronal Mass Ejections (CMEs) associated with X-class flares. These events show spectral signatures different than those seen in most other CMEs in terms of very rapid disruption of the pre-CME streamer, very high Doppler shifts and high temperature plasma visible in the [Fe XVIII] emission line. This paper describes three very similar events on 21 April, 23 July and 24 August 2002 associated with X-class flares. We determine the physical parameters of the pre-CME streamers and discuss the geometrical and physical nature of the streamer blowouts. In the 21 April event, the hot plasma seen as [Fe XVIII] is not related to the structure seen in [Fe XXI] by SUMER at lower heights. It has the form of a rapidly expanding fan, quite likely a current sheet. In the August event, on the other hand, the [Fe XVIII] is probably a bubble of hot plasma formed by reconnection in the wake of the CME. C III emission from the July 23 flare is detected as stray light in the UVCS aperture. It precedes the hard X-ray brightening by about 2 minutes.
1 Introduction
Coronal Mass Ejections (CMEs) span a range in speed from below 100 to 2500 (e.g. St. Cyr et al. 2000; Gallagher et al. 2003). They can occur with or without a powerful flare and with or without a prominence eruption, but the fastest, most powerful CMEs seem to be associated with flares (e.g. Moon et al. 2002). It is plausible that the largest flares and the most energetic CMEs would arise from active regions where a great deal of energy is stored in stressed magnetic structures. It is therefore important to investigate how CMEs associated with X-class flares differ from other CMEs, especially as the fast CMEs can strongly affect the near-Earth environment.
A few CMEs were observed in the UV with Skylab and SMM (Schmahl & Hildner 1977; Fontenla & Poland 1989). Extensive observations of CMEs in the ultraviolet became possible with the launch of the SOHO satellite, which carries 3 UV spectrometers. These observations show bright emission from relatively cool gas originating in ejected prominences (e.g., Ciaravella et al. 1997, 2000). More rarely, they show [Fe XVIII], [Fe XIX] and [Fe XXI] lines indicating temperatures above K (Innes et al. 2002; Raymond 2002). In a few cases, broad UV line profiles show coronal shock waves associated with Type II bursts (Raymond et al. 2000; Mancuso et al. 2002). Doppler shifts exceeding 1000 have been observed, and Doppler velocities sometimes reveal helical structures and rapid rotation (Ciaravella et al. 2000; Pike & Mason 2002).
Here we present UVCS (Kohl et al. 1995; 1997) observations of 3 very fast CMEs. Their UV signatures were quite different from those of other events we have observed. All three show transient brightenings in the [Fe XVIII] line and little or none of the cool gas that usually dominates UVCS spectra of CMEs. In all three cases the pre-CME streamer is violently disrupted. The O VI line profiles split into strongly red- and blue-shifted components, and the region of split profiles along the spectrograph slit grows rapidly. The components of the split profiles are relatively narrow, indicating a lack of strong shock heating.
The three events were associated with X-class flares on 21 April, 23 July and 24 August 2002. They are among the best-observed events in recent history. Thanks to the Max Millenium campaign, EUV images and spectra from the SOHO and TRACE satellites along with numerous ground-based radio and optical observations complement the hard X-ray images and spectra from the RHESSI satellite. The 21 April event and its effects on the upper atmosphere were also observed by the TIMED satellite. Strong Solar Energetic Particle events were associated with the West limb events on 21 April and 24 August. The July event on the East limb was presumably not magnetically connected to the Earth.
The following sections describe the observations, then discuss the physical parameters of the pre-CME streamers, the implications of the split O VI profiles, the structure and evolution of the events in 3 dimensions inferred from the Doppler shifts, and the nature of the [Fe XVIII]-emitting plasma.
2 Observations
All three events occurred in active regions targeted by the Max Millenium campaign. In all three cases, UVCS used the observing sequence designated for Major Flare Watches. The UVCS slit was placed 1.64 R⊙ from Sun center at the position angle directly above the target active region. The 100 micron slit width delivered a spectral resolution of 0.4 Å and a spatial resolution of 28″ in the radial direction. In order to maximize spectral coverage within telemetry limitations, the data were binned to 42″ along the slit length. Five wavelength panels on the OVI detector covered the intervals 942-963, 966-980, 990-994, 997-1008 and 1023-1042 Å. These intervals are chosen to include the lines Ly, Ly and Ly along with O I 989, 991, [Si VIII] 945, 949, [Si IX] 950, C III 977, N III990, 992, O VI 1032, 1037 and [Fe XVIII] 974. The Si XII 499, 521 doublet is detected in second order, and the Fe XV 461 line is detectable if it is sufficiently bright.
Data calibration is described by Gardner et al. (2002). Because all these observations were taken with a very narrow occulter width exposing only about 2.4 mm at the edge of the mirror, we have corrected for degradation of that small part of the mirror (Gardner et al. 2002). For the particular mirror and internal occulter positions chosen for these observations there is a small contribution of stray light from the disk in the Ly line. We account for this by measuring the C III 977 intensity, which is pure stray light, and multiplying by the ratio of Ly to C III measured on the disk (0.74; Vernazza & Reeves 1978). This stray light contribution is under 10% in the streamers but can approach 30% at the ends of the slit where the intrinsic Ly emission is weak. For each event, a series of 120 second exposures was obtained with about 10 seconds for readout between exposures.
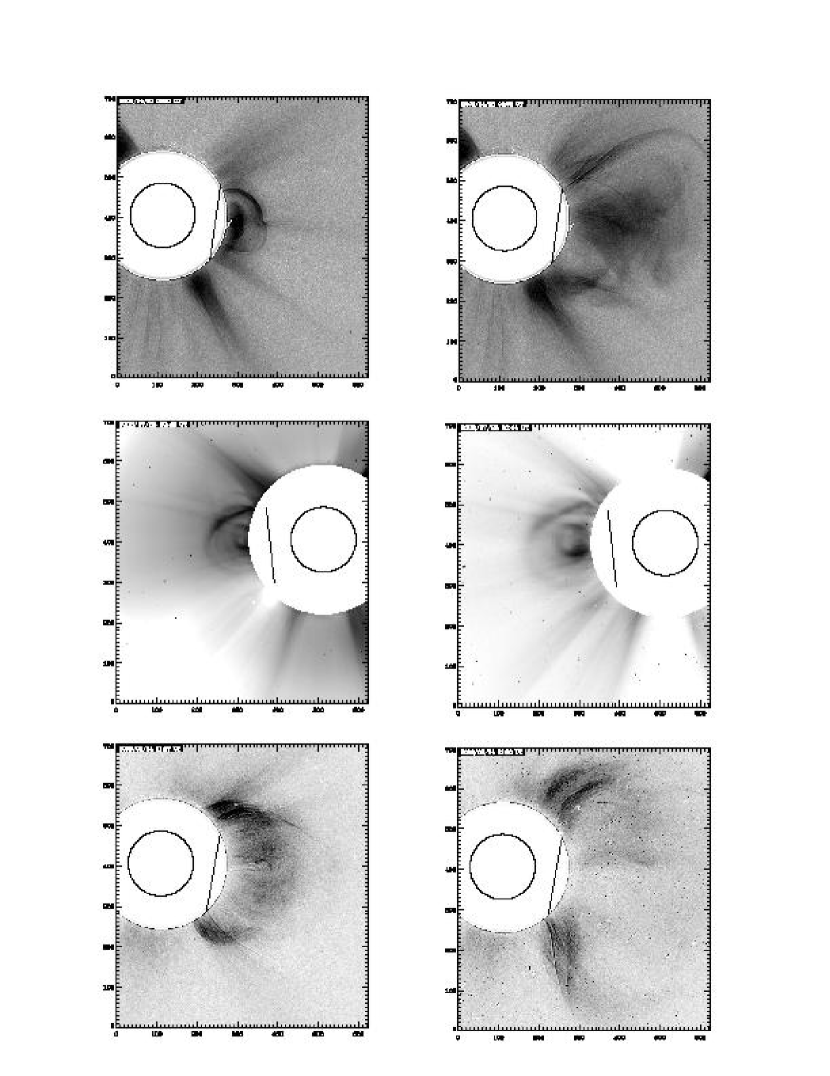
We now briefly describe the three individual events. Figure 1 shows a pair of LASCO C2 images for each eruption. The contrast of the April and August events was enhanced by wavelet analysis. The images for the July event were part of a polarization sequence, and they have not been enhanced.
21 April: As part of the Max Millenium campaign, the UVCS instrument was pointed above Active Region NOAA AR 9906 at a position angle PA=262∘ east of solar north. The series of 120 second exposures began many hours before the event and lasted until 01:55 UT. At that time UVCS began its minisynoptic program, which observes at 8 position angles around the Sun. At the first of these position angles, 270∘, a set of four 120 second exposures was obtained at 1.7 R⊙ followed by 4 exposures at 1.52 R⊙. These exposures covered the wavelength ranges 1023-1043, 998-1001 and 971-985 Å. The last of these also covered the range 1208-1221 Å by way of the redundant mirror, so that it included the Ly line.
The GOES X1.5 class X-ray flare began at 00:59 UT and peaked at 01:31 UT while the active region was located at latitude S14 and longitude W84. It was accompanied by Type II and Type IV radio bursts, a partial halo CME and a solar proton event. The CME speed reached 2500 , but at the time it crossed the UVCS slit the speed was 1000 and the acceleration near its peak value of 1500 based on a combination of TRACE, UVCS and LASCO data (Gallagher et al. 2003). RHESSI observations and TRACE images showed a rapidly growing arcade of loops beneath a spiky structure (Gallagher et al. 2002). The TRACE observing band includes both strong Fe XII emission lines, probably responsible for the bright loops, and an Fe XXIV line formed at about K, that probably accounts for the higher spiky structure. The hard X-ray source moved upwards at a few , which fits in with the standard picture of double ribbon flares (see, for instance, the review by Low 2001). RHESSI data also showed gamma ray emission from the Earth’s atmosphere due to the impact of energetic particles (Share et al. 2002). Simultaneous SUMER observations detected Doppler-shifted emission in both very cool and very hot lines, C II to [Fe XXI] (Wang et al. 2002). The C II emission showed a jet at the flare onset, while the [Fe XXI] emission showed modest Doppler shifts from a relatively slowly rising loop. A shock from this event was recorded by the CELIAS/PM on 23 April at 04:08 UT.
23 July: The target region AR 0039 was near the east limb at latitude S13 and longitude E72 when an X4.8 flare occurred, beginning at 00:23 UT and reaching a peak at 00:29 UT. It was accompanied by Type II and Type IV radio bursts. LASCO reported a fast halo CME whose leading edge was relatively faint and which showed little bright emission. The LASCO images indicate a very fast CME, though the leading edge is poorly defined. The leading edge may already be beyond the edge of the C2 field in the first image in which the CME is visible, giving a lower limit of about 1000 . Comparison of the LASCO C3 images with the start time of the flare gives an average speed of 2200 . The CME opening angle was nearly 180∘, and there was no bright central core. UVCS was pointed at PA=96.1∘ during the event. X-ray spectra from RHESSI show a departure from a pure power law, indicating a combination of an increased column of ionized gas consistent with chromospheric evaporation, though the photospheric albedo could also account for some of the difference from a power law (Kontar et al. 2003). RHESSI observations of the 511 keV line profile indicate positron annihilation at very high densities at transition region temperatures (Share et al. 2003).
24 August: The target was AR 0069, the subject of a Major Flare Watch at a position angle of 260∘. The X3.1 flare at S02, W81 began at 00:49 UT and peaked at 01:12 UT, and it was accompanied by Type II and Type IV radio bursts. LASCO images show a fast, bright loop with some trailing material. LASCO C2 and C3 images indicate a speed of 1700 for the faint outermost loop. The brighter emission that fills much of the CME volume is moving about 2/3 as fast. CELIAS/PM recorded a shock associated with CME on 26 August at 10:20 UT. The UVCS observations began long before the X-ray flare and continued through 06:49 UT.
2.1 Overview
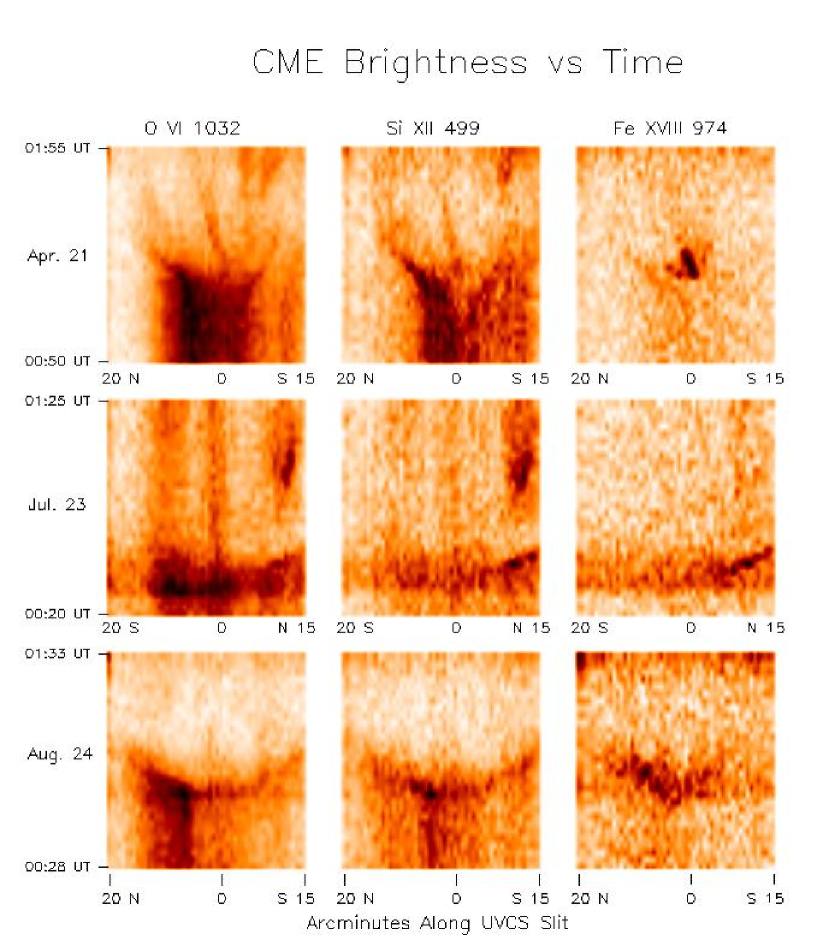
Figure 2 shows the intensity along the UVCS slit as a function of time for each of the 3 events. In each case a 65 minute interval is shown in the intensities of the O VI 1032, Si XII 499 and [Fe XVIII] 974 lines. The horizontal axis is the position along the UVCS slit. (Note that North and South are reversed for the July 23 event, but slit center is still indicated by 0.) In all three cases relatively bright O VI emission originating in the active region streamer is seen near the center of the slit before the event. Si XII is reasonably bright in the pre-CME streamers on 21 April and 23 August. [Fe XVIII] is present, but barely detectable, in the 21 April and 24 August streamers.
In the July 23 (and to a lesser extent the Aug. 24) event, a sudden brightening can be seen across the entire length of the slit. This is due to increased scattering of photons from the solar disk due to the brightening of the flare. In the [Fe XVIII] and Si XII panels this scattered contribution is grating-scattered Ly. As mentioned above, some stray light from the solar disk is detected in C III 977. Before the flare it is detected at a level of about averaged over the length of the UVCS slit. Between 00:22 and 00:26 UT the brightness doubles, and it peaks at in the exposure lasting from 00:26;12 to 00:28:12 UT (Figure 3). It then fades over the course of about 15 minutes. The C III brightening implies a large emission measure of K gas during the time interval when RHESSI observed the positron annihilation line originating in dense gas at transition region temperatures (Share et al. 2003). While the C III temporal profile supports the idea of dense gas in the K range, it is interesting that the C III brightening begins 2-6 minutes before the hard X-ray brightening reported by Share et al., and the C III emission peaks in the exposure that spanned the 2 minutes before the hard X-ray rise. The times given by the UVCS data files are updated monthly to the SOHO spacecraft computer time, and they are accurate to about 15 seconds. The fact that C III brightening precedes the hard X-ray brightening suggests that the dense transition region gas is heated by lower energy electrons or by protons.
In the O VI lines the brightening is not stray light. The excess O VI brightness above the pre-CME values shows a 4:1 intensity ratio between the 1032 and 1037 Å lines, indicating resonance scattering of O VI photons from the disk by O VI ions in the corona. In the August event (and in the northern section of the July event), brightening in Si XII along the leading edge just after the scattering enhancement indicates enhanced local collisional excitation, and this would probably apply to the O VI emission as well. We discuss below whether this results from shock compression or from denser material brought into the UVCS field of view from lower heights.
The scattered light components last for only a few exposures before the streamers are disrupted by the expanding CMEs, leaving only a few wisps of material in O VI and Si XII. The edge of the CME bubble along the slit can be seen as the concave upward emission rim in each event. Small, transient [Fe XVIII] features appear in the 21 April and 23 July events, in both cases lasting only a few frames. In the August 24 event, more diffuse transient emission appears to occupy a significant fraction of the CME volume just behind the front.
Figure 4 displays the intensities of several lines against time to give a quantitative version of some of the information in Figure 2. In each case we have averaged several spatial bins along the slit chosen to include the brightest [Fe XVIII] emission. The spatial regions chosen are 105″ south to 105″ north, 147″ to 987″ north, and 315″ to 735″ south of slit center for the April, July and August events, respectively. The larger spatial averages were needed for the July and August events because of their fainter emission.
It is clear that the three events have similar time histories, though the evolution of the faint July event is less clear. In each case the brightness is constant before the event. The O VI emission suddenly brightens by 10% to 50% for a few hundred seconds, then drops to 0.1 to 0.75 times the pre-CME value. Si XII brightens just after the O VI emission in the August event, but does not brighten in the other two. Had we chosen somewhat different spatial regions along the slit, Si XII brightening would have appeared in all three. In all three events, the Si XII dims rapidly in a manner similar to the O VI emission. In the July event, the Si XII and O VI brightnesses recover about half an hour after the initial dimming. In all three cases, a transient brightening is [Fe XVIII] occurs just after the dimming in O VI and Si XII.
The steep drop in O VI and Si XII emission corresponds to disruption of the streamer. The streamer gas is displaced by CME material of either lower density or of different ionization state. The CME plasma cannot be lower in ionization state, as that would show up as bright emission in the Lyman lines, O VI or C III. In the April and July events, higher temperature gas is revealed by the [Fe XVIII] brightening, but only in a restricted region along the slit. Only in the case of the August event does [Fe XVIII] emission fill much of the region behind the leading edge. We discuss the densities in more detail below, but conclude that the sharp drop in intensities in the April and July events results from a density drop, presumably corresponding to the CME void. In the July event a feature appears in Si XII and O VI at about 00:56 UT. It is blue-shifted by about 300 . Still later, at 02:17 UT, another small transient feature appears, this time in the low temperature lines O VI and C III and blue-shifted by about 150 . Both features seem to be among the many approximately radial features seen in LASCO C2 images.
Finally, all three events show [Fe XVIII] emission, and this is fairly unusual among CMEs observed by UVCS. Bright, narrow [Fe XVIII] emission features in the wakes of 2 CMEs have been observed to last for many hours (Ciaravella et al. 2002; Ko et al. 2003), and these have been attributed to the current sheets beneath expanding flux ropes predicted by several CME models (e.g. Lin & Forbes 2000; Amari et al. 2003; Webb et al. 2003; Roussev et al. 2003). A more diffuse cloud of [Fe XVIII] emission appeared during an event on 26 October, 2000 (Raymond 2002). In general, however, CMEs observed at heights above 1.5 R⊙ show low ionization material such as C III and O VI rather than high temperature gas. In all three events, the [Fe XVIII] appears after the disruption of the streamer seen in O VI and Si XII, indicating that it is “inside” the CME. However, the morphologies of the [Fe XVIII] emitting gas are different in the three events. We will discuss the parameters of this hot gas, its location within the CME structure and its physical origin in section 3.4.
3 Analysis
3.1 Atomic Rates and Disk Emission
Analysis of the observed line intensities requires a knowledge of the excitation rates by collisions and by radiation from the solar disk. For the excitation rates we use those of version 4.01 of CHIANTI (Young et al. 2003), except that we use the rates of Raymond et al. (1997) for the Lyman lines. We use the ionization balance of Mazzotta et al. (1998). Disk intensities for the O VI doublet and Lyman lines from Raymond et al. (1997) are multiplied by a factor of 1.85 to account for the increase with solar activity as estimated from the solar cycle dependences reported by Schüle et al. (2000), McMullin et al. (2002) and Woods et al. (2000) A somewhat larger disk flux might be appropriate for these pointings directly above active regions, which could increase the radiative excitation rates and the derived densities by up to 20% (Ko et al. 2002)
3.2 Streamer Parameters
In general the analysis follows the methods used by Raymond et al. (1997), Ciaravella et al. (2002), Ko et al. (2002) and Uzzo et al. (2003), but the CME watch campaign sacrificed spectral coverage for time coverage (using a single grating position) and spatial resolution. As a result, the uncertainties in derived temperatures and abundances are larger.
Figure 5 shows the intensity distributions of several lines along the UVCS slit shortly before each of the CME events. In each case we have averaged 50 exposures to improve the signal for the [Fe XVIII] line.
The April and August streamers show single-peaked broad enhancements in Ly, while in the July streamer, Ly is relatively constant along the UVCS slit. The O VI lines, on the other hand, show double-peaked structures in all three cases. (The O VI 1037 line is not plotted because it is close to 1/3 the intensity of 1032 everywhere.) The structures are reminiscent of quiescent equatorial streamers at solar minimum (Raymond et al. 1997; Uzzo et al. 2003). In those cases the temperatures and ionization states were fairly constant across the streamers, so that the variation in O VI to Ly ratio was attributed to changes in the oxygen abundance, with O depleted within the central streamer core. In the three streamers considered here, variations in the Si XII to [Si VIII] ratio indicate that the ionization state varies across the streamer. Part of the central dip in O VI in the April streamer and the weakness of the O VI peak at -1 arcmin in the July streamer clearly results from higher average ionization states.
We have extracted spectra of 2 or 3 regions along the slit for each streamer for further analysis. For April 21 we choose the bright O VI peak near -7′ and the O VI minimum near -1′. For the July streamer we take the O VI and Si XII peak at -10′ and the O VI dip at -4′, and for the August streamer the O VI peak at -8′, the Si XII peak at -1′ and the O VI dip at -4 arcmin. The spectra are presented in Table 1. Extraction intervals and derived parameters are shown in Table 2.
Table 2 also shows the Ly and Ly intensities corrected for stray light (see section 2). We also show the intensity ratio of the O VI doublet, which gives the ratio of the collisional contribution (2:1) to the resonance scattering component (4:1). Provided that the outflow speed is small, which is a good approximation at this height (Strachan et al. 2002), the ratio of collisional to radiative contributions gives a density (Kohl & Withbroe 1982), which is also listed in Table 2. Both the O VI doublet ratios and the densities are quite similar among all the features observed. The densities are intermediate between those of solar minimum equatorial streamers (Strachan et al. 2002) and densities at a similar height above a very hot active region (Ko et al. 2002). They are similar to densities at 1.6 R⊙ in streamers at solar maximum (Parenti et al. 2000).
Crude estimates of average temperatures were obtained from the ratios of [Si VIII] to Si XII. Not surprisingly, the derived temperatures fall between log T = 5.9, the emission peak of [Si VIII] and log T = 6.3, the peak of Si XII emissivity. While the values are similar to streamer temperatures near K derived with much more extensive sets of emission lines (e.g. Raymond et al. 1997; Feldman et al. 1998; Parenti et al. 2000), the trend among the features observed is more significant than the numerical value for any feature. The width of Ly puts an upper limit of about K on the ion temperature. However, faint [Fe XVIII] emission is detectable in the April 21 streamer leg and at all 3 positions in the August 24 streamer. This indicates the presence of a small amount of gas at log T 6.4. The limited spectral range of this observing sequence makes determination of a differential emission measure curve possible, but ambiguous. In general, flat differential emission measures over the range log T = 6.1 to log T = 6.3 can match the spectra without [Fe XVIII], and a somewhat smaller amount of gas at log T 6.4 provides the [Fe XVIII] emission. Table 2 also shows the emission measures derived from the Ly fluxes assuming the densities in Table 2 and an average temperature Log T = 6.2. In each case, combining the density with the emission measure yields a thickness of the emitting regions of order 0.5 R⊙.
We have also used the ratios of O VI to Ly to estimate the absolute abundance of oxygen. Because we do not have Ly intensities, we cannot separate the collisional and radiative components of Ly, as was done by Ciaravella et al. (2002) and Ko et al. (2002). The Ly to Ly ratio could be used in principle, but this ratio is much less sensitive to the radiative to collisional ratio, and there are larger uncertainties in both measurements and atomic rates. Therefore, we use the density and temperature estimates from Table 2 to compute total emissivities for the Ly and O VI lines. That means that abundance results shown in Table 2 are not as accurate as those from studies designed to measure abundances. Nevertheless, they show a distinct difference from both solar minimum streamers and hot active region streamers studied at this height (Raymond et al. 1997; Ko et al. 2002; Ciaravella et al. 2002; Uzzo et al. 2003) where the oxygen abundance is roughly 1/3 photospheric in the streamer legs and 1/10 photospheric in the streamer cores. Here the abundances are about 3 times larger, and similar to those derived by Parenti et al. (2000) for a streamer in June 2000. The low abundances in the other streamers were attributed to gravitational settling, and it was suggested that coronal and chromospheric material must be mixed on about a 1 day time scale to account for the observed depletions. The higher abundances in the streamers associated with powerful flares and CMEs may indicate mixing with chromospheric material on a shorter time scale due to the high activity levels in these regions. Abundances for Si and Fe are more difficult to determine because the lines of those elements are formed above and below the average temperature, so they depend upon the details of the emission measure distribution. In general, however, they suggest First Ionization Potential (FIP) enhancements of about 3, a typical streamer value (e.g. Raymond et al. 1997; Parenti et al. 2000; Ko et al. 2002; Uzzo et al. 2003)
3.3 Streamer Blowout
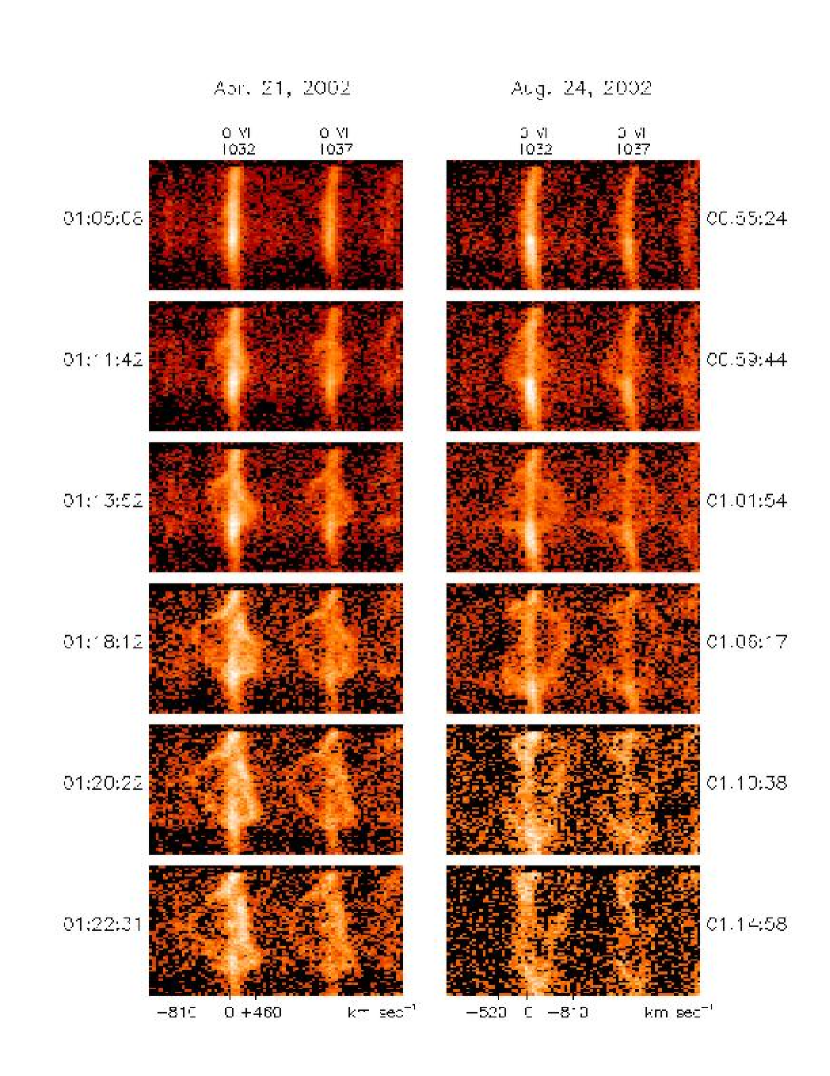
Figure 6 shows the spectral region near the O VI 1032 emission lines for the April and August CMEs at six times; just before the eruption and at 5 times over the following 15 minutes. The July event is not shown because, although it appears to be similar, the O VI intensities are smaller by roughly the ratio of the pre-CME streamer intensities, and therefore the signal-to-noise is poor. The Si XII 499 line in the August event evolves in a manner nearly identical to that of the O VI lines, but because the count rate is smaller than that of O VI by a factor of 4, the signal-to-noise is not as high. Ly also seems to show the same disruption, but the count rate is even smaller.
In both CMEs, the region near the slit center is the first to be affected, as emission at line center dims and strongly red-shifted and blue-shifted components appear. The disturbance spreads rapidly along the slit, and Doppler shifts reach +500 and -850 in the 21 April event, or -500 and +810 on 24 August. On 21 April on the red side, the Doppler shift peaks about 7 minutes after the red-shifted component appears, then declines to roughly +150 . On the blue side, the Doppler shifts seem to reach asymptotic speeds of 750 to 850 , and the emission simply fades away. The fact that blue-shifts are larger than red-shifts on 21 April implies a skewness towards the Earth, perhaps related to strength of the observed near-Earth effects.
The long slit spectra in Figure 6, particularly the spectrally narrow red- and blue-shifted peaks, imply that the O VI emitting gas is concentrated in relatively thin sheets. These are presumably the higher oxygen abundance regions seen as the brightness peaks in the intensity distributions along the slit. The dimming at line center corresponds to displacement of the streamer by either the oxygen-depleted closed field core or the low density CME void. Doppler dimming of O VI in the moving plasma further reduces the O VI brightness (Noci, Kohl & Withbroe 1987).
For about the first 500 seconds, the disturbance spreads along the slit at a rate of about 500 in each direction, comparable to the speeds of the CME fronts at this height. The 1000 total motion along the slit is a little smaller than full range of the Doppler shift velocities. The Doppler shifts are made up of two contributions; the expanding motion of the magnetic structure along the line-of-sight (LOS) and the LOS component of plasma motion along the field. The similarity of the Doppler expansion and the expansion along the slit suggests that, at least at this stage, outflow along the field lines is a smaller contribution than transverse expansion of the magnetic structure. The LASCO C2 images of the July and August events give a strong impression of transverse expansion, while the April event has more of the appearance of a cloud of ejected plasma.
A slab of the corona that is 0.25 R⊙ thick having the density derived above and lateral dimensions of about 1 R⊙ would weigh about grams, or the mass of a modest CME (e.g. Hundhausen 1997). Thus the disrupted streamer could account for much of the CME mass. However, as pointed out above, it is not clear how much of the displaced mass is ejected and how much is merely pushed aside.
The generally narrow O VI profiles also indicate that O VI is not heated to high temperatures. Single-peaked line profiles about 900 wide have been observed in CME-driven shocks (Raymond et al. 2000; Mancuso et al. 2002). It is difficult to assign definite line widths to the red- and blue-shifted components of O VI in the X-class flare related events, but they are no more than 100-200 wide, and some of that width must be attributed to bulk motion of the plasma. The absence of shock heating is in keeping with the appearance of gradual acceleration as the Doppler shifts increase to their final values over the course of several exposures. The apparent lack of a shock suggests a fast mode speed faster than the CME speed. With the densities derived above, a fast mode speed above 1000 requires Gauss. This is comparable to the field strength at this height in solar minimum streamers (e.g. Li et al. 1998), and active region streamers should have stronger fields.
3.4 Hot Plasma
The three CMEs associated with X-class flares are unusual among CMEs observed by UVCS in that they show [Fe XVIII] emission, which peaks at log T = 6.7-6.8 in ionization equilibrium. UVCS spectra of some events show bright, narrow [Fe XVIII] emission features that last many hours Ciaravella et al. (2002); Ko et al. (2003). These are identified with the current sheets predicted by many flux rope models of CMEs (e.g. Lin & Forbes 2000; Manchester 2003; Amari et al. 2003; Roussev et al. 2003). It is perhaps surprising that [Fe XVIII] emission is not observed more frequently, in that an abnormally high ionization state is a common signature of CME material measured in situ Lepri et al., (2001). Thus these events may help to link coronal and interplanetary observations of CMEs.
The spatial distributions of the [Fe XVIII] brightness are different in the 3 events. The April event shows a relatively bright, sharply defined feature about 2′ across. The bright emission is visible in 4 exposures (8 minutes) and more diffuse emission persists for another two exposures. The [Fe XVIII] emission is close to, but not cospatial with, a narrow feature seen in O VI and Si XII that persists for a longer time (Figure 2). The [Fe XVIII] appears three exposures (6 minutes) after the O VI profile begins to split, placing it well inside the CME front. The first appearance of [Fe XVIII] is about 15 minutes after the flare onset, well before the flare peak.
Only the April event has high enough signal-to-noise to yield a good line profile. This is shown in Figure 7. The line width is about 1.5 Å or 450 . It could be comprised of separate peaks near +150 and -210 , but examination of the individual exposures indicates that it is a single broad profile.
During the July eruption, only a brief episode of [Fe XVIII] emission occurs, lasting for two exposures near the northern end of the slit. However, a narrow emission region does appear later at about 01:55 UT, and it persists for about 1/2 hour. This emission may be related to the current sheets described by Ciaravella et al (2002) and Ko et al. (2002b). It appears sooner after the eruption and lasts for a shorter time than the other UVCS current sheets or the white light current sheets described by Webb et al. (2003). This is probably related to the very high CME speed. The lengths of current sheets are expected to depend on CME speed and on background coronal density (Lin 2002), with a high CME speed implying a short duration for the current sheet.
The August event shows a much more diffuse [Fe XVIII] region extending perhaps 15′ along the slit. As in the April event, the [Fe XVIII] peaks several exposures after the O VI and Si XII peaks, appearing as a shell or loop inside the expanding O VI volume. In the August event, the O VI and Si XII intensities begin to fade at 01:06 UT when the CME removes streamer material from the line of sight. The transient feature appears at 01:16 UT, reaching in Ly, Si XII and [Fe XVIII], respectively. For solar photospheric abundances and ionization equilibrium, the line ratios imply 6.7 log T 6.9 and an emission measure of . If the structure is more or less cylindrical and the transverse scale is about 0.5 R⊙, the emission measure and length scale imply a density near . If the emitting region is an arcade seen end-on, the density could be somewhat smaller.
There are two plausible interpretations for the observed hot gas. Since Fe XVIII is sometimes seen in X-ray spectra of active regions (e.g., Rugge & McKenzie 1985), the [Fe XVIII] might be produced by ejected active region material in the form of expanding loops. On the other hand, there is obviously strong impulsive heating in these events, and the [Fe XVIII] may arise from cooler gas that is heated by reconnection. In particular, current sheets are predicted either above the main CME volume, for instance in the breakout model of Antiochos et al. (1999), or beneath the main CME magnetic flux rope in both breakout model and flux rope models such as those of Lin & Forbes (2000) and Amari et al. (2003). Hot plasma may be found in the current sheet itself or on the magnetic field lines that have undergone reconnection. The “breakout” model of Antiochos et al. (1999) predicts that such plasma forms the flux ropes detected in interplanetary space as reconnection transforms a sheared arcade into a helical structure. The model of Lin & Forbes (2000) starts with a pre-existing flux rope, but reconnection forms a “bubble” of heated plasma of comparable size around it (Lin, Raymond & van Ballegooijen 2003).
In all three cases the [Fe XVIII] emission appears after the onset of Doppler splitting of the O VI lines, implying that it lies inside or beneath the main CME volume and cannot arise in an overlying current sheet that initiates the breakout. This does not imply that such a current sheet does not exist, only that is not bright enough to be detectable.
In the April event, the [Fe XVIII] emission is concentrated in a feature as small as 84″ along the slit. This is most naturally interpreted as a loop seen end-on, as one leg of a loop, or as a current sheet seen end-on. The broad line profile roughly centered on zero velocity argues against the interpretation in terms of a single leg of a loop, so the structure must be seen end-on. If the profile were interpreted as two peaks at -150 and +210 an expanding loop would be the natural interpretation. However, examination of the individual spectra shows that each spectrum has a broad profile with blue-shifted or red-shifted emission dominating in different exposures. This implies that a fan of emission seen nearly edge-on is the natural interpretation, favoring the idea that the hot gas resides in a current sheet. A 1000 upward motion and opening angle in the plane of the fan would account for the line profile. The duration of about 800 seconds implies a height of just over 1 R⊙ if the gas is moving at 1000 . The [Fe XVIII] emitting gas appears in the fourth of the exposures that show splitting in the O VI lines, at about the time that the maximum redshift was seen but before the blueshift reached its maximum. This places the top of the [Fe XVIII] curtain about 1 R⊙ behind the top of the CME, perhaps near the bottom of the flux rope described in the Lin & Forbes (2000) model.
An interesting possibility within the context of current CME models is that the [Fe XVIII] comes from the region where plasma accelerated in the current sheet encounters the trailing edge of the flux rope. The plasma is expected to be moving at a few hundred relative to the CME structure, and it is compressed and heated when it encounters an obstacle. The [Fe XVIII] surface brightness of in a region as small as 82″ can be combined with the emissivity of the line and a depth estimate of 0.5 R⊙ to give a density of about . If the sheet is thinner than about 0.1 R⊙ the density may be higher. The density results from compression as material flows into the current sheet. This interpretation is compatible with either the breakout or flux rope models.
In the August event the curved morphology of the [Fe XVIII] emission just inside the O VI and Si XII emission (Figure 2) strongly suggests expanding hot plasma driving the cooler gas in the upper regions of the streamer. The density is a factor of 5 higher than that of the pre-CME streamer, a marginally higher density contrast than the factor of 4 for a strong shock. The idea of a shock producing the [Fe XVIII] while the O VI split profiles show the absence of shock heating appears contradictory, However, streamer cores are generally believed to be high plasma (e.g. Li et al. 1998; Suess & Nerney 2002; Endeve, Leer & Holzer 2003), while the streamer legs are lower . Thus the disturbance could be super-Alfvénic in the core of the streamer, but sub-Alfvénic in the legs where O VI is formed. Thus a shock interpretation is possible in principle. However, to the extent that line profiles can be seen in the data the [Fe XVIII] feature appears to be fairly narrow, indicating a lack of shock heating.
Therefore, the [Fe XVIII] in the August event is primarily denser gas rising from below rather than compression of existing coronal gas. The hot plasma could lie on an arcade of expanding loops directly tied to the photosphere. However, the first LASCO image showing the CME gives a clear impression that the dense gas (and it was shown above that the [Fe XVIII] gas is dense) takes the form of a helical flux rope. The flux rope in models having a pre-existing flux rope has low density except perhaps in a cold prominence at the bottom of the magnetic coils, so that most of the flux rope is identified with the CME void (e.g. Gibson & Low 1998). Thus in the context of the flux rope models the [Fe XVIII] appears to be the “bubble” of hot material that forms around the flux rope as reconnection cuts off field lines and heats and injects additional plasma from the current sheet (Lin et al. 2003). The existence of this bubble is required by the standard flux rope models (e.g. Lin & Forbes 2000; Amari et al. 1999, 2003, Roussev et al. 2003), but detailed predictions for its density and temperature are not yet available. It is not clear whether the “bubble” can be distinguished from the pre-existing flux rope by either magnetic characteristics (e.g. pitch angle) or by plasma composition. Similarly, the “breakout” model predicts the formation of a flux rope by reconnection near the base of a sheared arcade, but the detailed properties of the plasma are not yet predicted by the model. In either type of model, the plasma properties may depend on the details of magnetic configuration and plasma characteristics in the pre-CME structure.
We note that no obvious current sheet is seen behind the main body of the August CME. This is probably due to a partly face-on viewing angle, which reduced the surface brightness of the thin structure below our detection limit. Thus some of the difference between the April and August events lies in the accident of viewing geometry.
We close the discussion of the hot plasma by noting that the ionization and recombination times of Fe XVIII at the densities derived above are about 3000 seconds, so the gas may not be in ionization equilibrium. The ionization state probably freezes in when the density is about an order of magnitude higher, roughly half way between its ejection point and the height of the UVCS slit. While the excitation rate of the [Fe XVIII] line is relatively insensitive to temperature, comparison of the [Fe XVIII] emission with X-ray observations could determine whether the gas is rapidly cooled by adiabatic expansion or rapidly heated by reconnection. It is unfortunate that there are no simultaneous soft X-ray spectra at 1 keV energies.
4 Summary
We have observed 3 fast CMEs associated with X-class solar flares. A summary of the properties of the flares and CMEs is provided in Table 3. All three events show splitting of the O VI profiles during streamer disruption and transient [Fe XVIII] emission. Both features are unusual among CMEs studied so far by UVCS. The CMEs also show no evidence for the cool prominence material that usually dominates UVCS spectra of CMEs. The existence of a substantial amount of highly ionized gas corresponds well to measurements of the ionization state of ICMEs measured in situ Lepri et al., (2001). While 3 events constitute a small sample, it seems that X-class flares are associated with very fast CMEs which contain little cool filament material.
The O VI lines provide a clear look at streamer disruption in 3D, with line-of-sight speed comparable to the speed at which the disturbance moves along the slit, both speeds are about 1/2 the speed of the CME leading edge in the plane of the sky. The temperature, density and ionization state of the pre-CME streamers are similar to those observed above hot, bright active regions. The streamer masses are comparable to typical CME masses, so the pre-CME conditions provide a useful comparison for in situ measurements of these quantities in the CMEs and in the associated energetic particles. However, it appears that the shocks had not formed at 1.6 R⊙ due to fairly strong magnetic fields.
In the 21 April event, a small transient feature seen in [Fe XVIII] is most easily identified with the current sheet predicted by CME models. In the 24 August event the more diffuse [Fe XVIII] emission is apparently hot plasma that drives the expansion of the streamer legs seen in O VI. The [Fe XVIII] plasma probably comprises the “bubble” of reconnected field lines that surround the original flux rope (Lin et al. 2003) or the reconnected field lines that are forming the flux rope (Antiochos et al. 1999).
This work is based on observations with the UVCS and LASCO instruments aboard the SOHO satellite. We thank the instrument teams and the SOHO flight operations team. The work benefited from workshop organized by the TIMED team at APL. The analysis was supported by NASA Grants NAG5-11420 and NAG5-12827 to the Smithsonian Astrophysical Observatory. The authors thank L. Gardner, J. Kohl, R. Wu, T. Forbes and H. Hudson for especially helpful discussions.
References
- Amari et al. (2003) Amari, T., Luciani, J.F., Aly, J.J., Mikic, Z., & Linker, J. 2003, ApJ, 585, 1073
- Antiochos, Devore & Klimchuk (1999) Antiochos, S.K., Devore, C.R., and Klimchuk, J.A. 1999, ApJ, 512, 985
- Ciaravella et al. (1997) Ciaravella, et al. 1997, ApJL, 491, 59
- Ciaravella et al. (2000) Ciaravella, A., et al. 2000, ApJ, 529, 575
- Ciaravella et al. (2002) Ciaravella, A., Raymond, J.C., Li, J., Reiser, P., Gardner, L.D., Ko, Y.-K., & Fineschi, S. 2002, ApJ, 575, 1116
- Dere et al. (2001) Dere, K.P., Landi, E., Young, P.R. and Del Zanna, G. 2001, ApJS, 134, 331
- Endeve, Leer & Holzer (2003) Endeve, E., Leer, E., & Holzer, T.E. 2003, preprint
- Feldman et al. (1998) Feldman, U. Schüle, U., Widning, K.G., & Laming, J.M. 1998, ApJ, 505, 999
- (9) Fontenla, J.M., & Poland, A.I. 1989, Sol. Phys. 123, 143
- Gallagher et al. (2002) Gallagher, P.T., Dennis, B.R., Krucker, S., Schwartz, R.A., & Tolbert, A.K. 2002, Sol. Phys., 210, 341
- Gallagher et al. (2003) Gallagher, P.T., Lawrence, G.R., & Dennis, B.R 2003, ApJL, 588, L53
- Gardner et al. (2002) Gardner, L.D., et al. 2002, in The Radiometric Calibration of SOHO, A. Pauluhn, M.C.E. Huber & R. von Steiger, eds. (Noordwijk: ESA), p. 161
- Gibson & Low (1998) Gibson, S.E., and Low, B.C. 1998, ApJ, 493, 460
- Hundhausen (1997) Hundhausen, A.J. 1997, in Coronal Mass Ejections, N. Crooker, J.A. Jocelyn & J. Feynman, eds. (Washington: AGU), p. 1
- Innes et al., (2001) Innes, D.E., Curdt, W., Schwenn, R., Solanki, S., Stenborg, G., & McKenzie, D.E. 2001, ApJL, 549, 249
- Ko et al. (2002) Ko, Y.-K., Raymond, J.C., Li, J., Ciaravella, A., Michels, J., Fineschi, S., & Wu, R. 2002, ApJ, 578, 979
- Ko et al. (2003) Ko, Y.-K., Raymond, J.C., Lin, J., Lawrence, G., Li, J., & Fludra, A. 2003, ApJ, in press
- Kohl & Withbroe (1982) Kohl, J.L., & Withbroe, G.L. 1982, ApJ, 256, 263
- Kohl et al. (1995) Kohl, J.L., et al. 1995, Solar Phys., 162, 313
- Kohl et al. (1997) Kohl, J.L., et al. 1997, Solar Phys., 175, 613
- Kontar et al. (2003) Kontar, E.P., Brown, J.C., Emslie, A.G., Schwartz, R.A., Smith, D.M., & Alexander, R.C. 2003, preprint
- Lepri et al., (2001) Lepri, S.T., Zurbuchen, T.H., Fisk, L.A., Richardson, L.G., Cane, H.V., & Gloeckler, G., 2001, JGR, 106, 29231
- Li et al. (1998) Li, J., Raymond, J.C., Acton, L.W., Kohl, J.L., Romoli, M., Noci, G., & Naletto, G. 1998, ApJ, 506, 431
- Lin (2002) Lin, J. 2002, ChJAA, 2,539
- Lin & Forbes (2000) Lin, J., and Forbes, T.R. 2000, JGR, 105, 2375
- (26) Lin, J., Raymond, J.C., & van Ballegooijen, A. 2003, ApJ, submitted
- Low (2001) Low, B.C. 2001, JGR, 106, 25141
- Low & Zhang (2002) Low, B.C., & Zhang, M. 2002, ApJL 564, L53
- Manchester (2001) Manchester, W. IV 2001 ,ApJ, 547, 503
- (30) Mancuso, S., Raymond, J.C., Kohl, J., Ko, Y.-K., Uzzo, M., & Wu, R. 2002, A& A, 383, 267
- Mazzotta et al. (1998) Mazzotta, P., Mazzitelli, G., Colafrancesco, S., & Vittorio, N. 1998, A& AS, 133, 403
- McMullin et al. (2002) McMullin, D.R., Judge, D.l., Phillips, E., Moebius, E., Bochsler, P., Wurz, P., Hillenbach, M., & Ipavich, F. 2002, in SOHO 11 Symposium, ESA-SP -508
- Moon et al. (2002) Moon, Y.-J., Choe, G.S., Wang, H., Park, Y.D., Gopalswamy, N., Yang, G., & Yashiro, S. 2002, ApJ, 581, 694
- Noci, Kohl & Withbroe (1987) Noci, G., Kohl, J.L. & Withbroe, G.L. 1987, ApJ, 315, 706
- Parenti et al. (2000) Parenti, S., Bromage, B.J., Poletto, G., Noci, G., Raymond, J.C., and Bromage, G.E. 2000, A& A, 363, 800
- Pike & Mason (2002) Pike, C.D., and Mason, H.E. 2002, Sol. Phys., 206, 359
- Raymond (2002) Raymond, J.C. 2002, in From Solar Min to Max: Half a Solar Cycle with SOHO, A. Wilson, ed., (Noordwijk: ESA), p. 421
- Raymond et al. (1997) Raymond, J.C., et al. 1997, Sol. Phys. 197, 645
- (39) Raymond, J.C., Thompson, B.J., St. Cyr, O.C., Gopalswamy, N., Kahler, S., Kaiser, M., Lara, A., Ciaravella, A., Romoli, M., & R. O’Neal, R., 2000, GRL, 27, 1493
- (40) Roussev, I.I., Forbes, T.G., Gombosi, T.I., Sokolov, I.V., DeZeeuw, D.L., & Birn, J. 2003, ApJL, 588, L45
- Rugge & McKenzie (1985) Rugge, H.R., & McKenzie, D.L. 1985, ApJ, 297, 338
- Schmahl & Hildner (1977) Schmahl, E.J., & Hildner, E. 1977, Sol. Phys. 55, 473
- Schüle et al. (2000) Schüle, U., Wilhelm, K., Hollandt, J., Lemaire, P., & Pauluhn, A. 2000, A& A, 354, L71
- Share et al. (2003) Share, G.H., Murphy, R.J., Dennis, B.R., Schwartz, R.A., Tolbert, A.K., Lin, R.P., & Smith, D.M. 2002, Solar Physics, 210, 357
- Share et al. (2003) Share, G.H., Murphy, R.J., Skibo, J.G., Smith, D.M., Hudson, H.S., Lin, R.P., Shih, A.Y., Dennis, B.R., Schwartz, R.A. & Kozlovsky, B. 2003, preprint
- St. Cyr et al. (2000) St.Cyr, O.C., Burkepile, J.T., Hundhausen, A.J., & Lecinski, A.R. 2000, JGR, 104, 12493
- Strachan et al. (2002) Strachan, L., Suleiman, R., Panasyuk, A.V., Biesecker, D.A., & Kohl, J.L. 2002, ApJ, 571, 1008
- Suess & Nerney (2002) Suess, S.T. & Nerney, S.F. 2002, ApJ, 565, 1275
- Uzzo et al. (2003) Uzzo, M., Ko, Y.-K., Raymond, J.C., Wurz, P., & Ipavich, F.M. 2003, ApJ, 585, 1062
- Vernazza & Reeves (1978) Vernazza, J.E., & Reeves, E.M. 1978, ApJS, 37, 485.
- Wang et al. (2002) Wang, T.J., Solanki, S.K., Innes, D.E., & Curdt, W. 2002, preprint
- Webb et al. (2003) Webb, D.F., Burkepile, J., Forbes, T.G., & Riley, P. 2003, preprint
- (53) Woods, T.N., Tobiska, W.K., Rottman, G.J., & Worden, J.R. 2000, J. Geophys. Res., 105, 27195
- Young et al. (2003) Young, P.R., Del Zanna, G., Landi, E., Mason, H.E., & Landini, M. 2003, ApJS, 144, 135
Table 1
Line Intensities ()
| ION | April 21 | July 23 | August 24 | |||||
|---|---|---|---|---|---|---|---|---|
| Leg | Core | Leg | Core | Leg1 | Core | Leg2 | ||
| Si VIII | 944.4 | 9.1 | 7.2 | 1.6 | 0.9 | 3.3 | 0.6 | 0.0 |
| Si VIII* | 949.4 | 3.3 | 2.5 | 0.7 | 0.3 | 1.1 | 0.3 | 0.4 |
| Si IX* | 950.2 | 6.8 | 5.5 | 1.7 | 1.5 | 2.7 | 1.1 | 0.7 |
| Ly | 972.5 | 3.2 | 3.8 | 1.4 | 1.6 | 2.0 | 2.6 | 2.8 |
| Fe XVIII | 974.8 | 0.7 | 0.0 | 0.0 | 0.0 | 1.5 | 0.9 | 0.2 |
| C III | 977.0 | 1.1 | 1.3 | 2.8 | 3.2 | 1.7 | 2.2 | 2.3 |
| Si XII | 499.4 | 278.0 | 322.0 | 116.4 | 93.8 | 224.2 | 300.0 | 296.6 |
| Ly | 1025.7 | 18.2 | 24.4 | 8.9 | 8.9 | 14.1 | 16.9 | 12.0 |
| Fe X | 1028.0 | 10.2 | 8.1 | 2.5 | 2.0 | 3.9 | 1.2 | 0.9 |
| O VI | 1031.9 | 652.0 | 506.0 | 202.0 | 173.0 | 312.0 | 165.0 | 182.0 |
| O VI | 1037.6 | 212.0 | 168.0 | 67.4 | 54.6 | 101.0 | 53.6 | 60.6 |
| Si XII | 520.7 | 121.9 | 128.1 | 53.6 | 45.3 | 107.9 | 134.6 | 126.6 |
* Blended with Ly
Table 2
Derived Quantities and Streamer Parameters
| April 21 | July 23 | August 24 | ||||||
|---|---|---|---|---|---|---|---|---|
| Leg | Core | Leg | Core | Leg1 | Core | Leg2 | ||
| Lower Edge1 | -8.75′ | -3.15′ | -11.55′ | -6.65′ | -10.85′ | -5.95′ | -2.45′ | |
| Upper Edge1 | -4.55′ | +0.35′ | -7.35′ | -2.45′ | -5.95′ | -2.45′ | +1.75′ | |
| Ly | 17.4 | 23.5 | 6.85 | 6.55 | 12.9 | 15.3 | 10.3 | |
| Ly | 3.02 | 3.60 | 0.88 | 1.06 | 1.75 | 2.24 | 2.36 | |
| O VI ratio | 3.07 | 3.01 | 3.00 | 3.17 | 3.09 | 3.08 | 3.00 | |
| 197.6 | 166.4 | 67.3 | 44.9 | 92.3 | 49.6 | 60.7 | ||
| 4.8 | 5.3 | 5.4 | 3.9 | 4.5 | 4.6 | 5.4 | ||
| 1.34 | 1.37 | 1.40 | 1.42 | 1.41 | 1.60 | 1.65 | ||
| O/H | 1.06 | 0.60 | 0.81 | 0.78 | 0.70 | 0.31 | 0.48 | |
| EM | 10.4 | 15.2 | 4.6 | 3.3 | 7.3 | 8.8 | 6.9 | |
1 Measured from 0 in Figure 5
2
3
4 K; derived from Si XII/Si VIII ratio
5 Oxygen abundance relative to photospheric
6 Emission Measure
Table 3
Summary of CME properties
| April 21 | July 23 | August 24 | |
|---|---|---|---|
| Flare Class | X1.5 | X4.8 | X3.1 |
| CME speed* | 2500 | 2200 | 1700 |
| * | -850 to +500 | ? | -500 to +810 |
| Energetic Particles | Y | N | Y |
| IP Shock | Y | N | Y |
| 511 keV line | ? | Y | ? |
| Flare C III | N | Y | Y |
| Diffuse [Fe XVIII] | N | N | Y |
| Sharp [Fe XVIII] | Y | Y | N |
| Shocked O VI | N | ? | N |
*