NIR surface photometry of a sample of nearby spiral galaxies
The first results of an observational programme aimed at mapping a sample of face–on spiral galaxies in the NIR are presented. This paper shows the surface photometry of the first ten galaxies in the sample. The data were taken in the broad band (1.2 m) and (2.2 m) filters. The sources were selected mainly according to their size and brightness in order to suit the characteristics of the CAIN 2D NIR camera on the 1.5 m Carlos Sánchez Telescope (Tenerife, Spain). The primary scientific goal is to provide a comprehensive and uniform database of the main structural and photometric parameters of the sample members from NIR surface photometry. To this end, elliptical isophotal fitting was performed on each galaxy image to extract information about the size and location of its morphological components and provide the azimuthally averaged radial brightness profile. Analytical functions for each component’s brightness distribution were then used to match that profile, and their functional parameters obtained from the global fitting. This first report includes data for NGC 3344, NGC 3686, NGC 3938, NGC 3953, NGC 4254, NGC 4303, NGC 4314, NGC 5248, NGC 6384 and NGC 7479.
Key Words.:
Galaxies: structure — Galaxies: individuals: NGC 3344, NGC 3686, NGC 3938, NGC 3953, NGC 4254, NGC 4303, NGC 4314, NGC 5248, NGC 6384, NGC 7479 — Infrared: surface photometry1 Introduction
Surface photometry of external galaxies in the optical domain has burgeoned in recent decades with advent of large format CCD arrays and the popularity of the 2D optical cameras. Data have been amassed since then for a wide range of astrophysical studies, from morphological classification (van der Kruit & Searle 1981, 1982) to stellar population characterization (de Jong 1994, 1996a, 1996b); from star formation research (Kennicutt 1983, 1989) to the investigation of the ISM in external galaxies (Valentijn 1994). The situation is much poorer in other wavelength regimes. The near infrared (NIR) domain is particularly interesting in this respect since in this range the flux is largely dominated by the direct stellar radiation while drastically reducing the general extinction. In addition, NIR colours are very sensitive to population changes in the galaxy (Peletier et al. 1994; de Jong & van der Kruit 1994; Giovanardi & Hunt 1996; Hunt et al. 1997; Peletier & Balcells 1996, 1997).
Reasons for the scarcity of NIR extragalactic databases are to be sought in the late development of 2D detector arrays with respect to their optical counterparts and in the greater difficulty in building NIR astronomical instruments, which have to be cryogenically cooled to achieve good performances in the thermal infrared, namely from the band towards longer wavelengths. Furthermore, observations and data reduction are far more complicated and time consuming in the NIR than in the optical. The basic reason is that the signals have to be extracted from a largely dominant sky emission, coming mostly from the thermal radiation of the earth atmosphere, which in addition is much more time-dependent, with variation timescales ranging from several tens of minutes in the band, to one or two minutes in . This means that to properly subtract the sky emission from the image of an extended object, like a galaxy, one has to nod between two adjacent sky positions with a frequency adjusted to the variation timescale of the sky background. Also, the high value of the sky flux necessarily shortens the single on-chip integration time to avoid saturation and/or to keep the counts within the linear range of the detector. The combined result of all these effects is that an observing run for an extended object ends up with hundreds of individual exposures that have to be treated carefully. It is also worth mentioning that this procedure of sky substraction permits the galaxy object to completely cover the detector, since the sky will be measured in the other nodding position. Thus, the criterion of size in the sample can be extended to the full limit imposed by the instrument’s field of view.
We have recently started an observational programme aimed at producing a database of NIR infrared images of spirals galaxies, with several primary objectives in mind:
-
•
To characterize the presence of the relevant morphological components and compare, whenever possible, their structural parameters with those obtained in the optical.
-
•
To check their morphological classification.
-
•
To investigate trends in structural parameters with morphological type.
In this first paper we will not cover the last two items, the sample does not contain a wide range of galaxy types. In subsequent reports we will, try to enlarge the sample and investigate the underlying stellar population in order to delineate the presence of interstellar dust by means of NIR colours.
The galaxies presented in this paper have been selected primarily according to their isophotal diameter, as listed in the RC3 (de Vaucouleurs 1991), and their brightness, both being considered within the suitable range for testing the feasibility of the project. We included only spirals in this first sample since they exhibit a wider range of morphological structures.
2 Observations
The observations were made at the Teide Observatory (OT) on the island of Tenerife (Spain) on the 1.5 m Carlos Sánchez Telescope (CST). The images were taken with the common user NIR camera, CAIN, equipped with a NICMOS3 detector array and standard broad band NIR filters , cooled to LN2 temperature. CAIN holds two different optical set-ups, both fully cryogenic, which provide two plate scales: the narrow camera, giving 0.4 arcsec per pixel, and the wide one, with 1 arcsec per pixel, used for this work. All the galaxies have been observed in at least two filters, and (or ), during several campaigns from 1998 onwards. Typical seeing value was, on average, a little in excess of 1 arcsec.
| Galaxy | RA | DEC | Type | PA | Incl. | ||||
|---|---|---|---|---|---|---|---|---|---|
| [h] | [deg] | [] | [deg] | mag | [Mpc] | ||||
| NGC 3344 | 10.72 | 24.92 | SABbc | 4.0 | 1.85 | 10.49 | 17.6 | 9.3 | |
| NGC 3686 | 11.46 | 17.22 | SBbc | 4.1 | 1.48 | 15 | 11.96 | 40.8 | 14.2 |
| NGC 3938 | 11.88 | 44.12 | SAc | 5.1 | 1.69 | 52 | 11.04 | 12.9 | 11.4 |
| NGC 3953 | 11.89 | 52.32 | SBbc | 3.9 | 1.88 | 13 | 10.84 | 63.3 | 12.6 |
| NGC 4254 | 12.31 | 14.41 | SAc | 5.2 | 1.72 | 10.42 | 32.0 | 14.8 | |
| NGC 4303 | 12.36 | 4.47 | SABbc | 4.0 | 1.79 | 162 | 10.18 | 19.2 | 19.4 |
| NGC 4314 | 12.37 | 29.89 | SBa | 1.0 | 1.59 | 11.41 | 19.2 | 12.5 | |
| NGC 5248 | 13.62 | 8.88 | Sbc | 4.0 | 1.75 | 110 | 11.00 | 50.5 | 14.8 |
| NGC 6384 | 17.54 | 7.06 | SABbc | 3.6 | 1.69 | 30 | 11.60 | 59.9 | 24.1 |
| NGC 7479 | 23.08 | 12.32 | SBc | 4.4 | 1.61 | 25 | 11.77 | 36.4 | 34.7 |
| Galaxy | Filter | T.exp/frame | Fr./point. | Tot. point. | Galaxy | Filter | T.exp/frame | Fr./point. | Tot. point. |
|---|---|---|---|---|---|---|---|---|---|
| [s] | [s] | ||||||||
| NGC 3344 | 30 | 4 | 21 | NGC 4303 | 20 | 6 | 20 | ||
| NGC 3344 | 12 | 10 | 20 | NGC 4303 | 8 | 15 | 20 | ||
| NGC 3686 | 20 | 6 | 20 | NGC 4314 | 20 | 6 | 20 | ||
| NGC 3686 | 8 | 15 | 20 | NGC 4314 | 8 | 15 | 20 | ||
| NGC 3938 | 30 | 4 | 16 | NGC 5248 | 20 | 6 | 20 | ||
| NGC 3938 | 10 | 12 | 17 | NGC 5248 | 6 | 20 | 20 | ||
| NGC 3953 | 30 | 4 | 20 | NGC 6384 | 30 | 6 | 10 | ||
| NGC 3953 | 10 | 12 | 20 | NGC 6384 | 8 | 12 | 10 | ||
| NGC 4254 | 20 | 6 | 20 | NGC 7479 | 30 | 6 | 16 | ||
| NGC 4254 | 8 | 15 | 20 | NGC 7479 | 12 | 10 | 13 |
As mentioned in the preceding section, this first sample was selected taking into account several prescriptions:
-
•
Declinations between and +60 degrees, to be observable from the OT.
-
•
Morphological types with T in the range . All the galaxies are spirals (barred and non-barred) and nearly face on (inclination ) for easier decomposition of their morphological structures. The majority of the galaxies in the sample have in the range 4–5, see table 1.
-
•
High surface brightness, , and diameters suitable for the telescope size and the instrument FOV, respectively.
The observed sample till now contains more than the ten galaxies, NGC3344, NGC3686, NGC3938, NGC3953, NGC4254, NGC4303, NGC4314, NGC5248, NGC6384 and NGC7479, which constitute the body of this paper (table 1). The remaining ones will be presented in subsequent papers.
| Galaxy | Filter | 3 | 5 | Galaxy | Filter | 3 | 5 |
|---|---|---|---|---|---|---|---|
| NGC 3344 | 21.93 | 21.37 | NGC 4303 | 21.33 | 20.78 | ||
| NGC 3344 | 20.34 | 19.78 | NGC 4303 | 20.17 | 19.61 | ||
| NGC 3686 | 22.33 | 21.77 | NGC 4314 | 22.76 | 22.21 | ||
| NGC 3686 | 21.23 | 20.68 | NGC 4314 | 21.36 | 20.80 | ||
| NGC 3938 | 21.59 | 21.04 | NGC 5248 | 22.08 | 21.53 | ||
| NGC 3938 | 20.51 | 19.95 | NGC 5248 | 21.11 | 20.50 | ||
| NGC 3953 | 22.89 | 22.33 | NGC 6384 | 22.08 | 21.53 | ||
| NGC 3953 | 21.28 | 20.72 | NGC 6384 | 21.10 | 20.56 | ||
| NGC 4254 | 22.52 | 21.97 | NGC 7974 | 22.54 | 21.99 | ||
| NGC 4254 | 19.92 | 19.37 | NGC 7974 | 20.77 | 20.22 |
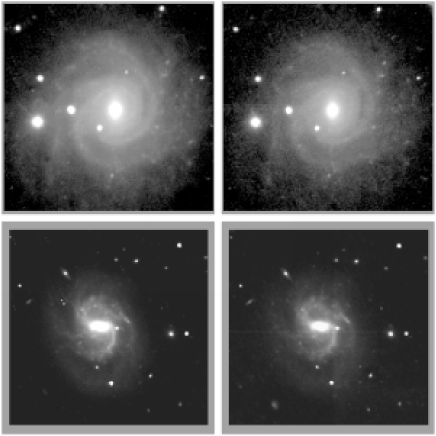
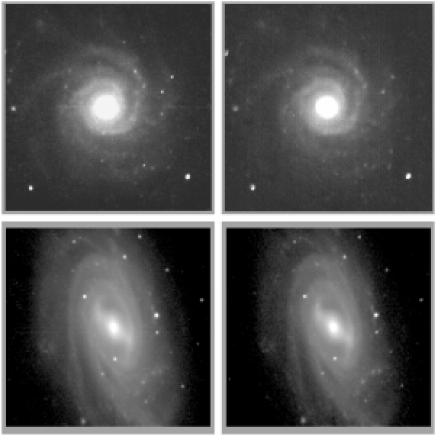
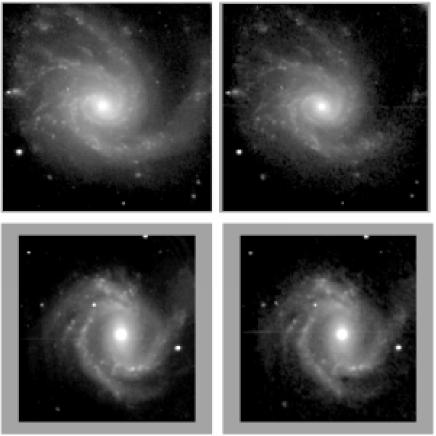
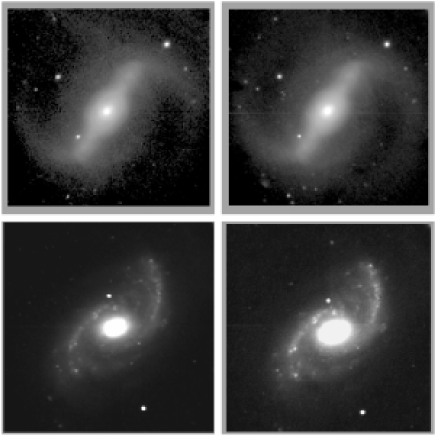
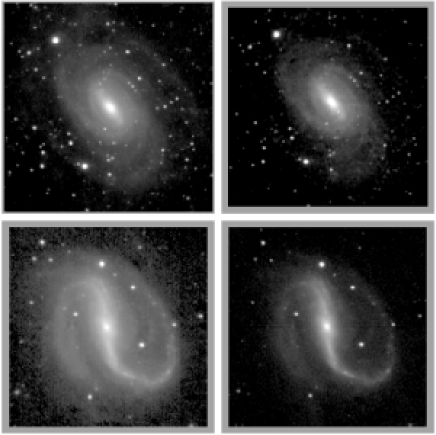
The observing strategy has been in all cases the classical ON–OFF method, in which alternative exposures of the galaxy and the adjacent sky are taken until completing the total exposure time. The integration time of a single frame was determined by the linear part of the well depth of the NICMOS detector and the sky flux, which is by far the dominant contribution to the measured signal. Typical integration times per frame range from 6 to 12 s in and from 20 to 30 s in . Several frames are taken per pointing position until the grand total equals the timescale of the variation of the sky background, which was set at two minutes with a sufficient safety margin. This is then the time between nodding positions (table 2). The final images showing the surface photometry of each galaxy are displayed in Figs. 1, 2, 3, 4 and 5.
3 Data reduction and calibration
The data have been reduced using several combinations of IRAF tasks. The read-out mode has in all cases been the standard Fowler mode, in which N non-destructive reads are taken after the detector reset and then integrated for the required time and the detector read times again. By so doing the determination of the pedestal level of the signal is given by the average of the first reads, and the image signal is defined by the difference between the average of the last reads and that of the first ones. The S/N ratio of the image is improved by this method .
We have followed the standard process for treating the data to correct for bias and dark current, and flatfield calibration. Then we subtracted the sky from each individual frame using a coadded image of the sky measurements taken immediately before and after. Hence, we can correct for trends observed in the background. Finally, the corrected object frames are aligned and averaged to give the final product per galaxy and filter in adu. These are transformed to flux-calibrated images using observations of several NIR standard stars selected from the UKIRT list (Hunt et al. 1998) observed during the night.
In these calibrated coadded images we can estimate the sensitivity limits defined as the signal equivalent to 3 or 5 times the standard deviation. The results are given in table 3.
4 Components Decomposition
One of our main purposes is to investigate the presence and geometrical parameters of the principal structural components that contribute to the observed surface brightness. Radial profiles are the appropriate tool for this purpose and can be easily constructed with the technique of ellipse fitting. This is done by means of the IRAF task ELLIPSE, which computes the isophotal contours of the surface brightness images and fits them to ellipses. ELLIPSE uses an algorithm developed by Jedrzejewski (1987). As a result, one gets radial profiles of brightness, ellipticity and position angles along the major axis of the ellipse family. This is formally equivalent to first correcting for the inclination angle by deprojection of the galaxy image and then getting those radial variations averaged over the azimuthal angle. We have limited the scope of these profiles to the extent where the brightness of the galaxies equals the sensitivity figures given in table 3. The profiles, then, will provide information about the morphological structure of the galaxies.
Outer isophotes were used for determination of global galactic parameters such as ellipticity, position angle (hereafter, PA) and inclination angle, this latter derived from the ellipticity. Galaxies with a lower inclination angle have higher errors because of the lack of a privileged direction.
One can easily infer the presence of the different structural components, discussed in the next section, from the variation in these parameters with galactic radius (Varela et al. 1996; Wozniak et al. 1995).
In table 4 we have the results of the ELLIPSE task. The ellipticity is defined as , where and are the major and minor axes of the ellipses, respectively. The PA is the angle between the major axis of the ellipses and north–south axis in the sky, measured from north to east. The values of each galaxy in both filters are in reasonably good agreement, their deviations being due mainly to errors in the ELLIPSE process, possibly enhanced by the slightly different sensitivities of the images in the two filters.
| Galaxy | Filter | () | Ellipticity | PA | Inclination | Bar Ellipt. | Bar PA | m_int | m2M |
|---|---|---|---|---|---|---|---|---|---|
| [arcsec] | [deg] | [deg] | [deg] | ||||||
| NGC 3344 | 120 | 0.090.02 | 34.814.48 | 24.791.31 | 0.330.01 | 84.731.87 | 8.73 | 8.614 | |
| 101 | 0.040.11 | 35.607.24 | 18.086.45 | 0.260.02 | 83.532.81 | 8.17 | 7.755 | ||
| NGC 3686 | 83 | 0.240.03 | 21.640.56 | 41.150.07 | 0.590.03 | 86.263.25 | 9.18 | 9.474 | |
| 85 | 0.210.01 | 22.081.96 | 38.560.77 | 0.610.01 | 85.791.30 | 8.44 | 8.504 | ||
| NGC 3938 | 90 | 0.110.01 | 65.958.06 | 14.470.58 | — | — | 9.24 | — | |
| 90 | 0.130.00 | 62.452.49 | 20.340.25 | — | — | 8.06 | — | ||
| NGC 3953 | 120 | 0.500.05 | 12.973.91 | 60.182.87 | 0.570.03 | 55.903.18 | 8.48 | — | |
| 120 | 0.500.07 | 12.315.82 | 60.144.31 | 0.580.01 | 56.791.53 | 7.69 | — | ||
| NGC 4254 | 115 | 0.270.07 | 46.999.59 | 43.214.44 | — | — | 8.26 | 8.267 | |
| 115 | 0.230.08 | 39.411.94 | 40.090.48 | — | — | 7.74 | 7.308 | ||
| NGC 4303 | 100 | 0.160.06 | 73.434.81 | 33.693.78 | 0.460.00 | 2.711.59 | 8.24 | — | |
| 110 | 0.170.04 | 78.483.56 | 34.022.36 | 0.270.00 | 5.003.58 | 7.57 | — | ||
| NGC 4314 | 95 | 0.450.08 | 33.682.10 | 56.804.91 | 0.660.00 | 30.941.01 | 9.44 | 8.768 | |
| 100 | 0.410.07 | 35.415.82 | 54.294.33 | 0.670.09 | 35.511.92 | 7.48 | 7.811 | ||
| NGC 5248 | 110 | 0.400.00 | 47.171.43 | 53.350.31 | — | — | 8.24 | — | |
| 105 | 0.380.02 | 48.514.25 | 51.871.28 | — | — | 7.44 | — | ||
| NGC 6384 | 115 | 0.480.03 | 22.342.14 | 58.882.12 | 0.380.07 | 35.343.56 | 9.02 | — | |
| 115 | 0.310.06 | — | 47.083.68 | 0.400.09 | 29.772.81 | 9.22 | – | ||
| NGC 7479 | 110 | 0.250.03 | 37.995.30 | 41.672.26 | 0.680.01 | 1.521.10 | 8.81 | 9.341 | |
| 110 | 0.240.03 | 35.139.60 | 41.262.86 | 0.700.29 | 0.432.81 | 8.16 | 8.360 |
We can compare our results for the inclination angle and PA of each galaxy listed in table 4 with the values quoted in RC3. The agreement is generally good. NGC 4314 exhibits the largest differences certainly because of its large size in relation with the instrument FOV. We will not extend further the comparison between the NIR images presented here and the optical images in the RC3, since the component descomposition is not performed in the optical images. The reasons for this are to be found in the non-uniformity of the optical images and the expected spurious effects due to observational circunstances beyond our control. However, it is clear that the NIR images more closely represent the true stellar distribution caused by the smaller value of the extintion. It is then expected that the geometrical features of the main structural components will be somewhat different in the two spectral regimes.
Using the results of the ellipse fitting, we have measured the integrated magnitudes of the sample in both filters (see table 4) within a circular aperture of the radius at which the surface brightness from the object equals that of the sky at over its mean value (see table 3). These values are in fairly good agreement with those from the 2MASS data (Skrutskie et al. 1995), taken from NED (see table 4). However, our images extend in general to larger radii than the fixed scale of 80 arcsec quoted in NED.
In those galaxies where a clear indication exists of the presence of a large central bar, either from the images themselves and/or from the sudden change in the radial profiles. We used an additional method to estimate the geometrical parameters of the bar itself. The global PA and inclination angle of the object galaxy are used to deproject the galaxy image in order to measure quantities in the proper galactic plane.. Columns 6 and 7 of table 4 show the values of ellipticity and PA for the bar taken from the ELLIPSE results, after deprojection, and measured at the galactic radius spanned by the bar.
Once the radial profiles have been obtained and the general parameters calculated, we can now proceed with the decomposition of the averaged brightness profile into different structural components, each with a separate contribution to the observed flux. There are a large number of similar researches in the literature where structural decomposition of external galaxies are attempted in various ways (Simien & Michard 1990; Prieto et al. 1990, 1992; Byun & Freeman 1995), but most of them are based on visible data that do not so closely resemble the true stellar distribution because of their higher value of the extinction. Previous NIR decomposition can be found in de Jong (1996), Peletier & Balcells (1997), Moriondo et al. (1998), Seigar & James (1998) and references therein. For the different component identification we have followed the technical approach of Prieto et al. (2001) where the changes in the radial profiles of ellipticity, PA and B4 are used to identified the radial interval over which the given component extends.
Then, the analytical functions, described in the table 5 and in Aguerri (1998), are fitted to the brightness radial profile within that interval. This technique would be of little use in the case of strong bars since these structures only occur over a narrow range of azimuthal angles. Hence, the use of azimuthally averaged profiles, as is the case for the results of the ellipse fitting, could well mask the bar against the averaged background. We will come back to these cases at the end of this section.
| Component | equation | Reference |
|---|---|---|
| Bulge | , , | Sersic 1968; Aguerri 1998 |
| Disco | , | Freeman 1970 |
| Elliptical Bar | , | Prieto et al. 1997, 2001; Freeman 1966 |
| Flat Bar | , | Prieto et al. 2001 |
| Lens | , | Duval & Athanasoula 1983 |
| Ring | , | Buta 1996 |
Our procedure to fit the several morphological components to the measured brightness profile is similar to that described in Prieto et al. (2001). Once the components have been identified in the radial profiles of several parameters coming from the ellipse fitting, we first fix the disc in the outer parts of the galaxy, where contamination from other components can be neglected. Next, this disc model is subtracted from the original profile and we fit the bulge to the residuals with the best Sersic law (–4). These operations are iterated until convergence, defined as the difference between two consecutive set of parameters being less than the measured noise, is reached.
After the disc–bulge pair has been set up, we proceed with the secondary components, by fitting the residuals of the subtraction of the disc–bulge model from the brightness profile to the spatial extent indicated in the radial profiles of the B4, PA and ellipticity parameters. In galaxies with prominents bars, such as NGC 7479 or NGC 4314, we have tried two different radial profiles for the fitting. In addition of using the azimuthally averaged brightness profiles resulting from the ellipse fitting, we have also built another two averaged brightness profile by computing the radial profiles by averaging in a narrower range of azimuthal angles: either profiles along the bar direction or perpendicular to the bar. A disc–bulge pair is now fitted to the profiles averaged along the minor axis of the bar where the bar contribution is low. Then, this model is subtracted from the radial profile averaged along the major axis of the bar direction and the residuals matched with a bar model. As before, this procedure is iterated until convergence, defined as in the previous case, is reached. In the following sections we will refer to the decomposition results from the ELLIPSE fitting as isophotal parameters and as fitting parameters to those of this last technique. In the case of the fitting parameters for the bar, we can also fit a bar profile along both the major and minor axes of the bar once the disc–bulge pair is fixed.
5 Results
The numerical results of our component decomposition are summarized in tables 7 and 8. Historically, the standard function for approximating galactic bulges has been the law, but it has been suggested that some bulges might be better represented by an law (Caon et al. 1993; Andredakis et al. 1995). When increases, the luminosity profiles are more centrally concentrated. For this reason, early-type galaxies show larger values of than late types (Andredakis et al. 1995). In this respect, observational effects can affect the results of the fit. For instance, the seeing size, if comparable with the galaxy diameter, can distort the concentration of the surface brightness (Trujillo et al. 2001). This should not be the case in our sample since all the galaxy bulges are much bigger than the seeing. In our fits, the best results for the whole sample is obtained with a value of equal to 1, but we cannot correlate with the morphological type because we have only Sc or Sbc galaxies (late-type galaxies) in this first sample of objects.
6 Conclusion
Most of the galaxies in the sample are of late type (bc or c), NGC 4314 being the only example of an early-type (SBa) object. Hence, we cannot infer any correlations between morphological type and the component parameters. This will be done in subsequent works with a larger sample of morphological types. The majority of the galaxies in the sample have in the range 4–5, see table 1. Only NGC 4314 and NGC 6384 are earlier galaxies with 1.0 and 3.6 respectively.
The bulge/disc ratio (), defined in equation 1 (Mihos et al. 1994),
| (1) |
is rather low (see table 6), showing that the inner parts of the galaxy are dominated by components other than the central bulge, most probably the bar and ring.
It is worth noting, however, that NGC 4314 has the highest B/D ratio, with a value around of 0.6, indicating its early type. This galaxy has a spike in the ellipticity and PA profiles around 10′′. This peak points to the presence of an additional bar in the inner parts of the galaxy (Aguerri 1998). The existence of this secondary bar in NGC 4314 has been also proposed by Erwin & Sparke (2002) analysing images from the Hubble Space telescope (see their fig. 2b). The secondary bar has been fitted to the residuals after removal of the main components in the averaged brightness radial profile.
| Galaxy | ||
|---|---|---|
| NGC 3344 | 0.12 | 0.10 |
| NGC 3686 | 0.11 | 0.09 |
| NGC 3938 | 0.14 | 0.15 |
| NGC 3953 | 0.17 | 0.14 |
| NGC 4254 | 0.38 | 0.16 |
| NGC 4303 | 0.12 | 0.19 |
| NGC 4314 | 0.64 | 0.59 |
| NGC 5248 | 0.33 | 0.42 |
| NGC 6384 | 0.31 | 0.34 |
| NGC 7974 | 0.21 | 0.17 |
The resulting inclinations and PAs are in agreement with the data of other authors, in particular with the RC3. The major differences are between those galaxies with low PAs, in which the measurements are more difficult because of the poorer definition of this parameter. This is equally true for the inclination angles. There are minor discrepancies between the numbers in each filter, with some departures in NGC 3938 because of its shorter exposure time in . On the other hand, NGC 4303 and NGC 4314 show the greatest difference in inclination compared with the RC3 values in both filters. NGC 4303 has outer arms that are fainter in the NIR than in the optical bands, so we might be underestimating the outer part of the galaxy (on the other hand, we are comparing visible and NIR data). The same reason applies to NGC 4314. In general, all the galaxy images are bigger in the optical band, the images being extracted from the DSS, than in this work. But the particular orientation of the outer arms and the central bar causes these larger departures in these two galaxies. Some galaxies present a ring in RC3 (NGC 3686, NGC3953, NGC 5248 and NGC 6384), in NIR their are very faint in the images and could be mixed with the arms.
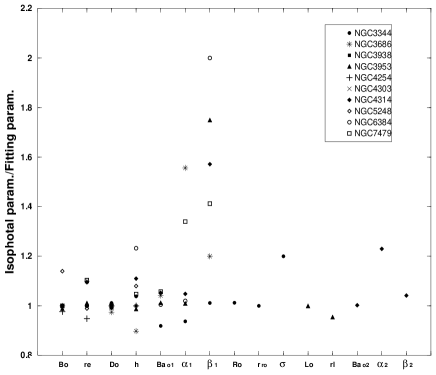
The two methods that we have used to fit the parameters of the brightness distribution for the morphological components, namely the isophotal parameters and the fitting parameters, give very similar results, as can be seen in Fig. 6. This can be attributed to the small influence of the bar in the overall brightness distribution outside the very central regions. In addition, part of the observed differences are certainly due to innaccuracies inherent in the fitting procedures. We can see that galaxies with strong bars (such as NGC 7479 and NGC 4314) have their isophotal bar parameters overestimated. This happens because of distortions in the ellipse fitting due to the presence of the spiral arms in the interarm region near the bar (NGC 6384, NGC 3953 and NGC 3686; see Figs. 1, 2 and 5).
We have obtained the best results with in the Sersic law for all the bulge fittings. Prieto et al. (2001) have argued that increases with the wavelength of the filters. We cannot discuss this effect since our filters are rather close each other in wavelength. Only NGC 4314 (the early-type galaxy) presents a possible class bulge, but in the ellipticity profile there is a peak around , which indicates a secondary bar (Erwin & Sparke 2002; Aguerri 1998). After the removal of this component, the profile of the bulge is then back of type . The uniqueness of this result may be questioned, since we would have obtained a similarly good agreement with the observed profile using a bigger and triaxial bulge instead of a secondary bar. However Erwin & Sparke (2002), using deep images taken with the Hubble Space Telescope, have also found these inner structures. Some authors (Andredakis et al. 1995; Moriondo et al. 1998) have reported a correlation between the exponent n in the Sersic law with the morphological type of the galaxy, which we cannot check here because of the lack of coverage of this parameter.
It is noteworthy that NGC 4314 and NGC 7479 present the strongest bars in the sample, and that both have a LINER in their nuclei. This fact is discussed by Martin (1995), Athanasoula (1982) and Friedli & Berz (1993). Finally, all the bars found in this work are best fitted assuming that they are flat-type bars that follow the equation in table 5.
Acknowledgements.
We are thankful to Drs J.A. López Aguerri and A. Cabrera for many helpful and useful conversations during the preparation of this manuscript. To Norberto Castro-Rodríguez for his helpful in the fitting of the profiles. The CST is operated on the island of Tenerife by the Instituto de Astrofísica de Canarias at the Spanish Observatorio del Teide of the Instituto de Astrofísica de Canarias. This article makes use of data products from 2MASS, which is a joint project of the Univ. of Massachusetts and the Infrared Processing and Analysis Center, funded by the NASA and the NSF. This work has been partially funded by the Spanish Plan Nacional de Astronomía y Astrofísica, project AYA2000-2046-C02-02 and the Universidad de La Laguna-Cajacanarias fellowship (Canary Islands, Spain).References
- (1) Aguerri, J. L. 1998, Thesis, Universidad de La Laguna (Spain).
- (2) Andredakis, Y. C., Peletier, R. F., & Balcells, M. 1995, MNRAS, 275, 874
- (3) Athanasoula, E., Bosma, A., Creze, M., & Schwarz, M. P. 1982, A&A, 107, 101
- (4) Buta, R. 1996, ASP Conf. Ser. 91: IAU Collq. 157: Barred galaxies, p.11
- (5) Byun, Y., & Freeman, K. 1995, ApJ, 448, 563
- (6) Caon, N., Capaccioli, M., & D’Onofrio, M. 1993, MNRAS, 265, 1013
- (7) Duval, M. F., & Athanasoula, E. 1983, A&A, 121, 297
- (8) Erwin, P., & Sparke, L. 2002, AJ, 124, 65
- (9) Freeman, K. C. 1966, MNRAS, 133, 47
- (10) Freeman, K. C. 1970, ApJ, 160, 811
- (11) Friedli, D., & Berz, W. 1993, A&A, 268,65
- (12) Giovanardi, C., & Hunt, L. K. 1996, AJ, 111, 1086
- (13) Huchtmeier, W. K., & Richter, O. G. 1989, A general catalogue of HI observations of galaxies, Springer-Verlag, New York.
- (14) Hunt, L. K., Mannuci, F., Testi, L., Milgliorini, S., & Stanga, R. M. 1998, AJ, 115, 2594
- (15) Hunt, L. K., Malkan, M. A., Salvati, M., Mandolesi, N., Palazzi, E., & Wade, R. 1997, ApJS., 108, 229
- (16) Jedrzejewski, R. J. 1987, IAUS, 127, 37
- (17) De Jong, R. S. 1996, A&A, 118, 557
- (18) De Jong, R. S. 1996, A&A, 313, 45
- (19) De Jong, R. S. 1994, A&A Sup., 106, 451
- (20) De Jong, R. S., & van der Kruit, P. C. 1994, A&AS, 106, 451
- (21) Kennicutt, R. C. 1989, ApJ, 344, 685
- (22) Kennicutt, R. C. 1983, ApJ, 272, 54
- (23) Martin, P. 1995, AJ, 109, 2428
- (24) Mihos, C., & Hernquist, L. 1994, ApJ, 425, 13
- (25) Moriondo, G., Giovanardi, C., & Hunt, L. K. 1998, A&AS, 130, 81
- (26) Peletier, R. F., & Balcells, M. 1997, NewA, 1, 349
- (27) Peletier, R .F., & Balcells, M. 1996, AJ, 111, 6
- (28) Peletier, R .F., Valentijn, E. A., Moorwood, A. F. M., & Freudling, W. 1994, A&AS, 108, 621
- (29) Prieto, M., Aguerri, J. L., Varela, A. M., & Muñoz–Tuñón, C. 2001, A&A, 367, 405
- (30) Prieto, M., Gottesman, S. T., Aguerri, J. L., & Varela, A. 1997, AJ, 114, 1413
- (31) Prieto, M., Beckman, J. E., Cepa, J., & Varela, A. 1992, A&A, 257, 85
- (32) Prieto, M., Cepa, J., Beckman, J. E., Varela, A., & Muñoz–Tuñón, C. 1990, Ap&SS, 170, 225
- (33) Seigar, M. S., & James, P. A. 1998, MNRAS, 299, 672
- (34) Sersic, J. L. 1968, Atlas de galaxias australes Córdoba:Observatorio astronómico
- (35) Simien, F., & Michard, R. 1990, A&A, 227, 11
- (36) Skrutskie, M. F., et al. 1995, AAS, 187, 7507
- (37) Trujillo, I., Aguerri, J. L., Cepa, J., & Gutierrez, C. M. 2001, MNRAS, 328, 977
- (38) Valentijn, E. A. 1994, MNRAS, 266, 614
- (39) Van der Kruit, P. C., & Searle, L. 1982, A&A, 110,79
- (40) Van der Kruit, P. C., & Searle, L. 1981, A&A, 95, 116
- (41) Varela, A. M., Muñoz–Tuñón, C., & Simmoneau, E. 1996, A&A, 306, 381
- (42) de Vaucouleurs, G. 1991, RC3-”Third Reference Catalogue of Bright Galaxies”, Springer-Verlag
- (43) Wozniak, H., Friedli, D., Martinet, L., & Bratschi, 1995, A&AS, 111, 115
| Object | Bulge | Disc | Bar | ||||
|---|---|---|---|---|---|---|---|
| mag [] | arcsec | mag [] | arcsec | mag [Bao1] | arcsec | arcsec | |
| 3344 | 16.800.06 | 3.801.20 | 18.350.01 | 41.771.0 | 18.300.10 | 12.001.0 | 4.000.5 |
| 15.840.06 | 3.501.45 | 17.480.01 | 43.793.0 | 17.300.08 | 13.001.0 | 4.000.5 | |
| 3686 | 18.380.08 | 3.620.45 | 19.260.09 | 30.945.0 | 19.050.03 | 16.000.5 | 5.000.5 |
| 17.770.10 | 3.590.10 | 18.350.20 | 28.439.0 | 18.5 0.05 | 21.000.5 | 5.000.5 | |
| 3938 | 18.380.01 | 6.300.30 | 18.240.05 | 29.700.2 | |||
| 17.400.05 | 6.830.20 | 17.350.05 | 31.850.3 | ||||
| 3953 | 17.810.20 | 6.270.09 | 19.600.09 | 64.001.5 | 19.600.06 | 44.000.5 | 4.000.5 |
| 16.970.20 | 5.870.15 | 18.700.06 | 64.643.0 | 18.450.08 | 45.000.5 | 4.000.5 | |
| 4254 | 17.830.15 | 9.561.00 | 17.930.10 | 30.331.6 | |||
| 16.720.20 | 7.012.00 | 17.470.02 | 46.410.3 | ||||
| 4303 | 16.020.04 | 3.860.70 | 18.670.05 | 69.611.0 | 18.050.80 | 26.000.5 | 9.001.0 |
| 15.020.06 | 3.490.10 | 17.830.06 | 55.100.5 | 17.550.07 | 22.000.5 | 5.000.5 | |
| 4314 | 18.010.07 | 6.020.70 | 20.520.08 | 45.061.0 | 19.950.10 | 73.001.0 | 7.000.5 |
| 15.820.20 | 5.480.10 | 18.350.10 | 42.922.5 | 17.850.10 | 76.601.0 | 7.000.5 | |
| 5248 | 17.550.04 | 7.150.10 | 18.050.05 | 29.191.8 | |||
| 16.710.04 | 8.380.15 | 17.400.10 | 33.213.0 | ||||
| 6384 | 17.780.08 | 6.221.00 | 19.350.30 | 43.100.9 | 19.200.05 | 25.500.5 | 2.501.0 |
| 16.980.30 | 6.061.50 | 19.360.10 | 58.0010.0 | 17.950.06 | 26.000.5 | 4.503.0 | |
| 7479 | 18.200.02 | 6.020.20 | 20.160.15 | 60.303.0 | 18.550.05 | 50.000.5 | 7.500.5 |
| 16.7 0.04 | 4.800.35 | 18.900.15 | 60.130.5 | 17.400.05 | 47.001.0 | 8.500.5 | |
-
Object Ring Lens Secondary Bar mag [] arcsec arcsec mag [] arcsec mag [Bao2] arcsec arcsec 3344 20.750.2 26.500.5 7.001.0 19.500.1 25.000.5 5.002.0 3953 19.500.2 22.000.5 18.600.2 24.001.0 4254 19.800.2 16.000.1 7.000.5 18.350.2 12.500.7 5.001.0 4314 19.500.05 23.500.1 5.000.5 17.020.07 19.502.0 6.000.5 Table 8: Isophotal parameters of each component per individual galaxy and filter. The root NGC has been removed from the galaxy name for simplicity. See text for description. The names in brackets in the header section are those used in fig. 6 for that parameter. The galaxies of the sample without a componet are not presented in this table.