Constraints on intergalactic dust from quasar colours
Abstract
Colour measurements of quasars are used to constrain the abundance and properties of intergalactic dust and the related extinction effects on high- sources. For Type Ia supernovae at , we derive an upper limit on the possible dimming from intergalactic dust of , ruling out the “grey” dust scenario as being solely responsible for the observed faintness of high- SNIa.
1 Introduction
Scattering and absorption of light by a homogeneous distribution of intergalactic large grains giving a nearly achromatic cross-section – so called grey dust – has been proposed [1, 2] as an alternative to the dark energy explanation for the observed faintness of Type Ia supernovae (SNIa) at [3, 4]
The presence of a significant component of dark energy has been inferred from complementary cosmological tests, e.g., from recent WMAP background radiation measurements [5] in combination with limits on the Hubble parameter from the HST Key Project [6] and large scale structure measurements from the 2dFGRS survey [7]. However, in Ref. [8] it was demonstrated how the recent CMB anisotropy observations can be explained also by an Einstein-de Sitter cosmology with no dark energy if one allows for a low Hubble parameter, km/s/Mpc, the value currently favoured by gravitational lensing time delay measurements [9]. It is further argued that conflict with large scale structure measurements can be avoided by suppressing cluster scale mass fluctuations assuming a small but non-negligible hot dark matter component.
Thus, probing the redshift-distance relation through Type Ia SN observations remains essential for establishing and exploring the dark energy of the universe. Ruling out alternative explanations to the dark energy interpretation and minimizing systematic effects on the measured distances to high- supernovae is still crucial. In this note, we discuss the possibility to constrain the effects of intergalactic grey dust.
It has been argued that the amount of intergalactic dust required to make the SNIa results compatible with an Einstein-de Sitter universe is disfavored by the far-infrared background measured by the DIRBE/FIRAS instruments [10]. However, the derived bounds rely on the assumption that optical and UV photons are absorbed and re-emitted rather than just scattered by the dust grains.
It is expected that large dust grains will also cause some differential extinction for high- sources (although less than for smaller dust grains), allowing the possibility to distinguish between extinction and a cosmological origin of the dimming. In Ref. [11], it was shown that with 1 % relative spectrophotometric accuracy or broadband photometry in the wavelength interval 0.7–1.5 m for high- SNIa observations, one could reduce the uncertainty from grey dust extinction down to magnitudes (the target error for the proposed SNAP SN survey [12]).
In this paper, the differential extinction for high- quasars (QSOs) caused by extragalactic dust along the line of sight is used to put an upper limit on the possible effects on SNIa observations at of (comparable to current SNIa survey errors) for a wide range of models for evolution of dust density and extinction properties.
2 Extinction by dust at cosmological distances
For a given emission redshift , the attenuation at observed wavelength due to dust can be written (see also Ref. [11])
| (1) |
where is the dimensionless wavelength-dependent attenuation coefficient where we use the parameterization given in [14] and is the interaction length for scattering or absorption by dust particles in the observed -band (m). Here, is the physical dust density at redshift , the interaction cross-section and the proportionality constant will be related to the mass-distribution of the dust particles (since where is the dust number density). The cosmology-dependent function is given by
| (2) |
Note that we have set and and should be given using the same set of units, e.g., Mpc.
Thus, our parameters are the reddening parameter and the interaction length at zero redshift .
The Monte-Carlo simulation program SNOC [15] was used to perform the integral in Eq. (1) numerically. Note that the model is valid also for a patchy dust distribution, as long as the scale of inhomogeneities is small enough, i.e., where is the number of dust clouds intersected by the light-ray.
Perfectly grey dust (i.e., with wavelength-independent absorption) can obviously mimic the effects of any dark energy component if one allows for arbitrary fine-tuning of the dust distribution. We have investigated whether any realistic dust model related to astrophysical sources are consistent with the available data. We note first that the dust density has to be related to astrophysical sources, such as star formation, and second, that physically reasonable dust models generally implies a wavelength-dependence in the absorption and scattering properties.
As in Ref. [11], two dust distributions are considered: , where
| (5) |
Thus, Model A has a constant comoving dust density whereas Model B with implies dust creation at . Models A and B are considered to be extreme in opposite directions, i.e. they should capture the full range of physical models leading to the production of intergalactic dust.
In our simulations we explore values of in the interval ranging from 1 to 9 and the interaction scale-length at zero redshift in the range Gpc. In a -cosmology, correspond to proper distances of 1.55, 2.37 and 2.84 Gpc, respectively. Note that since the dust density varies with redshift according to Eq. (5), the interaction length will vary correspondingly.
3 Spectral homogeneity of QSOs
QSOs have been found to have remarkably homogeneous spectral properties in spite of their wide range in brightness. The Sloan Digital Sky Survey collaboration (SDSS, [16]) has produced empirical spectral templates based on a couple of thousand objects in the redshift range showing a spectrum-to-spectrum difference of approximately 20 % in the rest system wavelength range 1200 to 8500 Å [26]. HST QSO data was used by [25] to extend the spectral template down to 300 Å in order to obtain full wavelength coverage for all broadband filters (see Sec. 4) over the entire redshift interval used in this paper.
4 The QSO sample
The SDSS and 2dF [17] Galaxy Redshift Survey will eventually include about 105 QSOs up to redshift . We have used a data sample of 3814 QSOs from the SDSS Early Data Release (EDR) [18]. These have redshifts between and distributed according to Fig. 1.

The optical magnitudes are measured through five broadband filters () with limiting point-source magnitudes of 22.3, 22.6, 22.7, 22.4, and 20.5, respectively, for a signal-to-noise ratio of 5:1.
The quoted photometric calibration errors are 3 % in and , and 5 % in and [18]. The instrumental response functions are given in Ref. [27] where we use the second column (respt) corresponding to 1.3 airmasses at APO for a point source.
We exclude QSOs that are classified as extended to avoid contamination from the host galaxy. This cut leaves 3692 of the original 3814 QSOs. Applying the 5:1 signal-to-noise ratio limiting point-source magnitude cut leaves 3556 of the point-like QSOs. In order to avoid confusion with Seyfert galaxies, we also exclude objects at [19, 20]. To avoid putting excessive weight in the analysis on a possible dust distribution at very high redshifts (and also to minimize a possible bias from flux limitations) we have only considered QSOs with redshift in our primary analysis, leaving 2740 point-like QSOs at . An alternative method to constrain intergalactic dust at by studying the thermal history of the intergalactic medium is presented in Ref. [21].
5 Method and results
We divide the QSO sample into redshift bins of size . In each redshift bin, we calculate the mean colour, e.g., as a measurement error weighted average. Objects that have colours that are more than off from the mean value are rejected to avoid contamination from object with anomalous colours, e.g., QSOs that have suffered severe extinction in the host galaxy.
For each set of parameter values Gpc and redshift, we simulate the attenuation due to grey dust and add to the median QSO spectrum obtained in Ref. [26].
For a pair of broadband filters and , we define
| (6) |
where is the observed colour of a QSO at redshift and the simulated colour for a specific set of dust parameter values, i.e, the colour from the template spectrum corrected for differential extinction and convolved with the SDSS filter functions. We then calculate the as a function of and as
| (7) |
where the sum is over redshift bins and is the covariance matrix defined as
| (8) |
Here, denote the systematic errors associated with each broadband filter (see Sec. 4), the template error (Sec. 6.2) and the error in the mean observed colour in each redshift bin (after the cut of outliers described above). The scatter in each redshift bin is approximately 0.2 mag so with the order of 100 QSOs in each redshift bin we have mag.
In Fig. 2, the colour-redshift evolution for a couple of different dust scenarios are compared. The upper left panel shows vs redshift for the Model A best fit parameters and Gpc and the lower left panel shows vs redshift for the Model A best fit parameters and Gpc. These parameters yield , indicating that systematic errors may have been overestimated (see Sec. 6). These plots are to be compared with the case of and Gpc that give high -values (i.e., low probabilities) for the same dust distribution model (right panels).
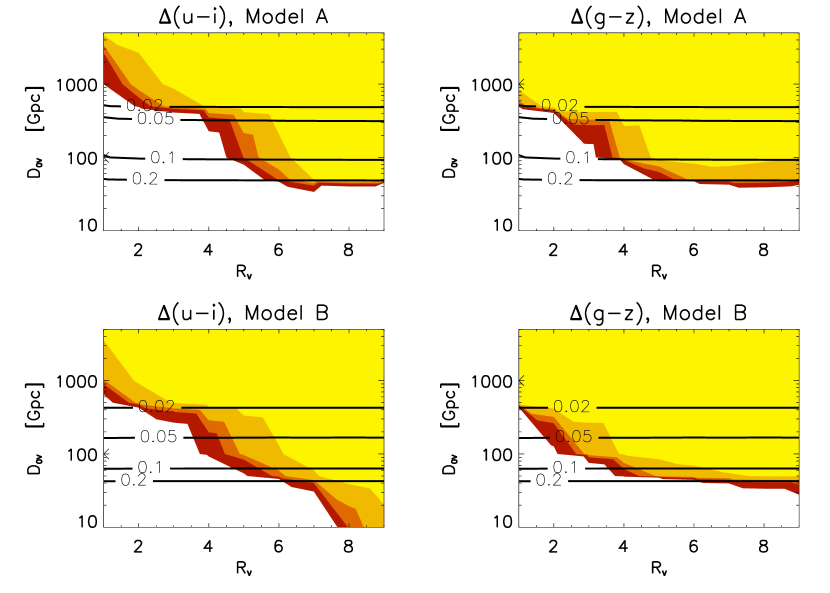
We have also investigated the dimming effect on high- sources at different wavelengths, in particular the restframe -band flux of SNIa. In Fig. 3, we have combined the results from this investigation with the results from the -test. In the left panels, the results for assuming the Model A (upper panel) and Model B (lower panel) dust distribution are shown. The right panels show the corresponding results for . The red, dark orange, light orange, and yellow regions indicate 68, 90, 95 and 99 % confidence level allowed regions from the -test. The four contour levels labeled [0.2,0.1,0.05,0.02] correspond to the amount of attenuation caused by grey dust when integrating over the restframe -band of a set of SNIa at a redshift of .
In Fig. 4, we show combined results from colours and . Allowing for any value of within the parameter range, we are able to rule out at 99 % confidence level for SNIa at . Assuming intergalactic dust properties more similar to galactic dust () we are able to do almost a factor of ten better (). Note also that all our results are consistent with a no dust hypothesis since the -values flattens out when . The small scale features in Fig. 3 and 4 are due to low resolution in the parameter grid.

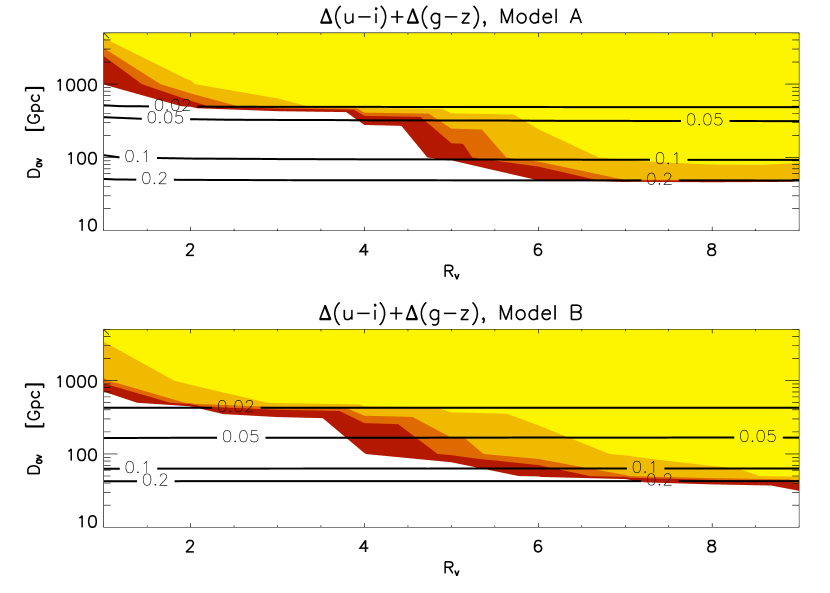
Redoing the analysis combining and yields very similar results.
6 Systematic effects
6.1 Selection effects
The selection algorithm for the SDSS quasar sample varied throughout the time that the EDR observations were obtained, so the objects in this catalog were not found via a uniform set of selection criteria [23]. Richards et al [22] analysed the limitations on the colour range of QSOs and found that for , the SDSS survey was sensitive to reddened QSOs with . We conclude that selection effects do not significantly affect our ability to compute the average colour of the QSO sample out to redshift .
6.2 Spectral evolution of QSOs
The possible spectral evolution is limited by the nearly Gaussian 20 % variations found for the whole sample. As we only consider less than half of the survey’s redshift range, systematic colour trends with redshift would not exceed 10 %. In our analysis, we use a systematic uncertainty on the magnitude derived from the median spectrum vs redshift of 10 % in and and 5 % in and . In general, unless the spectral evolution trends exactly cancel the differential extinction from dust, our limits on grey dust are conservative in the sense that the reddening that we attribute to possible extinction by dust may stem from a redder population of QSOs. Of course, a possible problem is the fact that the template spectrum we use is derived from spectra that themselves might be affected by dust absorption and extinction. Such an effect would not cause any major change in differential evolution of the QSO colours vs redshift. However, it should be noted that it could cause a close to constant offset in the colour-redshift diagram that might bias the outcome of the -analysis. An iterative method where this is corrected for by shifting the colour of the template to match the colour of the current best fit model at the mean redshift of the QSO sample () yields results similar to Fig. 4 with the exception that for Model B, the upper right corner (corresponding to high values of and ) is also excluded. However, the main conclusion that is excluded for SNIa at remains unchanged. Improved statistics and systematic errors in the QSO surveys will improve the control of systematic effects from the template spectrum, see Sec. 7.
6.3 Host galaxy dust
Internal reddening may come from depletion by material associated with the torus of gas and dust that is thought to surround the central QSO engine [18]. Richards et al. [22] estimate that 6 % of the SDSS quasar sample shows signs of reddening by dust, probably in the host environment. The computation of average colours for each redshift bin takes this into account by an iterative rejection mechanism where QSOs more than away from the average colour at that redshift are rejected, see Sec. 5. Thus, the tails of the distribution are suppressed. Remaining reddened QSOs would tend to make our limits more conservative, as the residual host galaxy dust would be counted as possible intergalactic dust.
6.4 Evolution of dust properties
Although we have assumed a constant value of for the redshift range , our derived limits show only moderate dependence on the actual value of the reddening parameter. A variation of within the considered range would thus not lead to a significant difference in the observed attenuation of high- SNIa.
7 Future prospects
The Sloan Digital Sky Survey has recently made available the Data Release One (DR1) with spectroscopic parameters for 17 700 medium- () and 980 high- QSOs (), including reprocessed data from the Early Data Release. A catalog of DR1 QSOs is being prepared [24] and we plan to redo the analysis with the full data set when the catalog is completed. The increased number of QSOs will of course help in decreasing the statistical error. Hopefully, the added data will also be helpful in order to improve our understanding of different systematic effects. For example, it should be possible to constrain the possible evolution of QSO colours and minimize the systematic error from the spectral template by studying the homogeneity of QSO spectra over a range of redshifts.
8 Summary and conclusions
Studying the redshift evolution of colours of QSOs from the Sloan Digital Sky Survey Early Data Release, we constrain the effect from extinction by homogeneous intergalactic dust on high- observations. We compare observed spectra from 2740 QSOs at with simulated spectra obtained by adding the attenuation due to different grey dust scenarios to a reference median QSO spectrum. For each dust model, we also compute the related extinction effects on high- SNIa.
For a wide range of models for the dust distribution and extinction properties, we are able to rule out at 99 % confidence level for SNIa at . This is comparable to current SNIa survey errors and allows us to rule out the “grey” dust scenario as an alternative to the cosmological constant explanation for the observed faintness of high- SNIa. It should be noted that these results are based on the specific parameterization of the wavelength-dependent dust attenuation given in Ref. [14] and that the validity of this specific parameterization for very high values of remains untested.
To constrain the dark energy properties (e.g., the equation of state parameter) with future SN surveys such as SNAP, yet better constrains on dimming by grey dust are required. Assuming intergalactic dust properties similar to galactic dust () the present analysis rules out . However, for a more general dust scenario, larger statistical samples and better control of the systematics of the QSO sample are required. Hopefully this will be within reach with future data sets from, e.g., the Sloan Digital Sky Survey.
Acknowledgments
The authors would like to thank Anthony Aguirre and the anonymous referee for careful reading and valuable suggestions improving the quality of the manuscript. They would also like to thank Mamoru Doi and Gordon Richards for help regarding the SDSS response functions. A.G. is a Royal Swedish Academy Research Fellow supported by a grant from the Knut and Alice Wallenberg Foundation.
Funding for the creation and distribution of the SDSS Archive has been provided by the Alfred P. Sloan Foundation, the Participating Institutions, the National Aeronautics and Space Administration, the National Science Foundation, the US Department of Energy, the Japanese Monbukagakusho, and the Max Planck Society. The SDSS Web site is http://www.sdss.org/. The Participating Institutions are the University of Chicago, Fermilab, the Institute for Advanced Study, the Japan Participation Group, the Johns Hopkins University, the Max Planck Institute for Astronomy (MPIA), the Max Planck Institute for Astrophysics (MPA), New Mexico State University, Princeton University, the United States Naval Observatory, and the University of Washington.
References
- [1] Aguirre, A., 1999, Astrophys. J. 512 L19
- [2] Aguirre, A., 1999, Astrophys. J. 525 583
- [3] Perlmutter, S. et al., 1999, Astrophys. J. 517 565
- [4] Riess, A. G. et al., 1998, Astron. J. 116 1009
- [5] Spergel, D. N. et al., arXiv:astro-ph/0302209
- [6] Freedman, W. L. et al., 2001, Astrophys. J. 553 47
- [7] Percival, W. J. et al., 2001, MNRAS 327 1297
- [8] Blanchard, A., Douspis, M., Rowan-Robinson, M. & Sarkar, S., arXiv:astro-ph/0304237
- [9] Kochanek, C. S. & Schechter, P. L., arXiv:astro-ph/0306040
- [10] Aguirre, A. & Haiman, Z., 2000, Astrophys. J. 532 28
- [11] Goobar, A., Bergström, L. & Mörtsell, E., 2002, Astron. & Astrophys. 384 1
- [12] SNAP Science Proposal, available at http://snap.lbl.gov
- [13] Draine, B. & Lee, H., 1984, Astrophys. J. 285 89
- [14] Cardelli, J. A., Clayton, G. C. & Mathis, J. S., 1989, Astrophys. J. 345 245
- [15] Goobar, A., Mörtsell, E., Amanullah, R., Goliath, M., Bergström, L. & Dahlén, T., 2002, Astron. & Astrophys. 392 757
- [16] SDSS homepage: http://www.sdss.org/
- [17] 2dF homepage: http://www.mso.anu.edu.au/2dFGRS/
-
[18]
Stoughton, C. et al., 2002, Astron. J. 123 485
data available at http://archive.stsci.edu/sdss/quasars/ - [19] Richards, G. T. et al., 2001, Astron. J. 121 2308
- [20] Richards, G. T. et al., 2001, Astron. J. 122 1151
- [21] Inoue, A. K. & Kamaya, H., 2003, MNRAS 341 7
- [22] Richards, G. T. et al., arXiv:astro-ph/0305305
- [23] Schneider, D. P. et al., 2002, Astron. J. 123 567
- [24] Schneider, D. et al., 2003, in prep.
- [25] Telfer, R. C., Zheng, W., Kriss ,G. A. & Davidsen, A. F., 2001, Astrophys. J. 565 773
-
[26]
Vanden Berk, D. E. et al., 2002, Astron. J. 122 549
data available at http://archive.stsci.edu/sdss/documents/sci_ready/qso.median.110700.dat - [27] Strauss, M. & Gunn, J., http://archive.stsci.edu/sdss/documents/response.dat