Variations in the Abundance Pattern of Extremely Metal-poor Stars and Nucleosynthesis in Population III Supernovae
Abstract
We calculate nucleosynthesis in Population (Pop) III supernovae (SNe) and compare the yields with various abundance patterns of extremely metal-poor (EMP) stars. We assume that the observed EMP stars are the second generation stars, which have the metal-abundance patterns of Pop III SNe. Previous theoretical yields of Pop III SNe cannot explain the trends in the abundance ratios among iron-peak elements (Mn, Co, Ni, Zn)/Fe as well as the large C/Fe ratio observed in certain EMP stars with [Fe/H] . In the present paper, we show that if we introduce higher explosion energies and mixing-fallback in the core-collapse SN models of , the above abundance features of both typical and C-rich EMP stars can be much better explained. We suggest that the abundance patterns of the [Fe/H] stars correspond to supernova yields with normal explosion energies, while those of the carbon un-enhanced ([C/Fe] ) stars with [Fe/H] correspond to high-energy supernova yields. The abundance patterns of the C-rich ([C/Fe]) and low [Fe/H] () stars can be explained with the yields of faint SNe that eject little Ni as observed in SN1997D. In the supernova-induced star formation model, we can qualitatively explain why the EMP stars formed by the faint or energetic supernovae have lower [Fe/H] than the EMP stars formed by normal supernovae. We also examine how the abundance ratios among iron-peak elements depend on the electron mole fraction , and conclude that a large explosion energy is still needed to realize the large Co/Fe and Zn/Fe ratios observed in typical EMP stars with [Fe/H] .
Subject headings:
Galaxy: halo — nuclear reactions, nucleosynthesis, abundances — stars: abundances — stars: Population III — supernovae: general — supernovae: individual (SN1997D)1. Introduction
In the early universe, where the metal content of gas is very low, the enrichment by a single supernova can dominate the pre-existed metal contents (e.g., Audouze & Silk 1995). Low mass stars formed in the gas survives until today, and observed as extremely metal-poor (EMP) stars. Since EMP stars may preserve abundance patterns synthesized by a single or few supernovae (SNe), the abundance patterns of those stars may be used to test supernova explosion and nucleosynthesis theories, and to infer the nature of the first generation stars and supernovae.
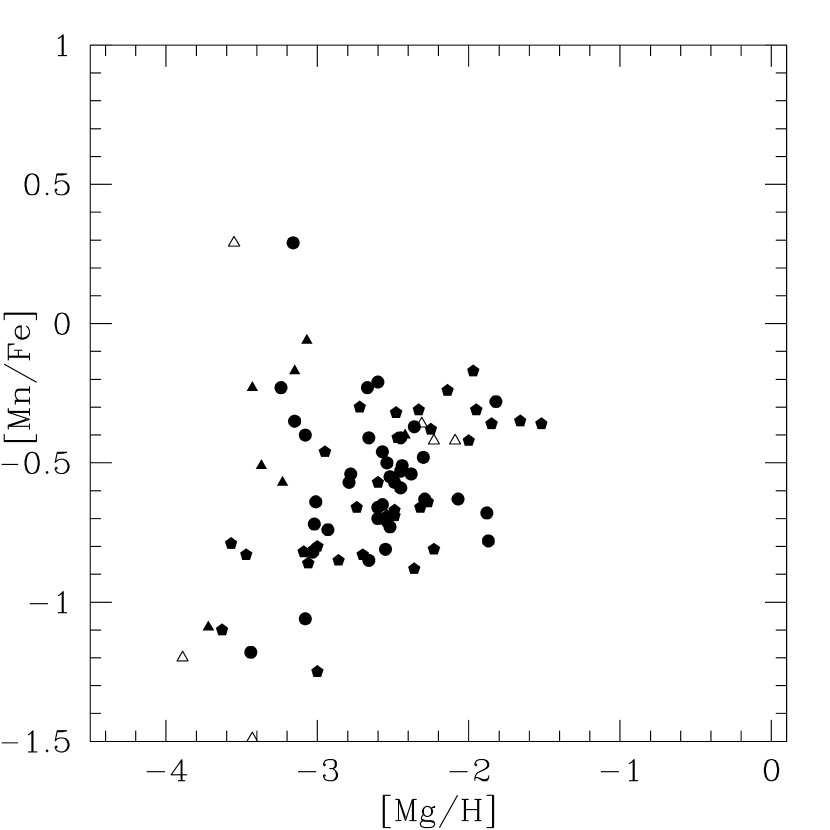
The abundance patterns of EMP stars show interesting trends below [Fe/H] ; with increasing [Fe/H], [Mn/Fe] and [Cr/Fe] increase while [Co/Fe] and [Zn/Fe] decrease, where [X/Y]log(X/Y)log (McWilliam et al. 1995; Primas et al. 2000; Spite et al. 2003). These trends can be explained if the EMP stars with lower [Fe/H] were enriched by a supernova ejecting relatively more complete Si-burning matter (e.g., Co, Zn) than incomplete Si-burning matter (e.g., Mn). This is realized if the “mass-cut”, that divides the supernova ejecta and the central remnant, is relatively deeper (Nakamura et al. 1999). A question is why lower metallicity EMP stars are enriched by SNe with relatively deeper mass-cuts. In this paper (Section 2), we show that the variation of the explosion energy can nicely explain this relation (see also Umeda & Nomoto 2002a,b, 2003 and Nomoto et al. 2003, for brief explanations).
The large Zn/Fe ratios typically observed in EMP stars (Primas et al. 2000; Depagne 2003; Cayrel et al. 2003) have not been explained with conventional supernova yields, except for the suggestion that Zn could be produced in the neutrino-powered wind (Hoffman et al. 1996). Umeda & Nomoto (2002a; UN02 hereafter) have provided first yields of the core collapse SN models that have large enough Zn/Fe ratio to be consistent with the EMP stars if the explosion energies are sufficiently large (i.e., “Hypernova” models; Nomoto et al. 2004).
One important implication of the hypernova model for the abundances of EMP stars is that mixing and fall-back are required to take place in the inner part of the ejecta. The large Zn/Fe is realized only if the mass-cut is sufficiently deep. If the mass-cut is deep enough to eject Zn, however, too much Fe is ejected and the ratios between lighter elements and Fe, such as Mg/Fe, become too small.
To solve this problem, UN02 have proposed that mixing-out of Zn and the subsequent fall-back of sufficient amount of the mixed material take place in the ejecta. Mixing due to Rayleigh-Taylor instabilities is initiated at a steep density gradient when the expanding core is largely decelerated by the reverse shock generated at the core-envelope interface (e.g., Ebisuzaki et al. 1989; Arnett et al. 1989; Hachisu et al. 1990; Kifonidis et al. 2000). Simultaneously such a deceleration causes fallback of the mixed material (e.g., Chevalier 1989; Herant & Woosley 1994; see Colgate 1971 for pioneering work). Therefore, the extent of mixing and the amount of fallback both depend on the stellar mass, presupernova density structure, explosion energy, asphericity, etc., which must be examined systematically with the multi-dimensional simulations. Although we treat the mixing and fallback as free-parameters in the present study, the resultant abundance pattern in the ejecta in comparison with the observations may provide interesting constraints on these parameters. We also note that a similar effect to mixing-fallback also occurs in the jet-like explosion. In such a model, energetic explosion occurs only along the jet directions and thus the total Fe mass can be smaller with enhancement of the complete Si-burning products (e.g. Maeda & Nomoto 2003a,b).
Although Nakamura et al. (1999) have successfully explained the trend in Fe-peak elements, one may wonder whether the absolute values of the abundances fit to the observations as well as elements other than Fe-peak. Chieffi & Limongi (2002, CL02 hereafter) compares UN02 and Woosley & Weaver 1995 (WW95 hereafter) with the typical EMP abundances and concluded that none including theirs fit to the observations well. They proposed as a possible solution that a progenitor model with a large C/O ratio may solve the discrepancy. In this paper, instead, we show that the absolute abundance of Co and Mn are quite sensitive to , and the fit to the observations becomes significantly improved with a certain choice of reasonable value of .
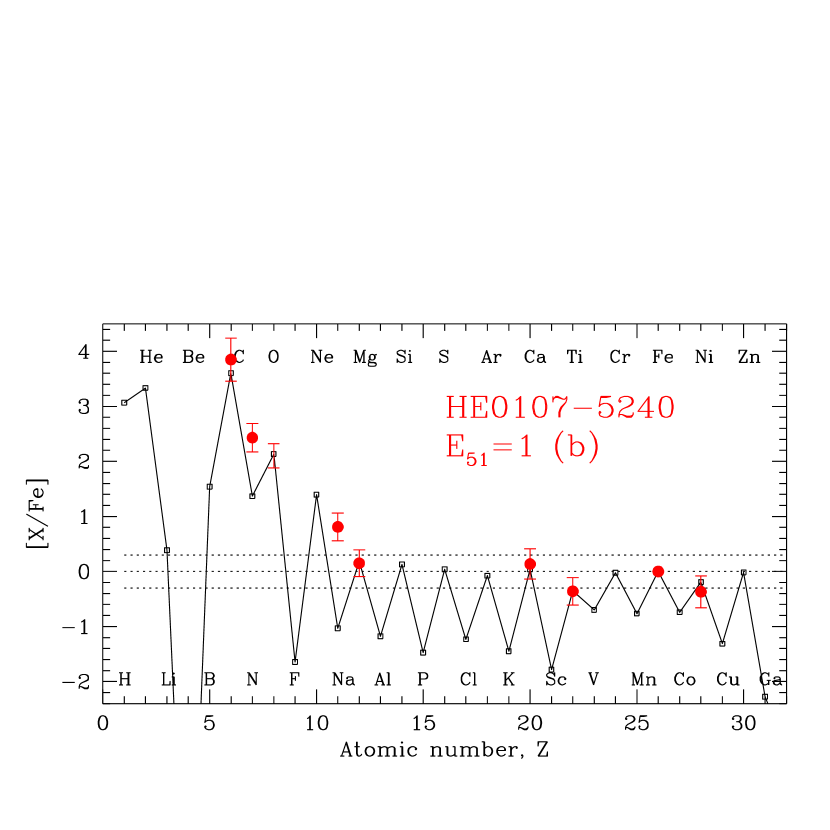
Are the abundances of all EMP stars consistent with hypernova nucleosynthesis? There is a sub-class of EMP stars, C-rich EMP stars, including the most Fe deficient star HE0107-5240 with [Fe/H] (Christlieb et al. 2002). These stars are quite rich in C and N, typically [C/Fe] 2, and in some stars Mg as well. Recently we have shown that the abundances of these stars are well reproduced with the yields of core-collapse SNe which undergo small Fe ejection and mixing-fallback (Umeda & Nomoto 2003, UN03 hereafter). We showed that not all C-rich EMP stars favors high-energy models. In fact the abundance pattern of HE0107-5240 is well reproduced by a low-energy ( ergs =0.3, where is the explosion of the SN) model. In this paper we compare our models with other C-rich EMP star abundances and constrains the models from fitting to the data. We demonstrate that the difference in the degree of the mixing, fallback and explosion energies may explain both the C-rich and usual EMP stars.
2. Nucleosynthesis calculations
The calculation method and other assumptions are the same as described in Umeda et al. (2000), UN02 and UN03. The isotopes included in the network for explosive burning are shown in Table 1. After the post-process nucleosynthesis calculations, we calculate the final yields by setting the final mass-cut and the mixing-fallback parameters. More detailed description and the definition of the mixing-fallback parameters are given in Section 3.2 (also in UN02). We treat the mixing and fallback as free-parameters in the present study, by the reason described in Introduction.
We take the progenitor mass and the explosion energy as independent parameters for the following reasons. For a given progenitor model, if the explosion mechanism (or the procedure for the artificial explosion) is specified the remnant mass is uniquely determined as a function of the explosion energy (e.g., WW95; Limongi & Chieffi 2003). However, we do not specify the explosion mechanism, especially because precise explosion mechanism is unknown for hypernovae. Also, the density structure of the progenitors depends complicated on the initial mass, treatment of convections and uncertainties in the nuclear reaction rate. Different density structure leads the different remnant mass with the same explosion energy. Furthermore, if the mixing-fallback effect is considered to be a 1D (approximate) representation of a jet-like explosion, then the energy of the 1D model no longer matches with the total explosion energy and independent of the remnant mass. Note the amount of fallback is not necessarily smaller for larger (Herant & Woosley 1994).
Since we explode the progenitor model when the central density of 3 g cm is reached without calculating further collapse and bounce, our approach may be regarded as simulating the prompt explosion. However, the results will not be much different from the delayed explosion. In the delayed explosion, more materials fall onto the central remnant, which makes the mass-cut larger and changes in the complete Si-burning region. (See Thielemann, Nomoto, & Hashimoto 1996 for the study of this effect). This effect may be important for relatively less massive () progenitors with low explosion energy. On the other hand, in massive and energetic explosions (i.e., in hypernovae), explosive nucleosynthesis takes place in outer regions where is not sensitive to the location of the mass-cut. We study the dependence of nucleosynthesis on in section 3.1, since may be modified by the neutrino process.
3. EMP Stars with Typical Abundance Pattern
3.1. Trends in the iron peak elements and hypernovae
Umeda & Nomoto (2002b) has shown that the trends in the abundance ratios of Fe-peak elements, [(Zn, Co, Mn, Cr)/Fe] vs [Fe/H], can be understood by the variations of deepness of mass-cut in the explosive nucleosynthesis of SNe II. We also have suggested that the large Zn/Fe and Co/Fe ratios in typical EMP stars are well-reproduced by hypernova nucleosynthesis. In this section, we describe how closely these facts are related and how observed trends, and not just variations, can be explained with the energy of supernovae.
For a larger explosion energy, the supernova shock is stronger and the temperature after the shock passage is higher. The post-shock region is radiation dominant, so that the peak temperature is approximately related to the stellar radius and the deposited energy as
| (1) |
where is the peak temperature in 10 K and is the deposited energy. Complete Si-burning, which burns Si completely, occurs for . In this region, elements such as Ni, Ge (decaying into Zn) and Cu (decaying into Co) are produced. Incomplete Si-burning occurs for . In this region elements such as Ni, Fe (decaying into Cr) and Co (decaying into Mn) are produced.
For a larger explosion energy, the complete Si-burning region is enlarged in mass more than the incomplete Si-burning region (see Figure 1 and its caption). As a result, the mass ratio between the complete and incomplete Si-burning regions is larger in a more energetic explosion if the mass-coordinate of the mass-cut does not change significantly. In this sense, increasing the energy produces similar effects to making the mass-cut deeper without actually changing the mass coordinate of mass-cut. In addition, complete Si burning in the higher energy model has better features than in the deeper mass cut model in explaining the observed features: (1) the overproduction of Ni in the latter model (Nakamura et al. 1999) can be avoided because of larger , and (2) a larger amount of Zn can be synthesized because of higher entropy, and thus stronger -rich freezeout in the higher energy model (Nakamura et al. 2001b; UN03).
Regarding [Zn/Fe], Zn is quite abundant in a typical EMP star, i.e., [Zn/Fe] 0.3 - 0.8 (Primas et al. 2000; Depagne 2003; Cayrel et al. 2003). We have shown that such large Zn/Fe ratio is difficult to produce by SNe with normal explosion energy ( erg), but possible by energetic core collapse SNe with erg or more (UN02).
We assume that EMP stars are formed in the supernova ejecta mixed with interstellar matter. In this “supernova-induced star formation model”, the [Fe/H] (or [Mg/H]) of an EMP star is determined by the Fe (or Mg) mass ejected from a SN, divided by the hydrogen mass in circum stellar matter swept by the SN shock. It is estimated that the swept hydrogen mass is roughly proportional to the explosion energy (Ryan, Norris, & Beers 1996; Shigeyama & Tsujimoto 1998). Thus we may write that
| (2) |
where Fe, Mg and H represent mass fraction of Fe, Mg and H, respectively; is the explosion energy in 10 erg, and C() are “constants”. Here C() may not be exactly constants. These values depend on how much metal is actually mixed with the star-forming gas, thus depending on detailed hydrodynamical mixing, turbulent motion, local inhomogeneities and some other factors. These values, therefore, possibly distribute around certain mean values. In this case, the EMP stars produced by more energetic SNe are expected to have smaller [Fe/H] and [Mg/H] in a statistical sense.
Nakamura et al. (2001b) also systematically studied nucleosynthesis in hypernovae and showed that Fe/ and Mg/ decrease significantly with increasing ; this tendency is consistent with the observations and models of SN 1998bw (=50) and SN 1987A (=1), where Mg/ and Fe/ of SN 1998bw are smaller than SN 1987A by a factor of 20 and 8, respectively (Nakamura et al. 2001a).
In this explanation, [Fe/H] of EMP stars is almost independent of the initial metallicity and the age of the SNe progenitor. We calculate nucleosynthesis for several models with different masses and energies as shown in Table 2, and plot the yield ratios [(Zn, Co, Cr, Mn)/Fe] vs log (Mg/) in Figure 2. Several quantities related to these models are also shown in Table 3 and 4. Here, Mg is adopted for abscissas because the ejected mass of Mg is less sensitive to the mass-cut than that of Fe. For the initial He abundance, we adopt .
Throughout this paper the mass-cut (or the “initial” mass-cut in the mixing-fallback model, see below) is chosen to maximize the Zn/Fe ratio in the models with the original distribution, unless otherwise stated.111 Zn (the dominant isotope is Zn for Pop III SNe, which is the decay product of Ge) is mostly produced in the complete Si-burning region where and the Zn/Fe ratio decreases for lower (see UN02 and also Figure 4 of this paper). Therefore, as the mass-cut decreases, [Zn/Fe] in the ejecta first increases and then decreases. The “maximum” [Zn/Fe] we mention is the first maximum obtained in this region. Depending on the distribution of in progenitor models, the [Zn/Fe] may show the second peak for much smaller mass-cut where is very low (Hoffman et al. 1996). However, in this paper, we are not considering such low regions because these regions often over-produce too neutron-rich isotopes together. This is because the observed large value of [Zn/Fe] for typical EMP stars ([Fe/H] ) are almost always under-produced in our low energy models and also in previously published other groups’ yields. As mentioned above, [Zn/Fe] is enhanced in the high-energy models but it is rarely over-produced for any parameter choices.
As shown below, we often modify of the progenitors, but then the location at the Zn/Fe maximum changes. In this paper, we always adopt the same (initial) mass-cut as the model with the original distribution. The observed values of [Co/Fe] in EMP stars also tend to be underproduced. Maximizing [Zn/Fe] is also good for making [Co/Fe] large, because Zn and Co are produced roughly in the same region. We determine the mass-cut in this way to reduce the parameters and explore the results in a systematic way.
Figure 2 exhibits that the high-energy models tend to be located at lower [Mg/H] = log (Mg/ (if distribute around a certain peak value), and thus can explain the observed trend. Note that [Mg/Fe] for typical EMP stars and thus the observed general trends preserve even though the abscissa is changed from log (Mg/ to [Mg/H] as shown in Figure 3. The observed data vs [Fe/H] are shown later in Figure 5.
Note that the trends in the Figure 2 are preserved in the mixing-fallback model described in the subsection 2.2, because all the quantities in Table 2 are independent of the ejected Fe mass, or the ejection factor, , as far as the outer boundary of the mixing region, (out), is fixed to be at the outer-boundary of the incomplete Si-burning region as assumed in UN02.
Although we could explain the trends, Co/Fe and Mn/Fe ratios in Table 2 are too small to be consistent with observations in the absolute values. Here we note that the yields of Co and Mn are sensitive to the details of the explosion, nuclear reaction rates and . Among them, the effect of change due to the neutrino process during explosion may be important. In our previous works, we have assumed that the pre-supernova value of is preserved during the explosive burning. In the models, above the pre-supernova oxygen layer and decreases gradually toward the Fe core (UN02). However, recent detailed simulations of neutrino transport in core-collapse SNe show that may be significantly affected by the neutrino process during explosion (Liebendörfer et al. 2003; Janka, Buras, & Rampp 2003). It is interesting that in the deep core may be realized, for which nucleosynthesis has not been systematically studied before.
The region where large enhancement occurs due to neutrino absorption is Rayleigh-Taylor unstable because of associated large enhancement of entropy due also to neutrino absorption. The resultant development of Rayleigh-Taylor instabilities should largely change the -profile. Since it is not known how large is the change and to which region the change propagates, we treat the -profile as a free-parameter and discussed what -profile would produce a reasonable results.
We show in Figure 4 how the abundances of Fe-peak elements depend on the value of . Here, we change inside the incomplete Si-burning region, and the mass-cut is chosen to maximize the Zn/Fe ratio. The adopted supernova model is a 25 model with the explosion energy . Production of Mn is larger for and Co production is significantly enhanced for . More detailed discussion on the nucleosynthesis for the matter and its implications will be discussed elsewhere, but here we suggest that the effect of may be very important for explaining large Co/Fe ratios observed in typical EMP stars.
As an example, we show in Figure 5 the yields for the (15, ) and (25, =30) models compared with the observations. Some data related to these models are shown in Table 5.
We determine [Fe/H] of these models by assuming [Fe/H] = log(Mg/) + with . Here we determine [Fe/H] with log(Mg/) and not directly with log(Fe/) because the ejected mass of Fe is much uncertain than that of Mg. The ejected Fe mass strongly depends on mixing-fallback parameters (see Sec. 3.2), but Mg does not as far as (out) is located below Mg-rich region. This assumption is not unreasonable because [Mg/Fe] for typical EMP stars and roughly independent of [Fe/H] (e.g., Cayrel et al. 2003).
In these models, we assume that in the complete Si-burning region and in the incomplete Si-burning region. We modify mostly by adjusting the isotope ratios of silicons. Modification of by using other elements is found to lead to a negligibly small difference in the final result. For such a distribution, both the Co/Fe and Mn/Fe ratios are enhanced and fits better to the observed values. This “inversion” of may be possible according to the most recent explosion calculations.
3.2. Comparison with individual star
In this subsection, we compare the typical abundance pattern of EMP stars with core-collapse SNe yields. This was, for example, recently done in CL02. They compared their and other groups’ (WW95 and UN02) SN yields with the observational points given by Norris, Ryan, & Beers (2001, NRB01 hereafter). According to them, all the models including theirs using the ”High” C()O rate do not fit well with observations. Here the ”High” C()O rate is the value given in Caughlan et al. (1985) which was adopted to explain the solar abundance ratios by SNe II (e.g., Thielemann, Nomoto, & Hashimoto 1996; WW95). According to them, their low C()O rate model (L model) fits better to the observations, though some elemental ratios cannot be reproduced. Here the ”Low” C()O rate given in Caughlan & Fowler (1988, CF88 hereafter) is used. In their L model, Co/Fe and Sc/Fe ratios are greatly enhanced to be compatible with the observations.
CL02 explained the reason for these enhancements as follows: The increase in the carbon abundance leads to a more flattened-out final mass-radius relation because the contraction of the ONe core is slowed down by the presence of a very active C-burning shell. As a consequence, the average density in the regions that experience complete and incomplete explosive Si burning will be lower as well. The net result is that the -rich freeze-out is considerably favored and also that the overall amount of synthesized Ni is significantly reduced. These effects tend to increase significantly both [Sc/Fe] and [Co/Fe] (for any chosen mass-cut location).
We have investigated from our sample of progenitor models with relatively high C/O ratios after the central He-burning (C/O and ) whether we also obtain such high Co/Fe ratios. However, so far we have not found such significant enhancement of the Co/Fe and Sc/Fe ratios (see Table 6). This is likely because the density structure of the progenitors depends not only on the C/O ratio but the treatment of convection, and thus the large C/O ratio may not always lead to significantly low density. Also, since CL02 used a simple analytic model for the density-temperature evolution during explosion, this might produce some differences with our method. Furthermore, we are not in favor of the large C/O solution, since it is well known that such large C/O models overproduce Ne and Na in the solar metallicity models (Woosley & Weaver 1993; Nomoto et al. 1997; Imbriani et al. 2001). CL02 suggested that if the 25 stars were not the representative of the solar-metallicity core collapse SNe, this problem may be avoided. However, then one has to adopt rather unconventional IMF and such IMF must confront with several observational constraints.
In this paper, we show a different solution where the fit to the observations ([Co/Fe] and [Mn/Fe]) are significantly improved by choosing a reasonable value of but without adopting the high C/O; this is because the absolute abundance of Co and Mn are quite sensitive to .
The large Sc/Fe ratio is still hard to explain by changing . In Appendix we show a modified model that enhances Sc/Fe. The Sc/Fe ratio can be largely enhanced if the densities during explosion are sufficiently lowered than in the ordinary model by any mechanism, e.g., by ejecting small jets. In Appendix, we show in such “low-density” models, these ratios are significantly enhanced. Interestingly, even with the low-density, we still need high explosion energy to explain the observed large Zn/Fe ratio together with Sc/Fe.
We will describe more details of the low-density models elsewhere and in this paper (except the Appendix) only consider the effect of large ) and large explosion energies to explain the observed Co/Fe ratio.
In Table 7, we summarize several properties of our pre-supernova progenitor models used in the rest of this paper. This table shows the initial stellar mass, metallicity, the adopted C()O rate, the central C/O mass fraction ratio just after core helium burning, Fe-core mass (defined by ), O-burning shell (defined by X(O) ), C-O core mass (defined by X(He)), and He core mass (defined by X(H)).
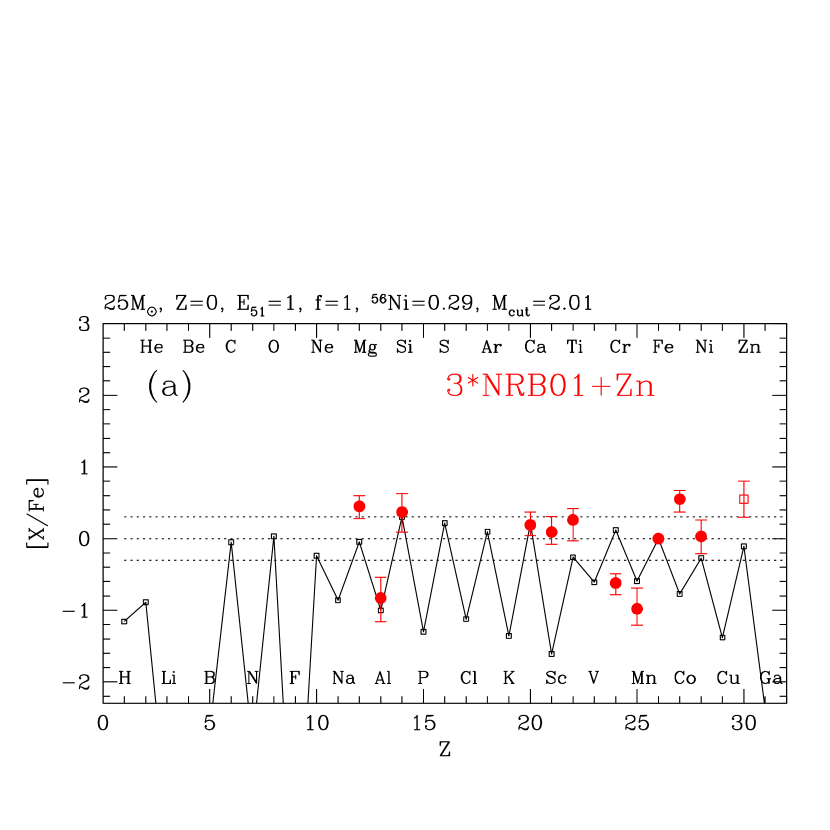
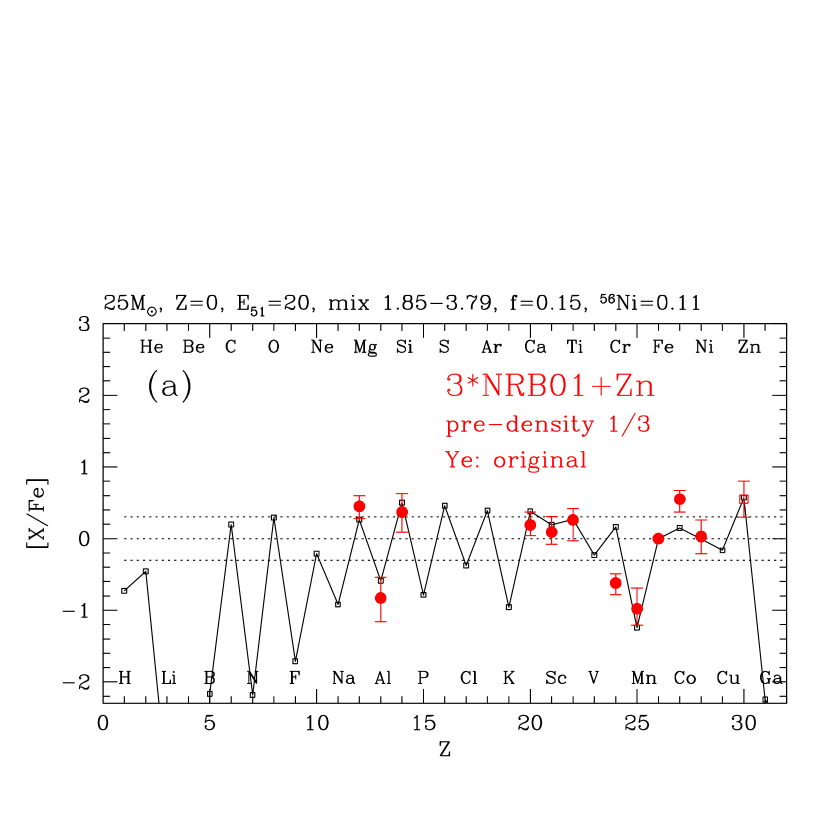
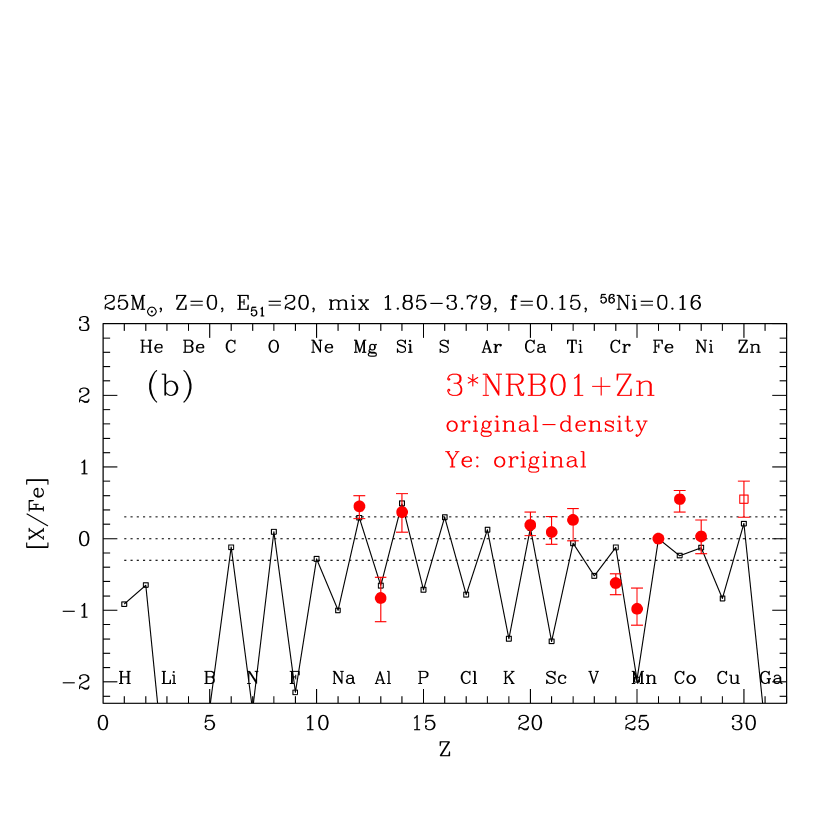
In Figure 6, we compare our models with typical abundance patterns of EMP stars. The observed points are the ”averaged” abundances of three stars CD-38245, CS22172-002 and CS22885-096 given in NRB01. These stars have similar abundance patterns and similar metallicity: the [Fe/H] of these stars are 3.98, 3.61, and 3.66 respectively. The solid circles in Figure 6 represent the averaged abundance of these stars, and the errorbars represent the range of errorbars of these stars. Since the variation in [C/Fe] is large and only the upper-limit is given for CD-38245, we do not include the [C/Fe] point. The NRB01 data do not include the Zn point. However, the overabundance of Zn is quite common among EMP stars (Primas et al. 2000; Depagne 2003; Cayrel et al. 2003), [Zn/Fe] is roughly homogeneous for [Fe/H] , and the point is crucial to estimate the explosion energy; therefore, we add the value of [Zn/Fe] in the figure: specifically, [Zn/Fe]= 0.3 from Depagne (2003) and Cayrel et al. (2003). The theoretical yield in Figure 6(a) is obtained for the zero metallicity (Pop III) 25 star after explosion with =1.
The calculation method and other assumptions are the same as described in Umeda et al. (2000), UN02 and UN03, and the progenitor model used in Figure 6(a) is the same as used in UN02. In this model, the mass-cut is located at mass coordinate 2.01 . This mass-cut is chosen to maximize the Zn/Fe ratio in the original models (although is modified in this model) as described in Section 2.1. The fit in Figure 6(a) is not very good because of the underabundances of Mg, Sc, Ti, Co, Zn and overabundance of Cr.222 Here, we briefly describe our stance in the comparison between theoretical models and observations. It is of course best if the model and the observed points fit exactly. However, most data shown in this paper does not include unknown systematic errors. Also in the theoretical models, there should be some uncertainties not included in this paper. For example, many of nuclear reaction rates may not be exactly correct and some of them could significantly alter the results. Therefore, we should always be somewhat tolerate to the “small” discrepancies between the models and observations. At the same time, we should always remind that the matching between observations and theories might be just an accident and does not represent the true correctness of the model. In general, we call the model or a specific parameter choice “good” or “better” if the model is much closer (even though it is still outside the shown error-bars) to the observation than our other models.
The underabundances of Mg in the model can be resolved if larger is chosen, for which the ejected mass of Fe (decay products of Ni) is smaller. The overabundance of Cr and underabundances of Co are, on the other hand, improved if is smaller (e.g., Nakamura et al. 1999). Therefore, these problems cannot be solved just by changing the mass-cut. In UN02, we proposed one solution for this problem, which is the mixing-fall back mechanism. If the inner part of the ejecta is mixed with the outer materials, and later some of the mixed materials are fallen-back to the central remnant, the ratio of the lighter elements, such as Mg and Al, to Fe increases without changing the abundance ratios in the Fe-peak elements. We also note that the dependence of the yields on the progenitor’s mass is too small to solve the problem of the underabundance of Co/Fe and Zn/Fe (see e.g., UN02).
In the mixing-fallback model, we define the following locations of , and a function :
-
•
(ini): initial mass-cut, which is equal to the internal border of the mixed region. We called it “mass-cut” because the matter above which is ejected even a fraction.
-
•
(out): outer border of the mixed region.
-
•
(fin): the final mass of the remnant.
-
•
: a fraction of matter ejected from the mixed region of (ini) (out).
Here, the inner most materials are first mixed in the region between (ini) and (out), and some fraction of the matter, , is fallen-back later on to the central remnant.
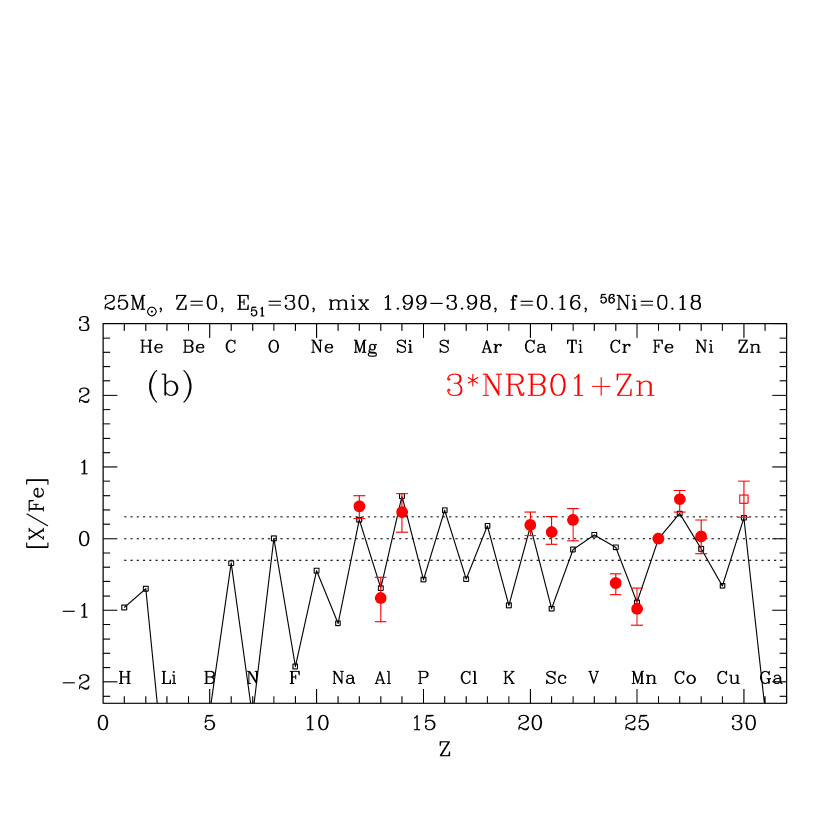
As shown in UN02, the Zn/Fe and Co/Fe ratios are significantly enhanced if the explosion energy is larger. In Figure 6(b), we show such a high-energy model with =30. This is the “best” fitted model among the four models shown in Figure 6. We note that better fitted one may be obtained by slightly changing , and mixing-fallback parameters, but finding “exactly the best” fitted model is not the purpose of this paper. What we would like to stress here is the high-energy models are in much better agreement with observations than the low-energy models.
Here the mixing-fallback mechanism is more important than in the low energy models, because larger amount of Fe (i.e., Ni) is synthesized so that larger fall-back is necessary for more energetic explosions. In this model, (ini)=2.35 , (out) = , , and (fin)=4.10 . (out) is chosen to be near the top of the incomplete-Si burning as in UN02. The ejection factor means that 10% of the mixed matter is ejected and 90% is fallen-back. This model fits much better to the observations than the low energy models.
Here we explain the meaning of the numbers shown at the top of Figure 6(b) and others. This model uses the initially progenitor model with initial metallicity with explosion energy . ’mix 1.99-3.98’ means that (ini)=1.99 and (out)= 3.98. With the ejection factor one can calculate the final mass-cut or the remnant mass as (fin) . The ejected Ni mass is 0.18 .
In the model in Figure 6(b), all elements other than Sc, Ti and Cr fit well to the observation. It is known that the Ti abundance is enhanced if the explosion is aspherical (Nagataki 2000; Maeda & Nomoto 2003a,b). For an aspherical explosion Ca, Sc and Zn abundances are also enhanced, although the explosion energy has to be still larger than that of the canonical explosion, =1 (Maeda & Nomoto 2003a,b). We also show in Appendix that the “low-density” model, in which the density of the progenitor model is artificially reduced, can also yield significantly enhanced Sc/Fe and Ti/Fe ratios. In this paper, we do not specify the mechanism to form for the low-density, but it may be related to the jet-like explosion. If several discontinuous jets are injected and the inner part of the progenitor is expanded by weak-jets before a strong jet finally explodes the star, a low density explosion may be realized. Although we have currently no idea about the discrepancy in [Cr/Fe] and has to consider some modifications to [Sc/Fe] and [Ti/Fe], reasonably good fits of other elements make us to believe that the typical abundance pattern of EMP stars can be understood as a result of nucleosynthesis in energetic core-collapse SNe (or hypernovae).
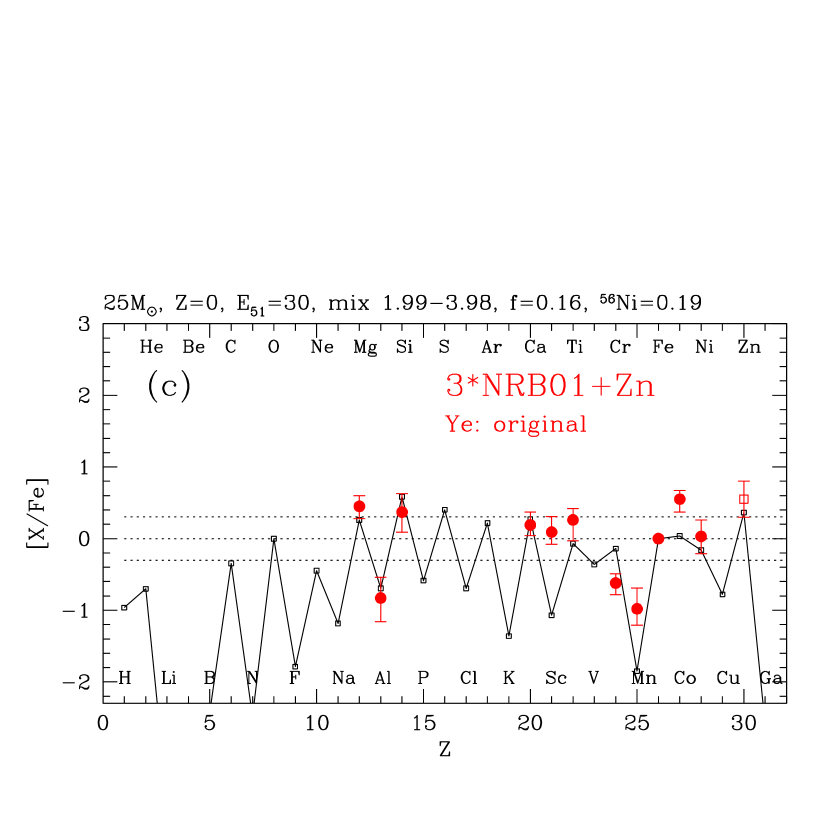
For comparison, we show in Figure 6(c) the same model as in Figure 6(b) but with the original distribution. We find that with the original distribution, [Mn/Fe] and [Co/Fe] fit much worse to the observation than the model in Figure 6(b).
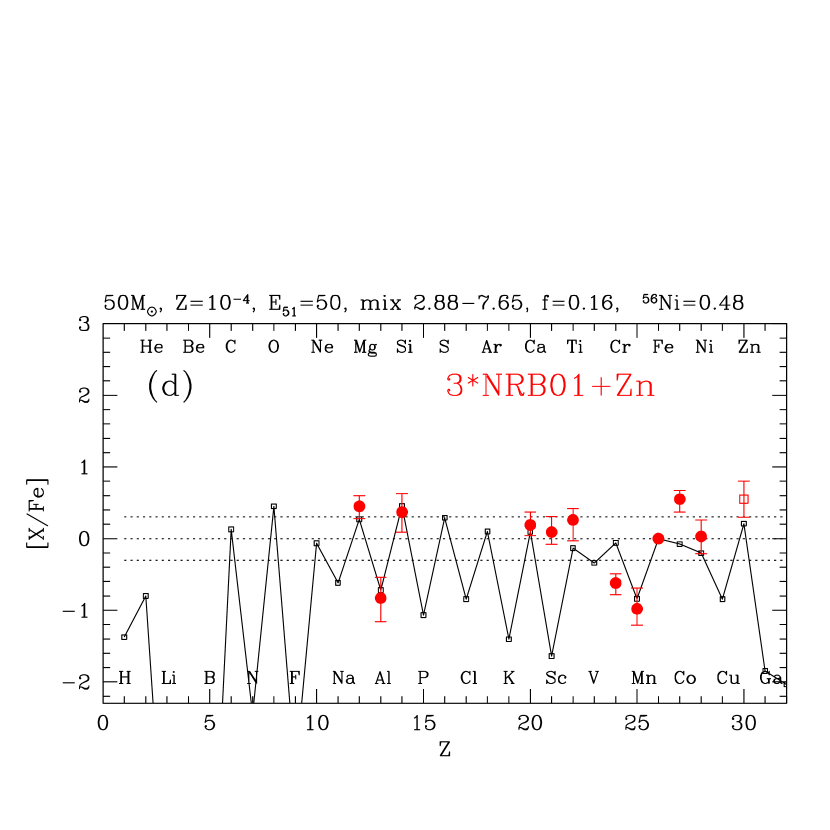
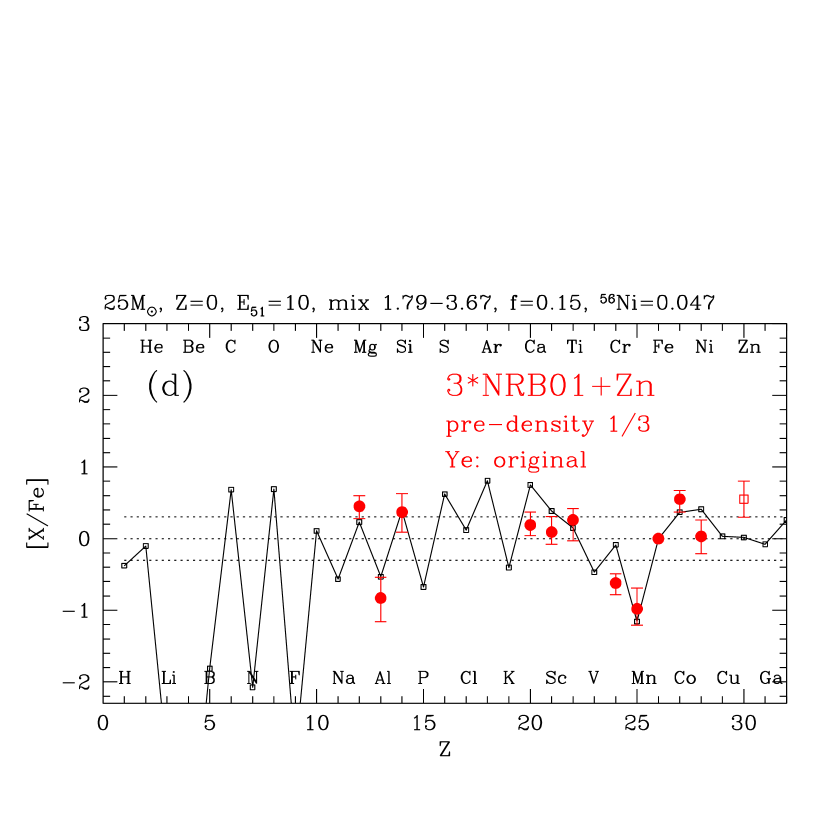
Figure 6(d) shows the comparison with the more massive and more energetic supernova model ( and = 50). Except for [Co/Fe], the fits of other elements are as good as the 25 model in Figure 6(b). This means that from the abundances of EMP stars, it is difficult to constrain the typical mass of the progenitor. We can constrain only the set of mass and explosion energy. ([Co/Fe] is expected to be larger for models with larger explosion energy and/or asphericity or lower densities (Appendix), which will be systematically examined in the future study.) At least we can say from the present SNe observations that the progenitors of energetic core-collapse SNe are more massive than . The upper mass limit is unknown, but should be lower than because above which the stars would explode as pair-instability SNe and nucleosynthesis patterns are quite different from EMP stars (e.g., UN02; Heger & Woosley 2002). Note that the (newly calculated) progenitor model used in this figure has the metallicity , but not zero. However, as shown in our previous work (Umeda, Nomoto, & Nakamura 2000), the elemental abundance pattern from SNe II are not much different for . Therefore, the Z= models can be used for the present purpose. Detailed metallicity dependent yield will be published elsewhere.
4. Abundance Pattern of C-rich EMP Stars
In this section, we compare our core-collapse SNe yields with abundances of C-rich EMP stars. Among several C-rich EMP stars we pick up 5 representative stars, C1:CS22949-037, C2:CS29498-043, C3:CS22957-027, C4:CS31062-012 and C5:HE0107-5240. C1 is interesting because the important elements O and Zn are both observed only for this star. The abundance pattern of C1 is peculiar because O and Mg are rich as well as C and N. The abundances of C2 - C4 are obtained by Aoki et al. (2002a,b). C2 is rich in C, Mg, Al and Si more than C3. C3 is much more C-rich than C1 & C2, but not Mg-rich. C1 - C3 all show no enhancement of s-process elements, while C4 shows enhancement of [Ba/Fe]. C5 is the most Fe-poor star observed so far. The model for this star has been discussed in UN03, but in this paper we modify in the Si-burning region, and show that the same model still can explain the observation well.
4.1. CS22949-037
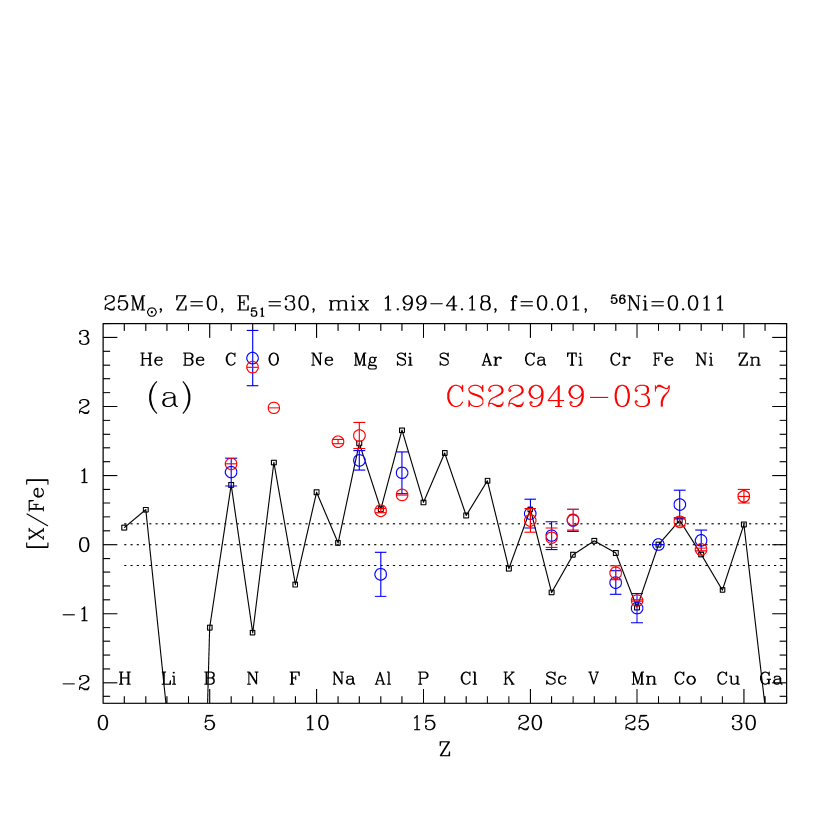
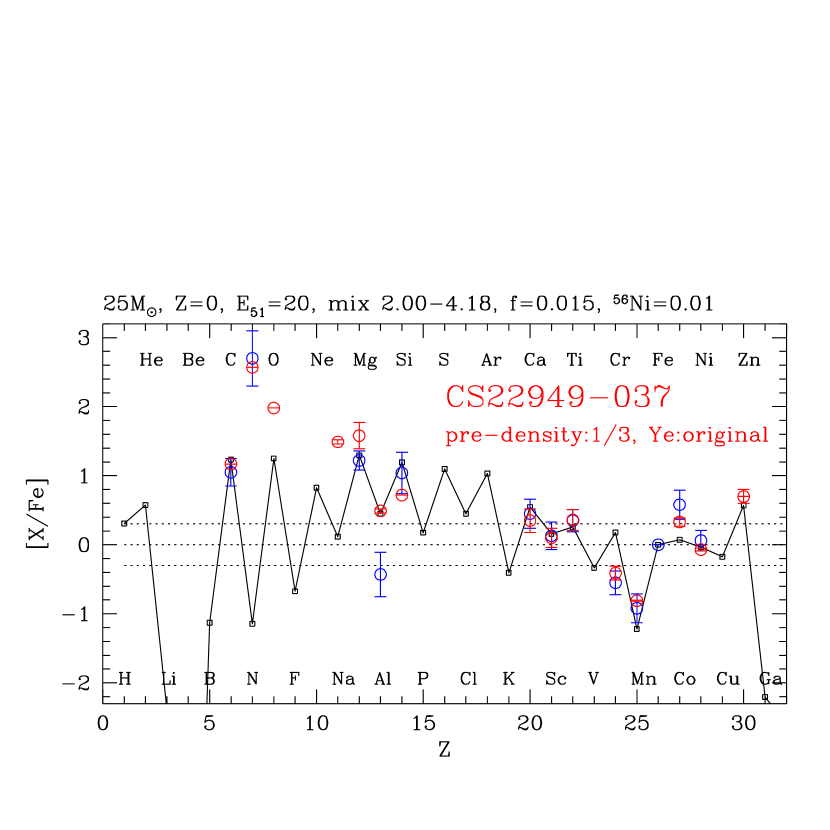
CS22949-037 is one of the most Fe-poor giants known ([Fe/H] ). The detailed abundance pattern of this star was first observed by NRB01, and then by Depagne et al. (2002). Those abundances are shown in Figure 7 by blue circles (NRB01) and by red circles (Depagne et al. 2002). Two results are mostly consistent, but Depagne et al. obtained the abundances of Zn and O, which are very important for constraining the SN models. The Al point in Depagne et al. is larger than NRB01 because we have adopted NLTE corrections ([Al/H]) suggested in their paper. The NLTE correction is also added to the Na point ([Na/H]). For this star, no enhancement of r- and s-process elements is observed (e.g., [Ba/Fe]= 0.6).
This star shows large Co/Fe and Zn/Fe ratios as in typical EMP stars, suggesting the enrichment by a high-energy supernova. For the model In Figure 7(a), therefore, we adopt a high explosion energy model with , , being the same as in Figure 6 (b), but a smaller value of to reduce the ejected Fe mass (see other parameters on top of the figures). For iron-peak elements, (Mn, Co, Ni)/Fe ratios are fit to the observations but (Ca, Ti, Zn)/Fe ratios are smaller. With , the ratios of (C, Mg, Al)/Fe are consistent with the observation but O/Fe is too small. Also the ratio Si/Fe is too large and Mg/Si is too small.
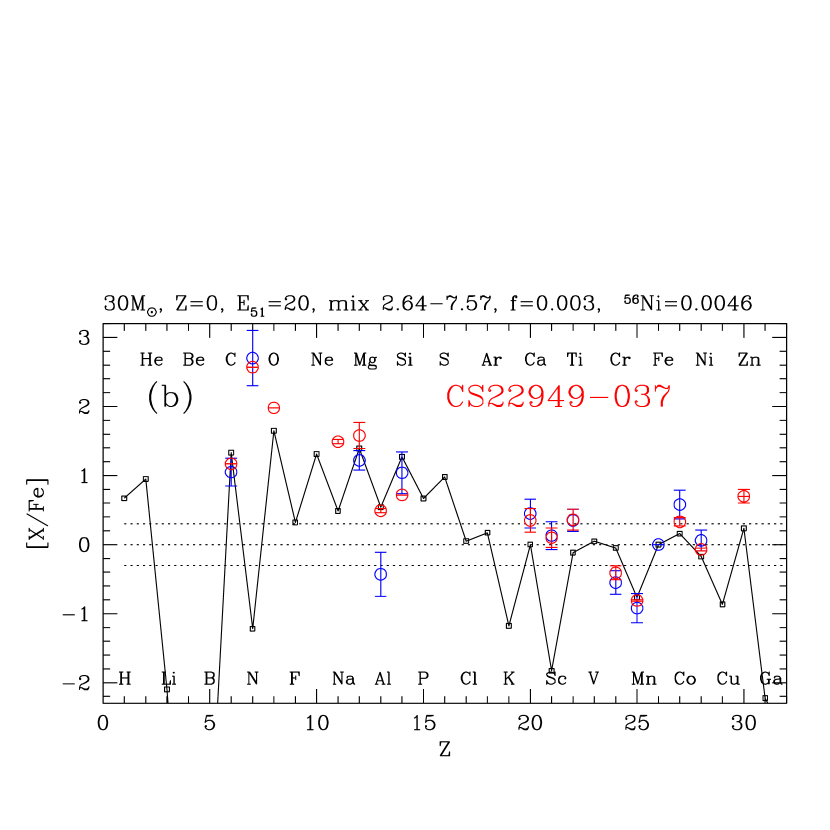
A larger Mg/Si can be resulted from a smaller explosion energy model (Nakamura et al. 2001; Umeda et al. 2002). A larger amount of O is yielded in a more massive progenitor model. In order to test these expectations, we construct a model with , , and . (In this model, as well as the models in the rest of this paper for consistency, is modified to be 0.5001 and 0.4997 in the complete and incomplete Si-burning regions, respectively.)
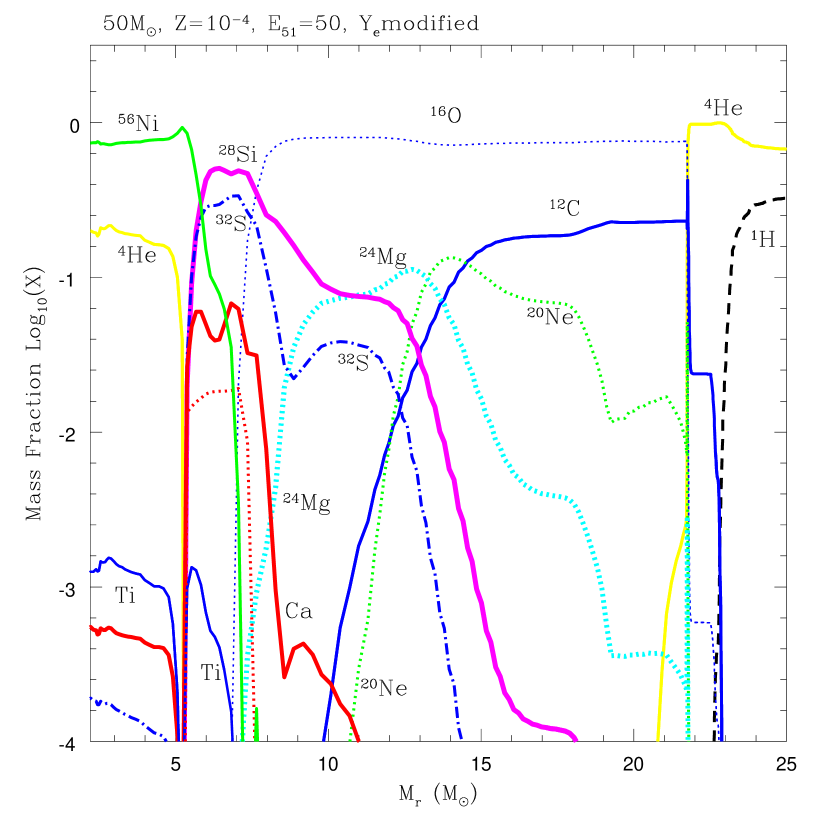
As shown in Figure 7(b), this model indeed yields a larger O/Fe ratio, thus being closer to the observation than the model in Figure 7(a). Also, because of the smaller explosion energy (or smaller energy to mass ratio, ) and larger (out) (= 7.57 ), Mg/Si is as large as observed. If we adopted smaller (out), the amount of Mg mixed into the fallback material would be smaller so that the Mg/Si ratio in the ejecta would be even larger than the observed ratio. (Note that Si is distributed in the deeper layer than Mg as seen in Figure 8). The LTE Al/Fe value is difficult to fit, while the inclusion of the NLTE correction improves the agreement.
In order to obtain an overall improvement in the fit between the model and the observation, further systematic survey of models is needed for wider parameter space. For example, the underabundance of Ti/Fe and Zn/Fe may be improved in the “low-density” explosion model (Appendix).
The remaining problems to be explained are the N and Na abundances. In many cases N and Na are underproduced in the metal-poor massive SN progenitors than those observed. However, if the surface H is mixed into the He layer by convection or rotational mixing in the progenitor, significant amount of N and Na may be produced (e.g., WW95).
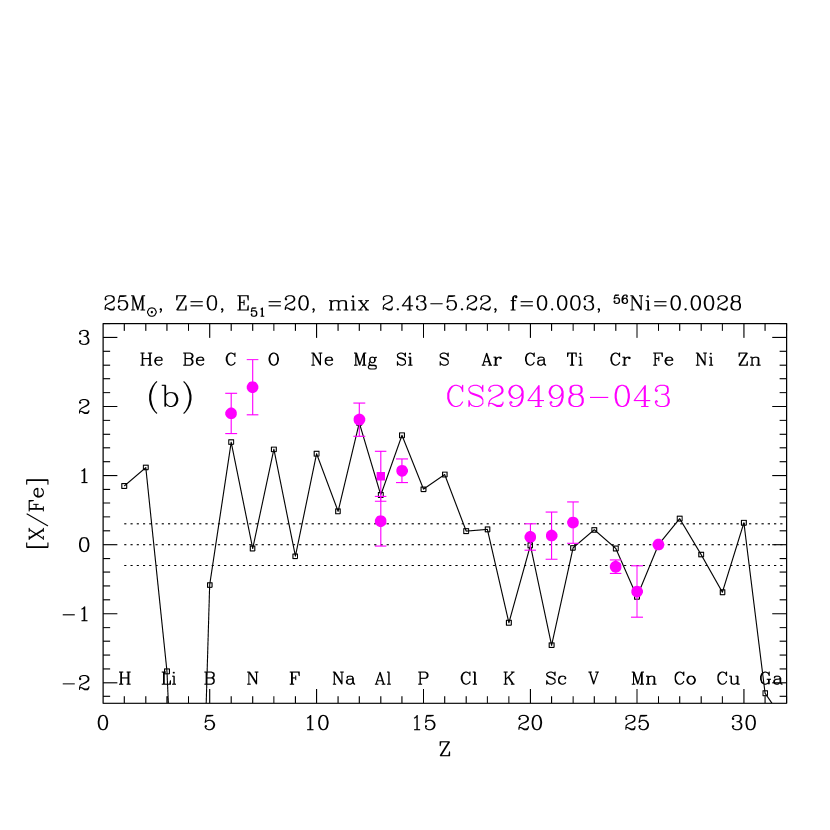
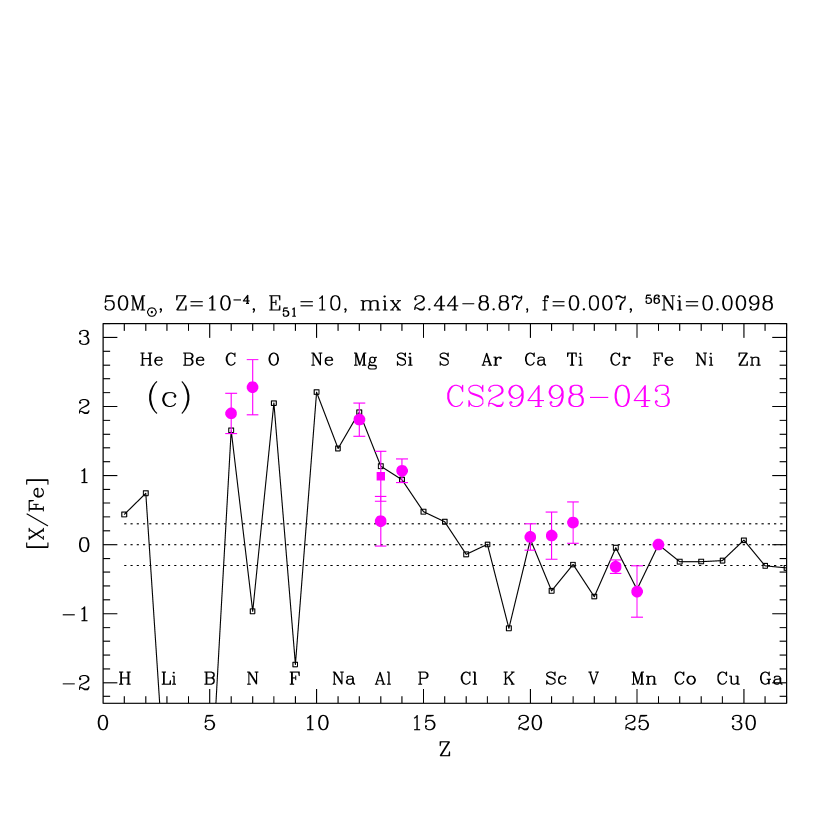
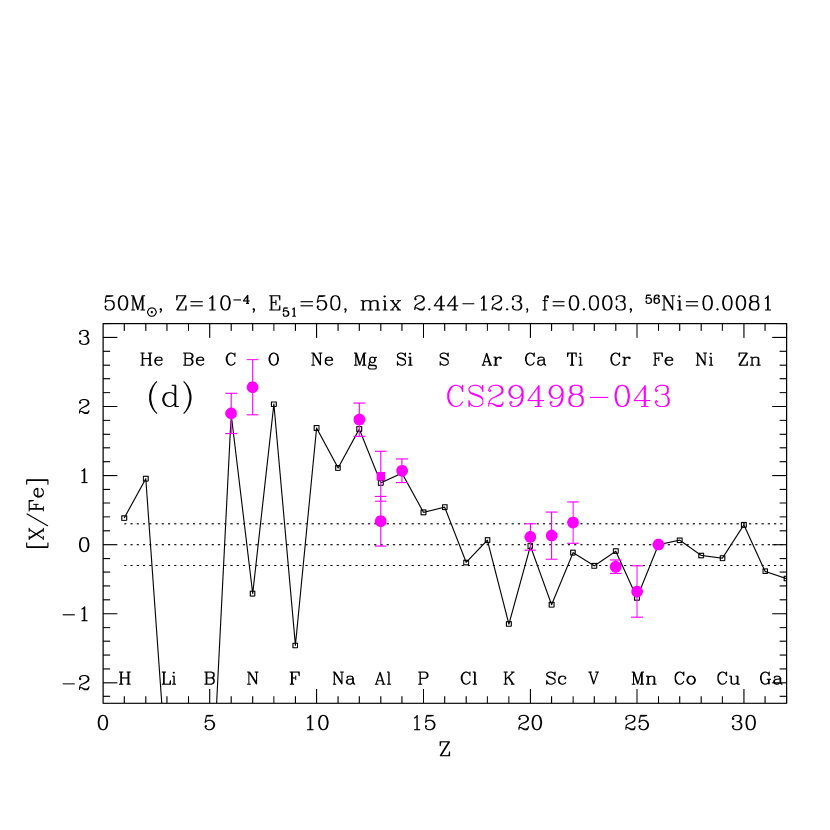
4.2. CS29498-043
This star is also an extremely Fe-poor giant with [Fe/H] = 3.75. Its abundance pattern is similar to CS22949-037, being very rich in C, N, Mg, Al, and Si (Aoki et al. 2002b). Another similarity to CS22949-037 is no enhancement of s-process elements (e.g., [Ba/Fe] = 0.45). However, there are some differences: C, Mg, and Al are more abundant and the Mg/Si ratio is larger in CS29498-043. For CS22949-037 we adopt the high energy model because of the large Zn/Fe and Co/Fe ratios. For CS29498-043, there are no data of these elements, so that we first adopt a normal energy model. We also assume smaller (i.e., larger fallback) for CS29498-043 than CS22949-037 to produce the larger [C/Fe].
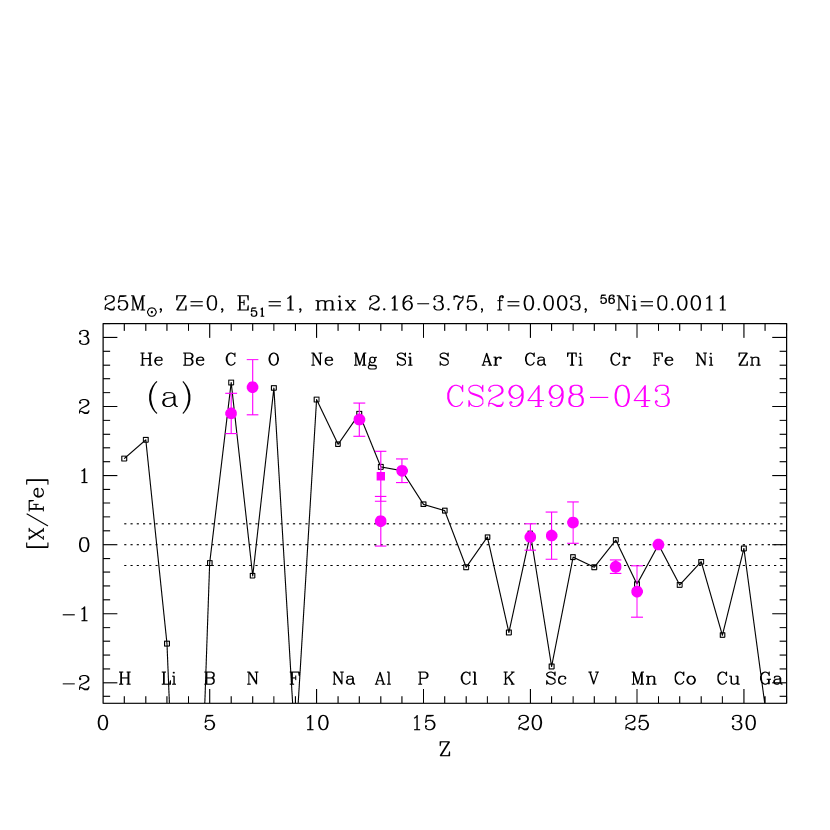
In Figure 9(a) we compare the observed data with the theoretical model of (, 1, 0). This model reproduces the observed abundance ratios for (C, Mg, Si, Ca, Mn)/Fe within the error bars, shows a factor of deviation for (Ti, Cr)/Fe, and significantly underproduces N, Al, and Sc. For the Al/Fe ratio, the possible NLTE correction of [Al/H] shown by the solid square in Figure 9(a) could improve the agreement between the model and observations. Observational data for O, Na, Co, and Zn are highly desired to constrain the model.
Although Co and Zn data are not available, we can still constrain for given as follows: The relatively large Mg/Si ratio may constrain the upper limit of the explosion energy, because the larger explosion energy yields a smaller Mg/Si ratio. As mentioned above, the Mg/Si ratio decreases with increasing (out) since Si is produced in the deeper region than Mg. However, the Mg/Si ratio does not decrease further if (out) increases the Mg-rich region. For example, for the (Z=0, 25) model, the explosion energy is too large as shown in Figure 9(b). In this model, (out) is taken sufficiently large to maximize the Mg/Si ratio, but that is too small compared with the observation.
With our progenitor models (given in UN02), the large [C/Fe] of this star is hard to explain with very massive models () with relatively large C(O rate, such as the CF85 C(O rate, because typically the C/O ratio after He burning is smaller for more massive stars. However as shown in Figure 7(c), we can construct a model with larger [C/Fe] for example by adopting a relatively small, C(O rate, such as the CF88 rate. An example is given in Figure 9(c) and (d). The progenitor model is the same as used in Figure 7(c): the 50 and model with the CF88 C(O rate. Models 9(c) and 9(d) have a relatively small energy, , and a relatively large energy, , respectively. Here the mixing-fallback parameters are properly chosen to fit to the C/Fe, Mg/Fe, Al/Fe and Si/Fe points. As mentioned above, a higher energy model tends to produce larger Si/Mg ratio as well as larger Ti/Fe, Co/Fe and Zn/Fe ratios. The Ti/Fe ratio suggests that the higher energy model might be better. However, we certainly need Co and/or Zn data to constrain the energy. Note that, while is not small for less massive supernovae, this is not so strong explosion if the progenitor mass is as large as 50 in a sense that (velocity square of the ejecta) is not large.
These examples show that it is difficult to constrain and independently, especially if the C(O rate is unknown. On the contrary, we may be able to constrain and independently if the C(O rate, or the C/O ratio after the He-burning is known.
In summary, as far as the currently available data is used, the abundance of CS29498-043 is better explained with nucleosynthesis in moderately energetic SNe with mixing and large amount of fallback. The mixing and fallback are necessary. If the large [C/Fe] is realized by a larger mass cut without the mixing and fallback, the elements from Si to Ca are overproduced. Smaller mass and less energetic models, such as (=0, 20, =1), also show a similar level of fit. In order to estimate the explosion energy, determinations of the Zn/Fe and Co/Fe ratios will be important for this star.
Tsujimoto & Shigeyama (2003) also considered a supernova model with small iron ejection to explain the abundance patterns of CS22949-037 and CS29498-043. The idea seems similar to ours, but they concluded that the abundances of these stars cannot be explained by mixing (and fallback) mechanism. This conclusion, however, is based on the assumption that these stars have the yields of low energy SNe and hence the (Cr, Mn, Co)/Fe ratios are different from normal supernovae. However, the small Ni mass (and thus large fallback mass) does not necessarily mean the small explosion energy if the ejecta mass is larger, because the mass of fallback matter is determined by the balance between the explosion energy and gravity (e.g., Herant & Woosley 1994). In fact, the large abundances of Zn and Co of CS22949-037 cannot be produced in the low energy model. Even for the high energy model, the mixing of (Co, Zn) is necessary to enhance (Co, Zn)/Fe in the ejecta and the fallback is necessary to reduce the ejected Ni mass.
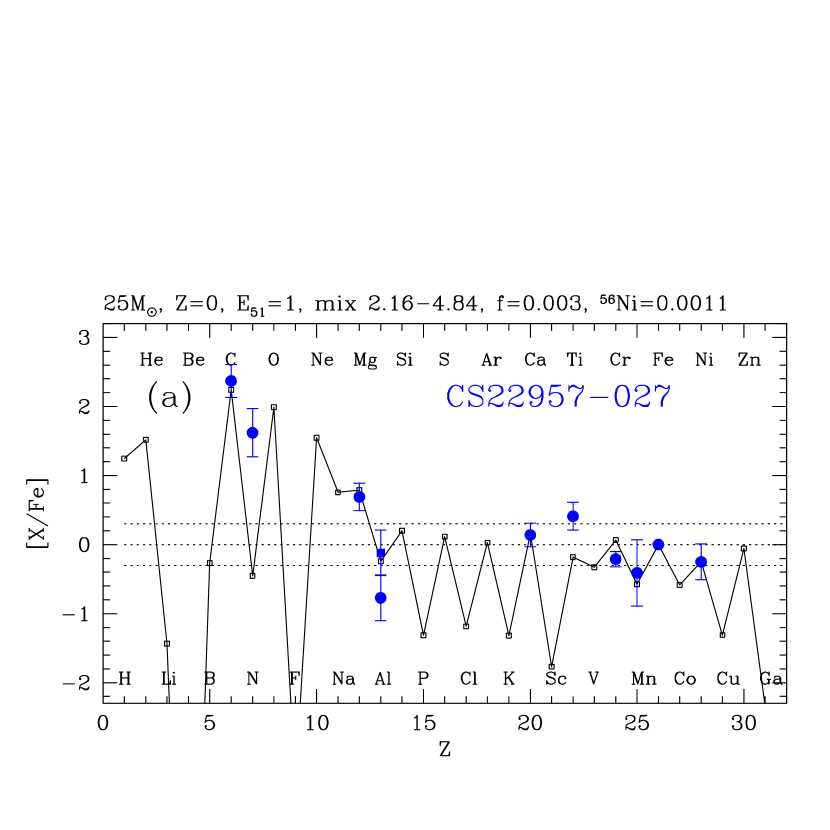
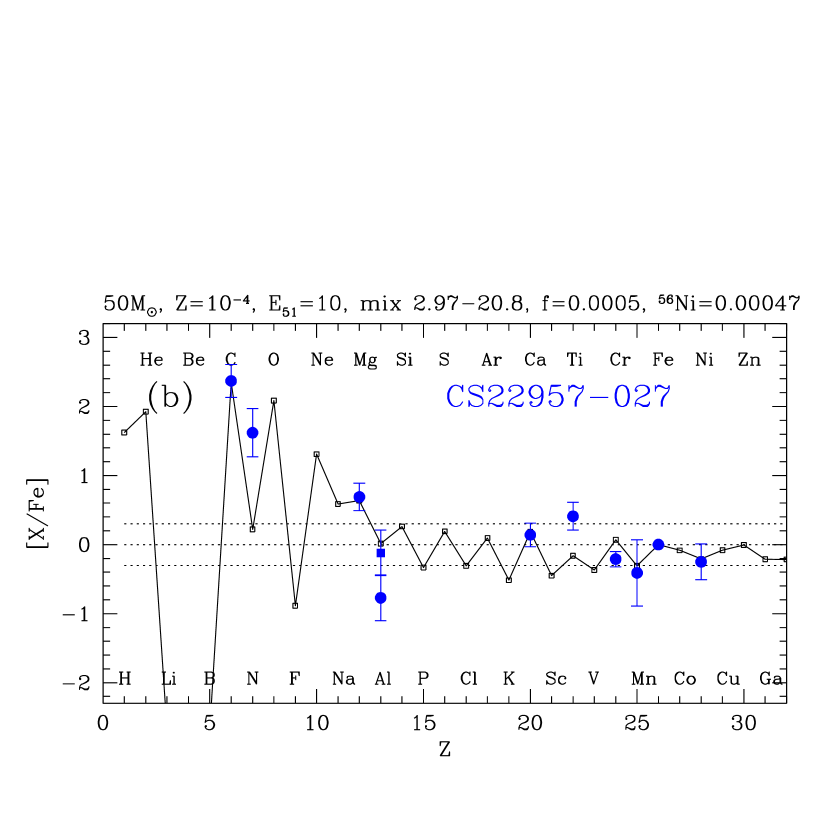
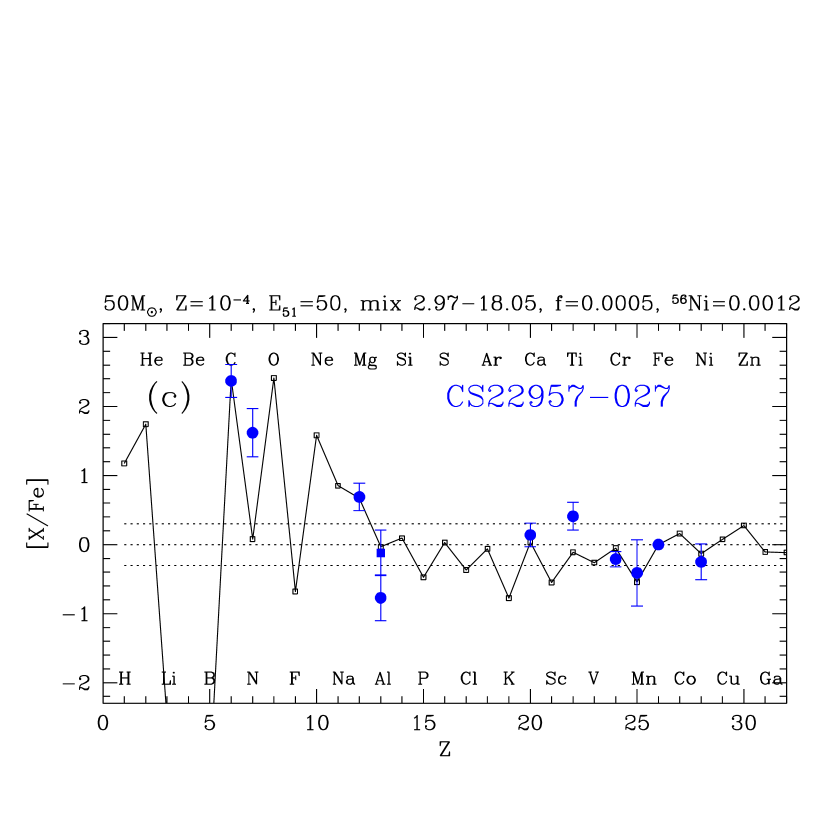
4.3. CS22957-027
This giant star is very C-rich ([C/Fe]=2.39) though the metallicty [Fe/H]= 3.11 is not the smallest (Aoki et al. 2002a). Compared with two stars considered above, the Mg/Fe and Al/Fe ratios are smaller. The s-process elements are not enhanced ([Ba/Fe]=1.23) as in the above two stars.
Without the Zn/Fe or Si/Fe data, it is hard to infer the explosion energy. However, from the relatively large [Mn/Fe], we assume a relatively small explosion energy. The most important character of this star is the large [C/Fe] and the large [C/Mg]. These two large ratios require relatively large scale mixing and a large amount of fallback. We adopt a model with (, , =1) with mixing in the region of to 4.8 and the ejection factor =0.003.
As shown in Figure 10(a), this model reproduces the observed abundance ratios (C, Al, Mg, Ca, Mn, Ni)/Fe within the error bars (being as good as in Figure 9(a)), shows a factor of deviation for (Ti, Cr)/Fe, and significantly underproduces N. Further observational data for O, Na, Si, Co, and Zn are highly desired to constrain the model.
If the explosion energy is increased, the synthesized Mg mass generally increases, which makes the agreement with the observations worse. However, if the progenitor mass is increased as well as the explosion energy, a similarly good fit can be made (e.g. Figure 10(b) and 10(c) for , 50, =10 and models), though a large scale mixing and a quite small ejection factor (=0.0005) is required.
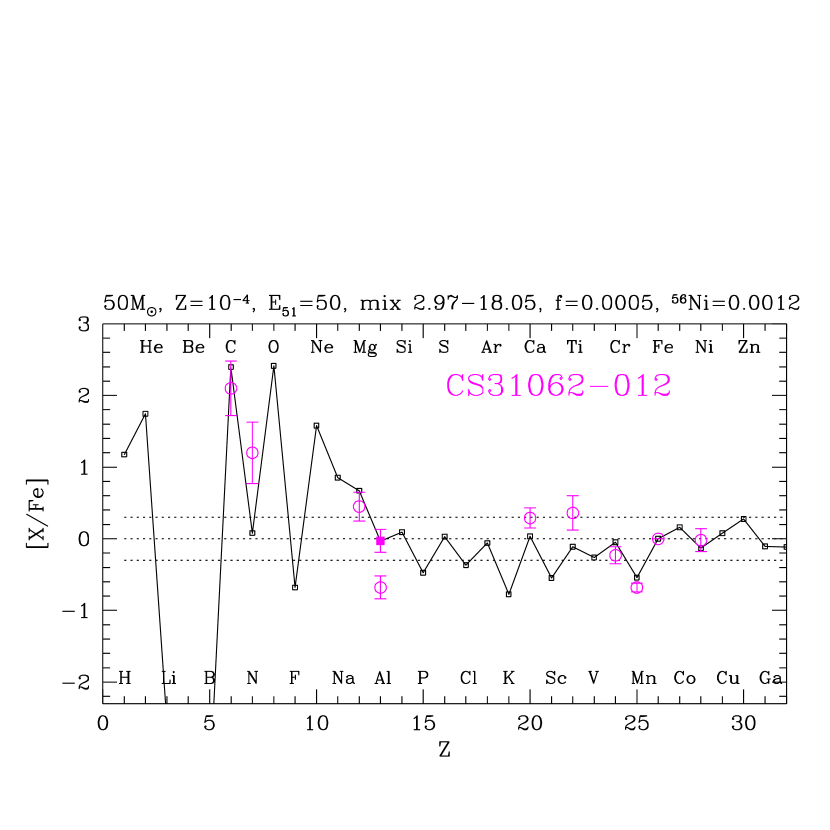
4.4. CS31062-012
There is a subclass of C-rich EMP stars which show some enhancement of the s-process abundances (e.g., Ryan 2002). CS31062-012 is one of such examples (Aoki et al. 2002c), which has [Ba/Fe] = 1.98 being more than two orders of magnitude larger than that of CS22957-027 and CS29498-043. Although Ba is also produced in the r-process, the abundance pattern of other neutron capture elements suggests that this Ba is s-process origin. In Aoki et al. (2002c) the abundance of another star of this type, CS22898-027, is given and its abundance pattern is similar to CS31062-012.
In Figure 11, we compare the observed abundance pattern of CS31062-012 with the same theoretical model as in Figure 10(b). This shows that the same model fits equally-well to both CS22957-027 and CS31062-012 for the abundance ratios of (C, Al, Mg, Ca, Mn, Ni)/Fe.
Then the question arises what makes the difference in the abundance of Ba?
One possible source of the s-process elements is the mass transfer from an AGB companion star. However, as mentioned in Introduction, some of these kinds of stars have no indication of binary companions, although these companion stars once transferred masses might have been departed to the un-observed distances (Ryan 2002). Another possibility is the s-process during the pre-SN evolution. We note that CS31062-012 and other Ba-rich stars are somewhat more metal-rich than Ba-normal stars. For example, [Fe/H] of Ba-rich metal-poor stars, CS31062-012, CS22898-027, LP625-44 and LP706-7 are [Fe/H]= and , respectively. So the question is whether a SN from such a metal-poor as [Fe/H] can have an ejecta with [Ba/Fe] 2.
Observations show that the [Fe/H] stars typically have [Ba/Fe] = (e.g., NRB01). Then in order for the SN ejecta to have [Ba/Fe]2, the enhancement factor of Ba, which is the ratio of initial (pre-stellar evolution) to final (post-SN) Ba masses in the ejecta, has to be larger than . Note that in our model for CS31062-012, the mass of ejected Fe is so small that [Fe/H] of the ejecta mixed with circumstellar matter changes only a little after the SN explosion. We need s-process nucleosynthesis calculations for such metal-poor stars to judge if the enhancement factor of this amount is possible.
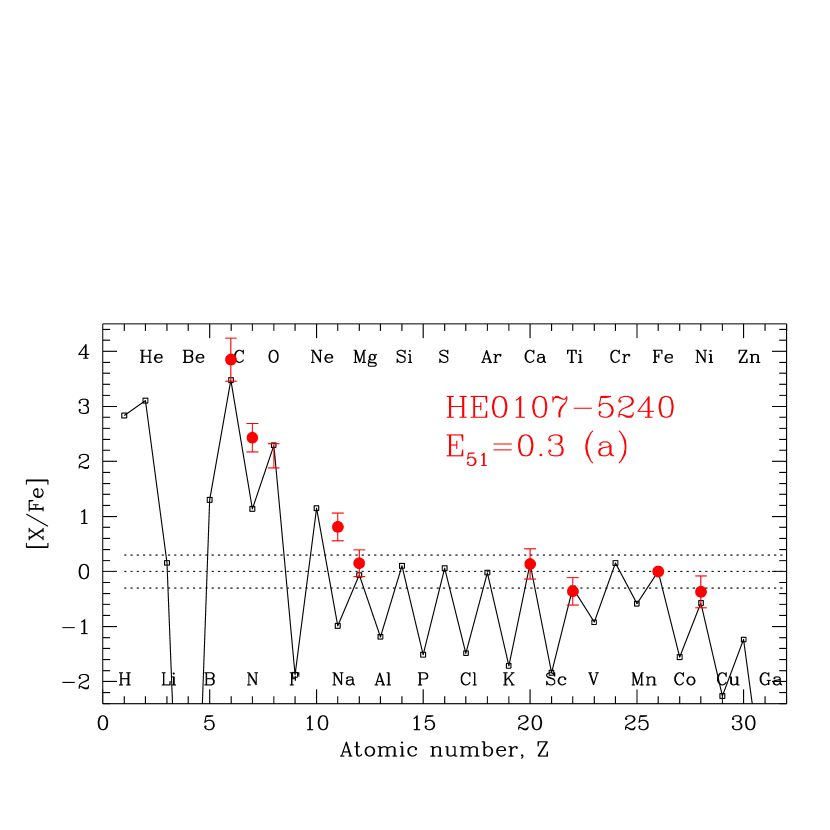
4.5. HE 0107-5240
This star has the lowest [Fe/H] () among the observed EMP stars (Christlieb et al. 2002). Understanding the origin of this star has special importance, because it has been argued that low mass star formation is prohibited below a certain metallicity (e.g., below [Fe/H] ; Schneider et al. 2002) due to inefficient gas cooling.
In UN03 we discussed that this star is the second generation star, whose abundance pattern can be understood by the enrichment of population III core-collapse supernovae as is similar to other EMP stars discussed in this paper. For HE0107-5240, the ejecta is Fe-poor but C-rich (see below), then the low mass star formation can be possible with the C, N, O cooling. More detailed implication about the formation of this star is given in UN03 (also Schneider et al. 2003; Bonifacio et al. 2003; Shigeyama et al 2003; Limongi et al. 2003). Here we briefly explain how the abundance of this star can be explained in our model.
This star has extremely high C/Fe ratio, [C/Fe] , which requires very small Ni ejection, e.g., in the 25 SN model. Contrary to the large C/Fe ratio, the Mg/Fe ratio is almost solar. This requires that the mixing region is extended to the entire He-core, and only tiny fraction of the matter, 0.002%, is ejected from this region. The explosion energy of this SN model is assumed to be relatively low, , which is necessary to reproduce the subsolar ratios of [Ti/Fe] and [Ni/Fe] . Since the large fallback mass does not necessarily require a small explosion energy, and constraints from Ti and Ni on the energy are not as strong as Zn, it is important to measure Zn/Fe to see if it is as small as predicted by the small energy model and to obtain a stronger constraint on the explosion energy. As in other models described in this paper, the abundances of N and Na may be enhanced during the EMP star evolution.
In Figure 12(a) we compare the model with the updated observed abundance pattern (Christlieb et al. 2004). The model is basically the same as adopted in UN03, but the following two points: (1) in the complete and incomplete Si-burning regions are modified to keep the consistency in this paper, and (2) mixing-fallback parameters are slightly changed to reduce the [O/Fe]. The effect of (1) is marginal and the results are essentially identical to the original model: the Co abundance is a little larger with this modification, but other yields are roughly identical to the model in UN03. We try to reduce the [O/Fe] because the newly obtained observed data for [O/Fe] (Bessel, Christlieb, & Gustafsson 2004) seems slightly smaller than the value of the model in UN03. The value in UN03 was [O/Fe]= +2.9, and the value in Bessel et al. (2004) is [O/Fe]= +2.3 for a plane-parallel LTE model atomosphere. They also estimated that systematic errors due to 3D effects may reduce [O/Fe] by 0.3 to 0.4 dex or even more. In Figure 12 (a), we reduce the [O/Fe] value by simply increasing the ejection factor to (it was in UN03). Other parameters are (ini)=1.90 and (out)=6.01. These parameter changes lead also to smaller [C/Fe] but it is within the error-bar given in Christlieb et al. (2004). Now the new values are [C/Fe]=+3.5, [N/Fe]=+1.1, and [O/Fe]= +2.3. These values in UN03 were [C/Fe]=+4.0, [N/Fe]=+1.7, and [O/Fe]=+2.9. If the C/O ratio is larger, it is better reproduced by a slightly higher explosin energy model as shown by the model with in Figure 12(b). For this case, [C/Fe]=+3.6, [N/Fe]=+1.4, and [O/Fe]=+2.1. As described above, cannot be well-constrained without the Co/Fe and Zn/Fe data.
5. Summary and Discussion
We have compared the abundances of EMP stars with nucleosynthesis yields of individual supernovae, and obtained constraints on the model parameters from the comparisons. Previously CL02 showed that theoretical yields (with the “High” C()O rate like ours) and observations do not match well, especially for the (Ti, Cr, Co, Ni)/Fe and (Si, Ca, Al)/Mg ratios. However, CL02 did not consider high energy explosion models and the mixing-fallback process.
By using the “High” C()O rate, however, we can reproduce the observed (Si, Ca, Al)/Mg ratios, probably because of the effects of high-energies and the mixing-fallback in the explosion.
5.1. Zn, Co, Mn and Ni
5.1.1 Production in Hypernova models
The underabudances of Zn and Co in ordinary SN models are significantly improved in the large explosion energy models as shown in UN02. The Co abundance was, however, still lower than the observation. In this paper we point out that the abundance of Co is significantly enhanced for . The abundance of Mn is also sensitive to and in our model gives a relatively good fit to the observations. Since Mn is mostly produced in the incomplete Si-burning region and Co is produced in the complete Si-burning, best fit to the observations may be with the inversion of in the Si-burning region. This may sound unrealistic, but the most recent simulations of core-collapse SNe indeed predict such inversion of by the effect of neutrino processes (e.g., Liebendörfer et al. 2003; Janka, Buras, & Rampp 2003). We note that Co can be enhanced by the effect but the large energy is still necessary to explain the observed large Co/Fe ratios observed in EMP stars.
CL02 found underproduction of the Ni/Fe ratio in all their models. However, we have not found difficulties in producing large Ni/Fe ratios; Ni is enhanced in relatively deeper with smaller region. In summary, the previous bad fits of these elements to the observations can be significantly improved by considering the high-energy models and the variation of .
5.1.2 Other possibilities for Zn production ?
Hoffman et al. (1996) have proposed another site to produce Zn, which is the neutrino-powered wind just after the shock is launched in the deepest layers of the star. However, the total yield for this model has not been given, so that it is not clear if the proper amount of Zn is ejected without overproducing unwanted elements such as Ni, especially because the Zn production site of this model has very low . In the model of Hoffman et al. (1996), Zn is mostly produced as the neutron-rich isotope Zn, while in our model, the dominant Zn is the decay of a (neutron-proton) symmetric isotope Ge.
The observed features may be in favor of our models. First, relative homogeneity of [Zn/Fe] in EMP stars (e.g., Cayrel et al. 2003) suggest that the production site of Zn and r-process elements are different, because only in few EMP stars, r-process elements are enhanced. Second, it appears that the Zn/Fe enhanced stars are also Co/Fe enhanced. This is easily understood in our models, because Zn and Co are produced almost in the same region in our hypernova model. On the other hand, in the model of Hoffman et al. (1996) the most Zn-rich region is different from the most Co-rich region.
5.2. N, Na, Ti, Cr and Sc
Of course, our supernova yields do not fit to the observations perfectly for all elements. N, Na, Ti, Cr and Sc are the examples for which the discrepancies between theory and observations are relatively large. Among them, the N abundance can be explained rather easily by the CN-cycle and first dredge-up in the EMP star. Also, N and Na may be synthesized either in the supernova progenitors or in low-mass EMP stars, by the mixing of hydrogen into the He shell-burning layer through an extra mixing process (Iwamoto, Umeda, & Nomoto 2003). The underabundance of Sc and Ti may be enhanced in the “low-density model” (see Appendix) or aspherical or jet like explosions (Maeda & Nomoto 2003a; Nagataki 2000). At present we do not have explanations about the overproduction of Cr.
5.3. Why [Fe/H] and abundance of Fe-peak elements are related?
We have shown that the observed trend in the abundance of Fe-peak elements with [Fe/H] can be understood in the supernova induced star formation model, in which [Fe/H] is estimated by equation (2), since the EMP stars enriched by high-energy supernovae tend to have lower [Fe/H]. The [Zn/Fe] and [Co/Fe] increase with increasing , while [Mn/Fe] and [Cr/Fe] decrease with . As a result [Zn/Fe] and [Co/Fe] increase with decreasing [Fe/H], while [Mn/Fe] and [Cr/Fe] decrease. This success supports the idea of the supernova induced star formation model, and the idea that EMP star abundances are mostly determined by a single SN.
5.4. Mixing-fallback and the mass ratios between heavy and light elements
With the mixing-fallback mechanism, the abundance ratios between relatively light and heavy elements, such as Mg/Fe and Al/Fe, can be smaller to fit to the observation. Not only the fallback but the mixing during the explosion is necessary; without mixing complete Si-burning products such as Zn and Co are not ejected, leading too small [Zn/Mg] and [Co/Mg]. The fit to the abundance of typical [Fe/H] stars (NRB01) is significantly improved when the matter below the Si-burning region is mixed and only 10% of the matter ejected from this region. We note that similar effect occurs for the aspherical or jet-like explosion (Maede & Nomoto 2003a,b). In reality it may be the combined effects of mixing, fall-back and asphericity.
5.5. Variations in the C-rich EMP star abundance; degree of Mixing-fallback and explosion energy
We have shown that the abundance patterns of not only the typical EMP stars but also C, N-rich EMP stars can be explained by the core-collapse supernova yields with the different explosion energy and the degree of mixing-fallback. In general, C, N-rich EMP stars can be formed in the ejecta of “faint” supernova that eject little Fe because of the large amount of fallback. Such SNe are not hypothetical, but have been observed (Nomoto et al. 2002 for a review). The prototype is SN1997D, which was modeled as a low energy () explosion of a 25 star (Turatto et al. 1998).
As progenitors of the C-rich EMP stars, some of these “faint” supernovae are likely to have low energies (e.g., HE0107-5240) but some might have high-energies (e.g., CS22949-037). To estimate the explosion energy, the observations of the Co/Fe and Zn/Fe ratios are highly desirable. In the low energy models, Zn/Fe and Co/Fe are always underproduced for any parameter choices we considered. Only in the high-energy models, Zn/Fe and Co/Fe can be large in our models. As shown in the appendix, the Co/Fe ratio may be enhanced in the low-density model, but large explosion energy is still required to explain the observed ratios. We note that models in the set L of CL02 produce large enough [Co/Fe] but [Ni/Fe] is significantly underproduced and [Zn/Fe] is not given. If [Zn/Fe] or [Co/Fe] are not observed, some constraints on the energy can be obtained from the Si/Mg ratio.
There are variety of the abundance pattern in C, Mg, Al, Si and S among the C-rich EMP stars. We have shown that these varieties can be explained with different (out). This is one advantage of the mixing-fallback model compared with other explanations. For example, in the mass transfer model from the companion AGB stars, it is difficult to explain the overabundance of Si. For the mixing-fallback model, what causes the difference of (out)? Since we do not know how “hypernovae” explode and how much asphericity and rotation exist, it is currently not possible to answer this question. However there are some observational suggestions: As shown in Section 2, the abundance of typical EMP stars can be explained by high-energy SNe with relatively small (out). On the other hand, the abundance of HE0107-5240 can be explained by low energy SNe with relatively large (out). These facts suggest that the relative position of (out) decreases with the explosion energy. This is consistent with the intuition that for a smaller explosion energy the velocity of the ejecta is lower, thus leading a larger amount of fallback (larger (out)). However, we do not expect one to one correspondence between the energy and the amount of fallback, because geometry of the explosion and the rotational speed should affect the amount of fall-back.
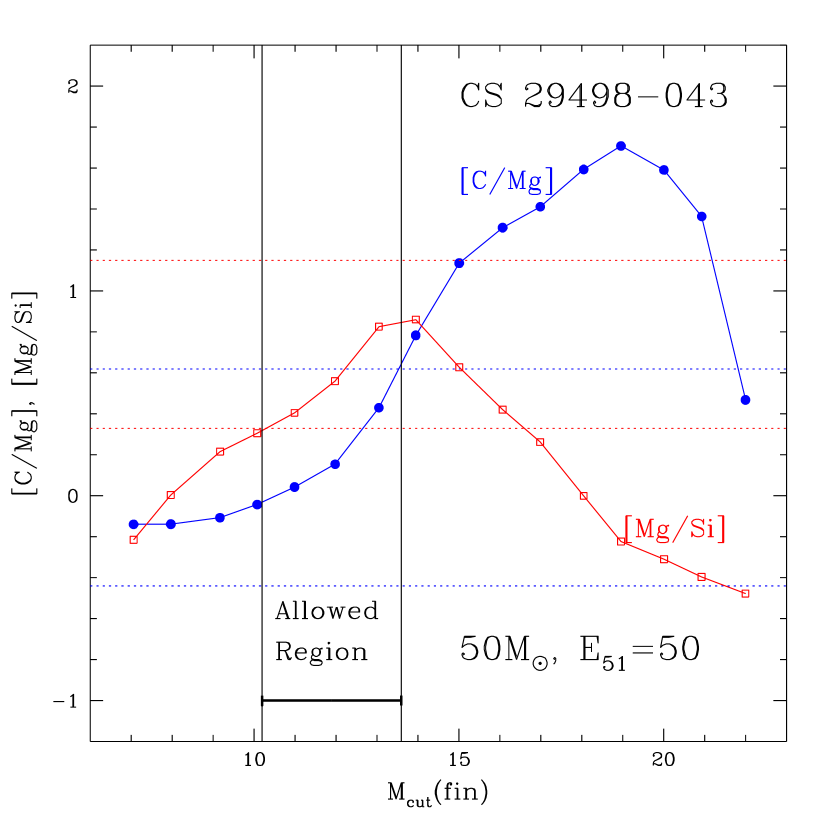
One may wonder how sensitive of our results to the mixing parameters, and (out). In this paper we choose (out) to maximize the Zn/Fe ratio (see Section 3.1 for more detail). Variations of changes the Zn/Fe ratio, but this is not so sensitive to the ratio as long as is located deep inside of the complete Si-burning region. The variation of (out) changes the abundance ratios between various elements. Using the model for CS29498-043 (Figure 9, and its abundance distribution is shown in Figure 13), a 50 and model, we show in Figure 14, how [C/Mg] and [Mg/Si] varies as a function of (out). We also show in this figure that the ranges corresponding to the observed error bars of these abundance ratios (red lines for [Mg/Si] and blue lines for [C/Mg]). The region in which both the observations are satisfied is shown by the region labeled ‘Allowed Region’. For this model, the allowed region of (out) is about and thus we do not need fine tuning of the parameter to satisfy the observation. In most cases also, we do not need fine tuning of (out).
5.6. Ejected mass of Mg and mixing-fallback
We have shown that the observed C-rich EMP stars have various [Mg/Fe], but it can be explained with the mixing-fallback model. In our model the observed large [C/Fe] is realized by the small ejected Fe mass, corresponding to a faint SN. If the mixing-fallback region does not extend beyond the Mg layers, the Mg/Fe ratio is larger for smaller ejected Fe mass. On the other hand, if the mixing-fallback region extends beyond the Mg layer, the Mg/Fe is not necessary large for a little Fe-ejection because Mg ejection mass can be also small.
Shigeyama, Tsujimoto & Yoshii (2003) claimed that the abundance pattern of C-rich EMP stars cannot be explained with the faint SN model, unless [Mg/Fe] is also large. This is because they assumed that the ejected Mg mass is only the function of the main-sequence mass of the SNe (e.g., Shigeyama & Tsujimoto 1998). In other words, they implicitly assume that the mixing-fallback region does not reach the Mg layers. However, the ejected Mg mass is not the only function of . Even for stars with the same mass, the Mg mass can defer depending on the explosion energy, mass-cut and the degree of mixing-fallback. Thus the diversity of [Mg/Fe] can be explained with the mixing-fallback model.
5.7. Degeneracy in the and : Can we constrain ?
If observations provide the Co/Fe or Zn/Fe ratios, we can infer whether the explosion was of relatively high or low energy. However, we can constrain only a set of the explosion energy, , and the progenitor’s mass, , to fit the observations, because more massive and larger energy models give similar abundance ratios. Typically, in a more massive star the C/O ratio after the He-buring is smaller. Since the final yields depends on the C/O ratio (e.g., Weaver & Woosley 1993; Nomoto & Hashimoto 1998; Imbriani et al. 2001), one may be able to constrain the progenitor mass by closely comparing observations with theoretical yields. Unfortunately, the C/O ratio is quite sensitive to the uncertain C()O rate and the treatment of convection, so at this moment we are not able to determine alone. Further detailed modeling of individual and chemical evolution of galaxies, and comparison with the observations are necessary to determine and independently.
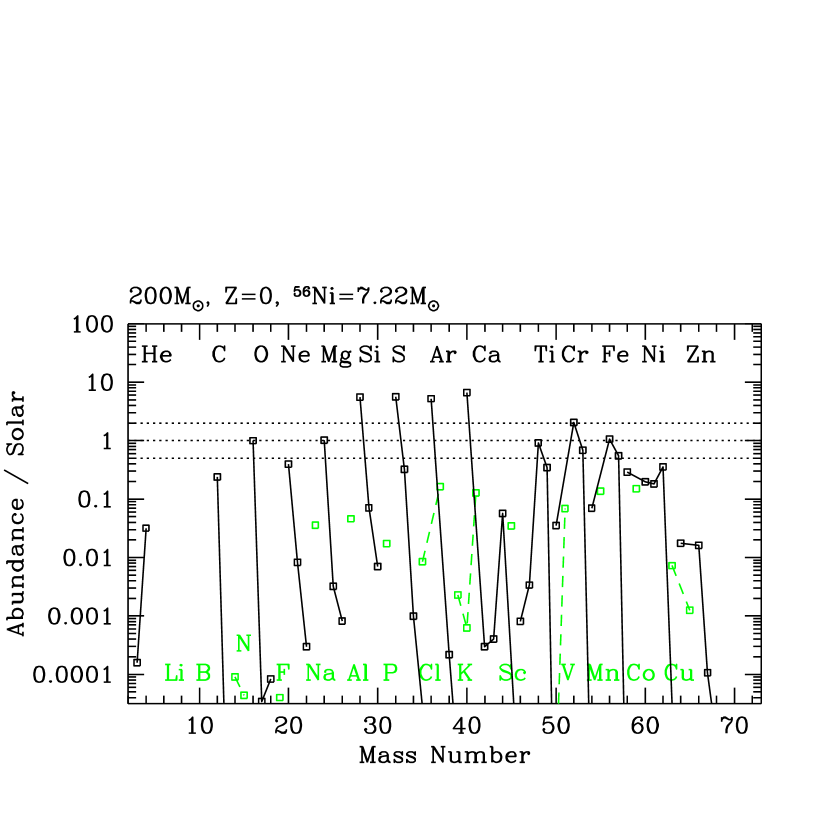
Although and degenerate, we can still set the upper limit to as , because above which the stars become pair-instability supernovae (PISNe) and the yields do not fit to the EMP star abundances (see the next subsection).
5.8. Pair-Instability Supernovae
We have shown that the ejecta of core-collapse supernova explosions of stars can well account for the abundance pattern of EMP stars. In contrast, the observed abundance patterns cannot be explained by the explosions of more massive, stars. These stars undergo PISNe and are disrupted completely (e.g., UN02; Heger & Woosley 2002), which cannot be consistent with the large C/Fe observed in HE0107-5240 and other C-rich EMP stars. The abundance ratios of iron-peak elements ([Zn/Fe] and [Co/Fe] ) in the PISN ejecta (Figure 15; UN02; Heger & Woosley 2002) cannot explain the large Zn/Fe and Co/Fe in the typical EMP stars (McWilliam et al. 1995; Primas et al. 2000; Norris et al. 2001) and CS22949-037. Therefore the supernova progenitors that are responsible for the formation of EMP stars are most likely in the range of , but not more massive than 130 .
Yield tables for some of the models are shown in http://supernova.astron.s.u-tokyo.ac.jp/~umeda/data.html Other yields and related information can be uploaded upon requests.
Appendix: A low density model In this appendix, we present the abundance patterns of the “low-density models”. In this model, the density during explosive burning is lower than the original model, thus enhancing the -rich freeze-out. As a result, Sc/Fe, Ti/Fe, Mg/Fe and also Ca/Fe, Co/Fe, and Zn/Fe ratios are enhanced to be in a better agreement with the observed ratios. Here, we artificially reduce the density of the progenitor model by a factor of three. In this paper, we do not specify how such a low density is realized, but we propose one possibility: Recent studies on SNe have revealed that a certain class of SNe explode very energetically (hypernovae) leaving a black hole behind. Suppose that such a hypernova explosion is induced by the jets perpendicular to the accretion disk around the black hole. If a relatively weak jet expands the interior of the progenitor before a strong jet forms a strong shock to explode the star, major explosive burning takes place in lower density than in the original progenitor. Figures 16(a) shows a low-density model compared with the elemental abundances of typical EMP stars at [Fe/H] used in Figure 6. In this model, the density of the presupernova progenitor is reduced to 1/3 without changing the total stellar mass. of this model is not modified from the original value. Compared with the original density model shown in Figure 16(b), we find that in the low-density model the Sc/Fe ratio is significantly larger, also, Ca, Ti, V, Mn, Co, Ni and Zn to Fe ratios are larger, being in a better agreement with the observational points. Slight deviations in [Mn/Fe] and [Co/Fe] from the observations may be resolved by varying . Then, except [Cr/Fe], all the data shown here can be fitted in this model. In Figure 16(c) we show the abundance pattern when the density for the post-process is artificially reduced to 1/3. In this case, also Sc/Fe, Ti/Fe and Co/Fe ratios are larger than in original models. This example demonstrates that the density during the explosion is important for the abundance ratios of Sc/Fe and Co/Fe and thus a realistic explosion simulation is important for these elements. An important question is, since the Zn/Fe ratio is larger in the low-density model, whether high-energy explosions are required to explain the observed large Zn/Fe (UN02) for the low-density models. As shown in Figure 16(d), the low-density alone is difficult to realize the large [Zn/Fe] even for for the 25 model. This model realizes the large [Co/Fe] but over-produces [Ca/Fe] and [Ni/Fe], thus being much worse agreement with observation than the higher-energy models. Low-density models also give better fits to the C-rich EMP star data, because Ca, Sc, Ti, Co and Zn to Fe ratios are enhanced without changing the abundance of lighter elements. In Figure 17, we show a model with a reduced progenitor density, compared with the CS22949-037 data. This is the low-density version of Figure 7(a), and we find again that Sc/Fe and Ti/Fe are enhanced and Co/Fe and Zn/Fe are close to the observed value even with the original value of .
References
- (1) Aoki, W., Ryan, S. G., Beers, T. C. & Ando, H. 2002a, ApJ, 567, 1166
- (2) Aoki, W., Norris, J. E., Ryan, S. G., Beers, T. C. & Ando, H. 2002b, ApJ, 576, L141
- (3) Aoki, W., Norris, J. E., Ryan, S. G., Beers, T. C. & Ando, H. 2002c, Publ. Astron. Soc. Japan, 54, 933
- (4) Arnett, W.D., Bahcall, J.N., Kirshner, R.P., & Woosley, S.E. 1989, ARAA, 27, 629
- (5) Audouze, J. & Silk, J. 1995, ApJ, 451, L49
- (6) Bessell, M.S., Christlieb, N., & Gustafsson, B. 2004, ApJ, 612, L61
- (7) Bonifacio et al. 2003, Nature, 422, 834
- (8) Caughlan, G., & Fowler, W. 1988, Atomic Data Nucl. Data Tables, 40, 283 (CF88)
- (9) Caughlan, G., Fowler, W., Harris, M. J., & Zimmermann, B. A. 1985, Atomic Data Nucl. Data Tables, 32, 197
- (10) Chieffi, A., & Limongi, M. 2002, ApJ, 577, 281 (CL02)
- (11) Chevalier, R. 1989, ApJ 346, 847
- (12) Christlieb, N., et al. 2002, Nature, 419, 904
- (13) Christlieb, N., Gustafsson, B., Korn, A.J., Barklem, P.S., Beers, T.C., Bessell, M.S., Karlsson, T., & Mizuno-Wiedner, M. 2004, ApJ, 603, 708
- (14) Colgate, S.A. 1971, ApJ 163, 221
- (15) Depagne, E., et al. 2002, A&A, 390, 187
- (16) Ebisuzaki, T., Shigeyama, T., & Nomoto, K. 1989, ApJ, 344, L65
- (17) Hachisu, I., Matsuda, T., Nomoto, K., & Shigeyama, T. 1990, ApJ, 358, L57
- (18) Heger, A., & Woosley, E. 2002, ApJ, 567
- (19) Herant, M., & Woosley, S.E. 1994, ApJ 425, 814
- (20) Hoffman, R. D., Woosley, E., Fuller, G. M., & Meyer, B. S. 1996, ApJ, 460, 478
- (21) Janka, H.-Th., Buras, R., & Rampp, M. 2003, Nucl. Phys. A, 718, 269
- (22) Kifonidis, K., Plewa, T., Janka, H.-Th. & Müller, E. 2000, ApJ, 531, L123
- (23) Liebendörfer, M., Mezzacappa, A., Messer, O. E. B., Martinez-Pinedo, G., Hix, W. R., & Thielemann, F.-K. 2003, Nucl. Phys. A., 719, 144
- (24) Limongi, M. & Chieffi, A. 2003, ApJ, 592, 404
- (25) Limongi, M. et al. 2003, ApJ, 594, 123
- (26) Maeda, K., & Nomoto, K. 2003a, ApJ, 598, 1163
- (27) Maeda, K., & Nomoto, K. 2003b, Prog. Theor. Phys. Suppl., 151, 211
- (28) McWilliam, A., Preston, G. W., Sneden, C., & Searle, L. 1995, AJ, 109, 2757
- (29) Nagataki, S. 2000, ApJS, 127, 141
- (30) Nakamura, T., Umeda, H., Nomoto, K., Thielemann, F.-K., & Burrows, A. 1999, ApJ, 517, 193
- (31) Nakamura, T., Mazzali, P., Nomoto, K., & Iwamoto, K. 2001a, ApJ, 550, 991
- (32) Nakamura, T., Umeda, H., Iwamoto, K., Nomoto, K., Hashimoto, M., Hix, W. R., & Thielemann, F.-K. 2001b, ApJ, 555, 880
- (33) Nomoto, K., et al. 2002, in IAU Symposium 212, A Massive Star Odyssey: from Main Sequence to Supernova, ed. K A. van der Hucht, A. Herrero, & C. Esteban, 395 (astro-ph/0209064)
- (34) Nomoto, K., Maeda, K., Umeda, H., Tominaga, N., Ohkubo, T., Deng, J., & Mazzali, P. A. 2003, in Carnegie Observatories Astrophysics Series, Vol. 4: Origin and Evolution of the Elements, ed. A.McWilliam & M.Rauch (Pasadena: Carnegie Observatories) (http://www.ociw.edu/ociw/symposia/series/symposium4/ proceedings.html)
- (35) Nomoto, K., Maeda, K., Mazzali, P. A., Umeda, H., Deng, J., & Iwamoto, K. 2004, in Stellar Collapse, ed. C. L. Fryer (Dordrecht: Kluwer), 277 (astro-ph/0308136)
- (36) Norris, J. E., Ryan, S. G., & Beers, T. C. 2001, ApJ, 561, 1034 (NRB01)
- (37) Primas, F., Brugamyer, E., Sneden, C., King, J. R., Beers, T. C., Boesgaard, A. M., & Deliyannis, C. P. 2000, in The First Stars, ed. A. Weiss, T. Abel, & V. Hill (Berlin: Springer), 51
- (38) Ryan, S. G. 2002, in CNO in the Universe, ed. C.Charbonnel, D.Schaerer, & G.Meynet (in press) (astro-ph/0211608)
- (39) Ryan, S. G., Norris, J. E., & Beers, T. C. 1996, ApJ, 471, 254
- (40) Schneider, R., Ferrara, A., Natarajan, P. & Omukai, K. 2002, ApJ, 571, 30
- (41) Shigeyama, T. & Tsujimoto, T. 1998, ApJ, 507, L135
- (42) Shigeyama, T. et al. 2003, ApJ, 586, 57
- (43) Spite, M., Depagne, E., Cayrel, R., Hill, V., Francois, P., Spite, F., Nordström, B. et al. 2003, in Carnegie Observatories Astrophysics Series, Vol. 4: Origin and Evolution of the Elements, ed. A.McWilliam & M.Rauch (Pasadena: Carnegie Observatories) (http://www.ociw.edu/ociw/symposia/series/symposium4/ proceedings.html)
- (44) Thielemann, F.-K., Nomoto, K., & Hashimoto, M. 1996, ApJ, 460, 408
- (45) Tsujimoto, T., & Shigeyama, T. 2003, ApJ, 584, L87
- (46) Turatto, M. et al. 1998, ApJ, 498, L122
- (47) Umeda, H., & Nomoto, K. 2002a, ApJ, 565, 385 (UN02)
- (48) Umeda, H., & Nomoto, K. 2002b, in proc. of the 11th Workshop on Nuclear Astrophysics, ed. W.Hillebrandt & E.Müller (Max-Planck-Institut fr̈ Astrophysik), 164 (astro-ph/0205365) (UN02b)
- (49) Umeda, H., Nomoto, K., Tsuru, T.G., & Matsumoto, H. 2002, ApJ, 578, 855
- (50) Umeda, H., & Nomoto, K. 2003, Nature, 422, 871 (UN03)
- (51) Umeda, H., Nomoto, K., & Nakamura, T. 2000, in The First Stars, ed. A. Weiss, T. Abel, & V. Hill (Berlin: Springer), 150 (astro-ph/9912248)
- (52) Woosley, S.E., & Weaver, T.A. 1995, ApJS, 101, 181 (WW95)


| Isotope | A | Isotope | A |
|---|---|---|---|
| n — | 1 | H — | 1-3 |
| He — | 3-4 | Li — | 6-7 |
| Be — | 7-9 | B — | 8-11 |
| C — | 11-13 | N — | 13-15 |
| O — | 14-18 | F — | 17-19 |
| Ne — | 18-22 | Na — | 21-23 |
| Mg — | 22-27 | Al — | 25-29 |
| Si — | 26-32 | P — | 27-34 |
| S — | 30-37 | Cl — | 32-38 |
| Ar— | 34-43 | K — | 36-45 |
| Ca — | 38-48 | Sc — | 40-49 |
| Ti — | 42-51 | V — | 44-53 |
| Cr — | 46-55 | Mn — | 48-57 |
| Fe — | 50-61 | Co — | 51-62 |
| Ni — | 54-66 | Cu — | 56-68 |
| Zn — | 59-71 | Ga — | 61-73 |
| Ge — | 63-75 | As — | 65-76 |
| Se — | 67-78 | Br — | 69-79 |
| model | (M, E) | [Zn/Fe] | [Co/Fe] | [Cr/Fe] | [Mn/Fe] | Mg | log(Mg/E) |
|---|---|---|---|---|---|---|---|
| A | (13, 1) | -0.40 | -0.72 | 0.04 | -1.19 | 0.023 | -1.63 |
| B | (15, 1) | -0.89 | -1.02 | 0.17 | -0.77 | 0.030 | -1.52 |
| C | (20, 1) | -1.66 | -0.62 | -0.22 | -0.89 | 0.020 | -1.70 |
| D | (25, 1) | -0.56 | -1.21 | 0.11 | -0.74 | 0.14 | -0.85 |
| E | (25, 10) | 0.32 | -0.44 | -0.08 | -2.05 | 0.13 | -1.89 |
| F | (25, 20) | 0.42 | -0.08 | -0.13 | -2.03 | 0.15 | -2.12 |
| G | (25, 30) | 0.48 | 0.11 | -0.05 | -1.82 | 0.12 | -2.40 |
| H | (30, 1) | -0.21 | -0.89 | -0.06 | -0.89 | 0.40 | -0.40 |
| I | (30, 10) | 0.05 | -1.17 | -0.02 | -1.15 | 0.41 | -1.39 |
| J | (30, 20) | 0.19 | -0.66 | -0.10 | -1.48 | 0.36 | -1.74 |
| K | (30, 30) | 0.23 | -0.42 | -0.08 | -1.85 | 0.31 | -1.99 |
| L | (30, 50) | 0.34 | -0.17 | -0.16 | -2.28 | 0.26 | -2.28 |
| M | (50, 1) | -0.13 | -1.89 | 0.26 | -1.72 | 0.75 | -0.12 |
| N | (50, 10) | -0.11 | -0.92 | 0.12 | -1.36 | 0.73 | -1.14 |
| O | (50, 30) | 0.17 | -0.46 | -0.01 | -1.54 | 0.79 | -1.58 |
| P | (50, 50) | 0.26 | -0.24 | -0.08 | -1.52 | 0.80 | -1.80 |
| Q | (50, 70) | 0.32 | -0.14 | -0.09 | -1.40 | 0.80 | -1.94 |
| R | (50, 100) | 0.39 | -0.07 | -0.05 | -1.33 | 0.78 | -2.11 |
Note. — These are models. The ejected Mg mass in and log(Mg/E are also shown. Note that in these models, the during the explosion is unmodified. This is because [Mn/Fe] and [Co/Fe] are systematically underproduced compared with the observations. We note in the mixing-fallback model all the quantities shown here are independent of the ejected Fe mass, or the ejection factor, , as far as the outer boundary of the mixing region, (out), is fixed to be at the outer-boundary of the incomplete Si-burning region.
| model | (ini) | ((ini)) | () | |
|---|---|---|---|---|
| A | 1.53 | 1.61 | 0.4996 | 0.4996 |
| B | 1.62 | 1.90 | 0.4995 | 0.4998 |
| D | 2.20 | 2.91 | 0.4998 | 0.5000 |
| F | 2.32 | 4.22 | 0.4998 | 0.4998 |
| G | 2.50 | 4.52 | 0.4998 | 0.4998 |
| M | 2.80 | 3.99 | 0.4999 | 0.5000 |
| N | 2.97 | 5.06 | 0.5000 | 0.5000 |
| O | 2.80 | 7.90 | 0.4999 | 0.4999 |
| P | 3.06 | 8.86 | 0.5000 | 0.4999 |
Note. — (ini) is the mass-cut (or the initial mass-cut in the mixing-fallback model) and is the mass-coordinate of the outer-boundary of explosive incomplete Si-burning region which is defined by X(Ni) .
| model | |||||
|---|---|---|---|---|---|
| A | 7 | 1.50 | 2.9 | 17.4 | 0.4995 |
| 5 | 1.56 | 1.3 | 4.6 | 0.4999 | |
| 4 | 1.63 | 0.46 | 2.1 | 0.5000 | |
| 3.2 | 1.68 | 0.24 | 1.2 | 0.5000 | |
| D | 7 | 2.05 | 4.5 | 27.6 | 0.4996 |
| 5 | 2.49 | 1.5 | 4.3 | 0.4999 | |
| 4 | 2.81 | 0.72 | 1.8 | 0.5000 | |
| 3.2 | 3.13 | 0.45 | 1.2 | 0.5000 | |
| F | 7 | 2.76 | 0.78 | 5.9 | 0.5000 |
| 5 | 3.49 | 0.28 | 1.4 | 0.5000 | |
| 4 | 4.07 | 0.14 | 0.66 | 0.5000 | |
| 3.2 | 4.71 | 0.065 | 0.39 | 0.5000 | |
| G | 7 | 2.96 | 0.58 | 3.5 | 0.5000 |
| 5 | 3.75 | 0.28 | 1.1 | 0.5000 | |
| 4 | 4.41 | 0.096 | 0.48 | 0.5000 | |
| 3.2 | 5.01 | 0.045 | 0.26 | 0.5000 |
Note. — is the peak-temperature during explosion at in the units of (K). and are the pre-supernova and peak-density at in the units of (g cm). is the pre-supernova value of at .
| (M, E) | [Zn/Fe] | [Co/Fe] | [Cr/Fe] | [Mn/Fe] | Mg | log(Mg/E) |
|---|---|---|---|---|---|---|
| (15, 1) | -0.24 | 0.01 | 0.17 | -0.70 | 0.030 | -1.52 |
| (25, 30) | 0.29 | 0.35 | -0.12 | -0.92 | 0.18 | -2.22 |
Note. — The numbers shown here are different from those in Table 2, because in these models the during the explosion is modified: in the complete Si-burning region and in the incomplete Si-burning region. In Figure 5, [Fe/H] is determined by [Fe/H]= log(Mg/) + with due to the reason described in the text. Note that all these numbers are roughly independent of mixing-fallback parameters as far as (out) is not too large.
| Model | C/O | [Co/Fe](for Ni=0.07) | [Co/Fe](for Zn/Fe max) |
|---|---|---|---|
| 13A | .29/.70 | -0.72 | -0.72 |
| 15A | .27/.75 | -3.57 | -1.02 |
| 20A | .22/.78 | -3.53 | -0.62 |
| 25A | .25/.74 | -3.37 | -1.21 |
| 13B | .35/.65 | -0.29 | -0.23 |
| 13C | .46/.52 | -2.80 | -0.80 |
| 15B | .33/.67 | -3.29 | -1.37 |
| 15C | .41/.56 | -2.50 | -0.81 |
| 20C | .37/.60 | -1.11 | -0.45 |
| 20D | .38/.62 | -0.42 | -0.33 |
| 25C | .29/.68 | -1.07 | -0.87 |
Note. — The number in the model name is the initial mass of the progenitor. The models ’A’ are the ones used in UN02 and have relatively low central C/O mass fraction ratios just after the helium burning. These models adopt the C()O rate, 1.4 times the value of Caughlan & Fowler 1988 (CF88). The models B, C, D, which have relatively larger C/O values than the models A, are calucated with the C()O rate 1.3 times the value of CF88 and also assumes faster convective mixing than models A (detail of these models are presented elsewhere). The models B, C and D have initial metallicity Z=0, 0.02 and 0.001, respectively. [Co/Fe] are the usual [Co/Fe] for Z=0 models, but for other metallicity models they are integrated only for the matter in the Si-burning regions. Then we could compare the Co/Fe ratios of the explosively produced matter even though they have different initial metallicities. We show the [Co/Fe] values for two different mass-cuts. One is determined by the ejected mass of Ni= and the other makes the Zn/Fe ratio maximum. The latter mass-cut is usually smaller, giving a larger [Co/Fe]. These models, both “small” and “larger” C/O models, significantly underproduce the large [Co/Fe] values observed in typical EMP stars.
| (M, Z) | CF88 | C/O | Fe | O | CO | He | (Si) | (O) |
|---|---|---|---|---|---|---|---|---|
| (25, 0) | 1.4 | .25/.74 | 1.70 | 2.2 | 5.7 | 7.8 | 0.4997 | 0.4998 |
| (30, 0) | 1.4 | .19/.78 | 1.78 | 2.6 | 9.3 | 10.7 | 0.4998 | 0.4998 |
| (30, ) | 1.0 | .29/.70 | 1.86 | 2.9 | 11.4 | 13.0 | 0.4998 | 0.4999 |
| (50, ) | 1.0 | .16/.79 | 2.21 | 3.6 | 19.3 | 21.8 | 0.4998 | 0.5000 |
Note. — Some data on the progenitor models used for the comparison with individual SN. The numbers shown are the the initial stellar mass, metallicity, the adopted C()O rate, the central C/O mass fraction ratio just after the helium burning, Fe-core mass (defined by ), O-burning shell (defined by X(O) ), C-O core mass (defined by X(He)), He core mass (defined by X(H)), at the O-burning shell, and typical at the convective Si-burning layer, respectively. Here, for the C()O rate, we multiply a constant number shown in the table to the value given in CF88.