A Chandra LETGS observation of V4743 Sagittarius: A Super Soft X-ray Source and a Violently Variable Light Curve
Abstract
V4743 Sgr (Nova Sgr 2002 No. 3) was discovered on 20 September 2002. We obtained a 5 ks ACIS-S spectrum in November 2002 and found that the nova was faint in X-rays. We then obtained a 25 ks CHANDRA LETGS observation on 19 March 2003. By this time, it had evolved into the Super Soft X-ray phase exhibiting a continuous spectrum with deep absorption features. The light curve from the observation showed large amplitude oscillations with a period of 1325 s (22 min) followed by a decline in total count rate after 13 ks of observations. The count rate dropped from cts s-1 to practically zero within ks and stayed low for the rest of the observation ( ks. The spectral hardness ratio changed from maxima to minima in correlation with the oscillations, and then became significantly softer during the decay. Strong H-like and He-like lines of oxygen, nitrogen, and carbon were found in absorption during the bright phase, indicating temperatures between 1–2 MK, but they were shifted in wavelength corresponding to a Doppler velocity of -2400 km s-1. The spectrum obtained after the decline in count rate showed emission lines of C vi, N vi, and N vii suggesting that we were seeing expanding gas ejected during the outburst, probably originating from CNO-cycled material. An XMM-Newton ToO observation, obtained on 4 April 2003 and a later LETGS observation from 18 July 2003 also showed oscillations, but with smaller amplitudes.
Subject headings:
stars: individual (V4743 Sagittarius) — stars: novae, cataclysmic variables — stars: oscillations — stars: white dwarfs — X-rays: binaries — X-rays: individual (V4743 Sagittarius)1. Introduction
Classical Nova explosions (CNe) occur in close binary systems consisting of a main sequence star and a white dwarf (WD). Mass transfer from the main sequence star onto the WD leads to explosive hydrogen burning (a thermonuclear runaway: TNR) in the hydrogen-rich matter accreted onto the surface of the WD if ignition conditions are reached (Starrfield, 1989; Gehrz et al., 1998). CNe likely recur on time scales yr depending upon the efficiency of mass transfer in individual systems. CNe are classified as fast or slow depending on the time to decline by three (visual) magnitudes from maximum, . A very fast nova will have days while a slow nova will have days. Multiwavelength observations of CNe in outburst provide information on the energetics, the amount of mass ejected, and the chemical composition of the ejecta. X-ray observations provide information on the evolution of the underlying WD and the progress of the TNR.
Previous X-ray studies of novae in outburst were carried out by EXOSAT, ROSAT, and most recently ASCA, BeppoSAX, and CHANDRA. ROSAT detected V838 Her, V351 Pup, V1974 Cyg, GQ Mus, and LMC 1995 (Krautter et al., 1996; Krautter, 2002; Orio et al., 2001). The combined (BeppoSAX, ASCA, CHANDRA) X-ray observations of V382 Vel show that it was initially a hard source, evolved to a Super Soft X-ray Source (SSS) and then declined extremely rapidly (factor of 200 in 6 weeks) to an emission line source (Burwitz et al., 2003). In contrast, V1494 Aql was observed to be an emission line source for about six months and then evolved to a SSS. CHANDRA grating observations of this nova in the SSS phase showed a spectrum qualitatively resembling that of the SSS CAL 83 (Paerels et al., 2001). The light curve from this observation exhibited a 2.5 ks periodicity (which was interpreted as pulsation) plus a factor of 6 burst (Drake et al., 2003).
Nova V4743 Sgr was discovered by Haseda (2002) at about m mag on 20 September 2002. West (2002) provided an accurate position of RA(J2000), Dec(J2000). The distance was given by Lyke et al. (2002) as 6.3 kpc based on infrared observations. The H emission line was measured with a full-width half-maximum (FWHM) of 2400 km s-1 (Kato et al., 2002) implying ejection velocities exceeding 1200 km s-1. V4743 was classified as a very fast nova ( days) from the visual light curve. In this Letter, we report on our observation of this nova carried out with the CHANDRA LETGS.
2. The Light Curve
Our LETGS exposure was obtained on 19 March 2003 between 9h30m12s and 17h01m10s UT with a total exposure time of 24.7 ks (OBSID 3775). We extracted the dispersed spectrum and the lightcurves (including removing the background photons) using standard threads from CIAO (version 2.3: http://asc.harvard.edu).
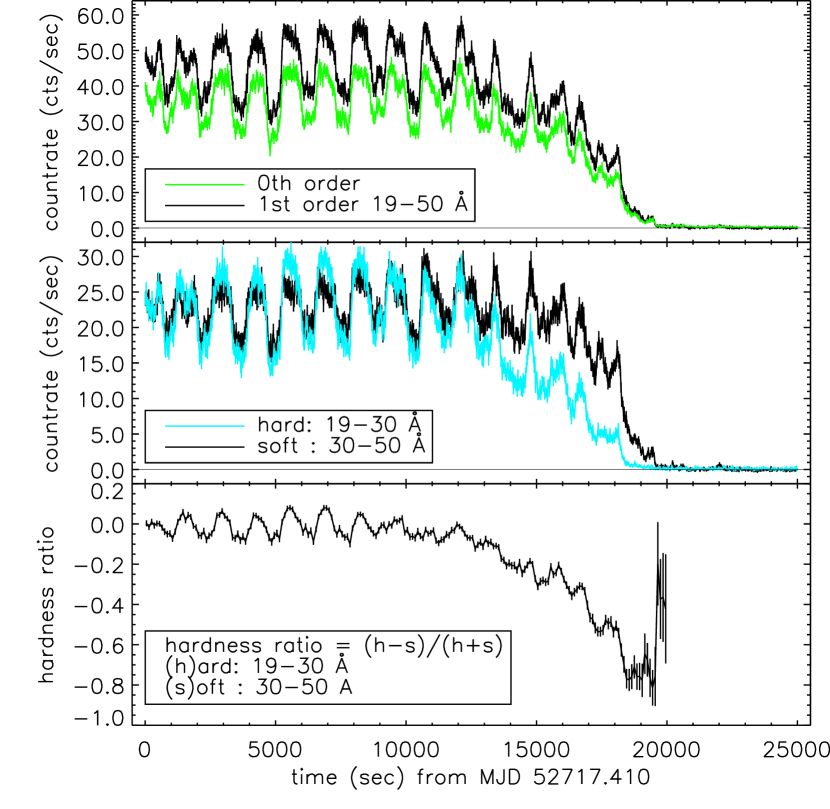
In Figure 1 (the top panel), we present the light curve extracted from both the 0th and 1st orders. The nova is extremely bright and we identify two important features of this light curve. In the first phase of our observation, the count rate shows strong variability with a range from 30-60 cts s-1. About 13 ks into the observation, a slow decline starts and the light curve drops to nearly zero within ks. In the middle panel of Figure 1, we plot the light curve extracted from “soft” (30–50 Å) and “hard” (19–30 Å) energy bands binned in 25s intervals. It can easily be seen that the hard component declines first while the soft component declines later but more rapidly. We also show this in the bottom panel where we plot the time evolution of the spectral hardness ratio defined by (h-s)/(h+s) with “h” the flux in 19 Å Å and “s” the flux in 30 Å Å. The oscillations during the initial phase can clearly be recognized as can the softening during the decay phase. We checked the observation and no known instrument or satellite effect can provide a plausible explanation for the decline. We obtained an XMM ToO observation of this nova on 4 April, 2003 and a second LETGS spectrum on 18 July 2003 (to be discussed elsewhere). The nova was bright and still oscillating in both observations.

From the light curve we obtained a periodogram, plotted in Figure 2. We identify a strong period at 1324 sec (22 min). Two harmonic overtone periods at 668 sec and 448 sec also appear in the periodogram which is to be expected because of the complex nature of the variations.
3. The Spectrum
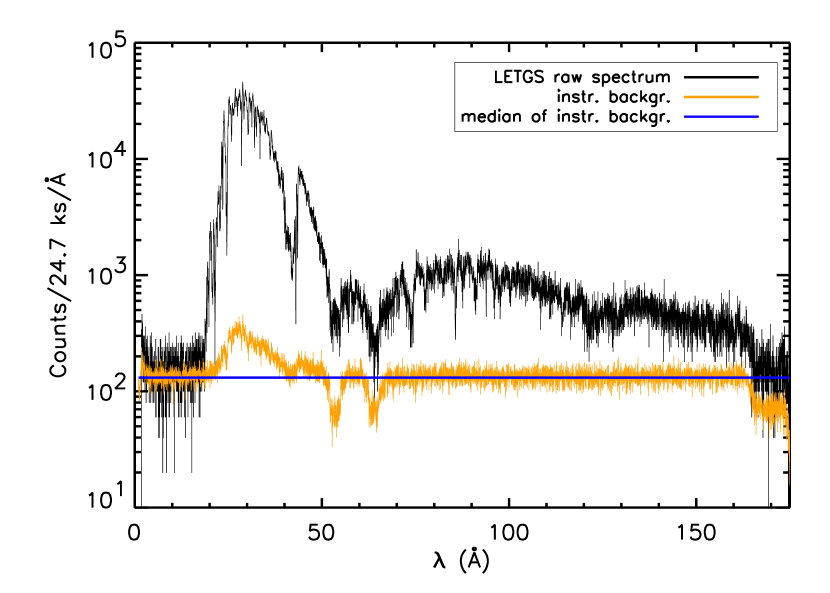
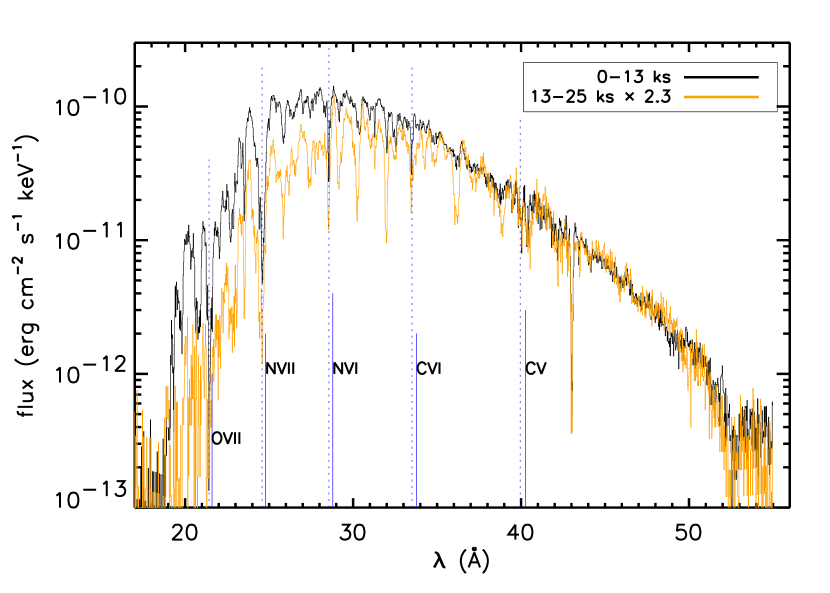
Figure 3 shows the spectrum of V4743 displayed in two panels. The top panel shows the count spectrum obtained from the entire 25 ks of our observation (both dispersion directions co-added). The edge around 40 Å is an instrumental effect from absorption by carbon in the detector coating (“carbon edge”). A second broad peak is visible at around 90 Å, but because the HRC detector cannot disentangle higher order photons by their energy, we modeled the higher orders (from 3–5) and found that this second peak is caused by the overlapping higher orders of the 30 Å peak. Since the background is otherwise flat, the median value for all bins is a fair treatment of the instrumental background (horizontal black line).
We obtained fluxes from the count spectrum, shown in the top panel, by subtracting the median background and converting the count numbers to photon energies using effective areas from Pease et al. (2002). The fluxed spectrum is given in the bottom panel of Figure 3. Because of the obvious structure in the light curve, we display two spectra in this panel. The black line shows the spectrum of the first 13 ks of our observation, before the beginning of the decline. The grey line over plots the spectrum of the decline phase (the remaining 11.5 ks multiplied by a factor of 2.3 for better comparison). The spectrum is clearly softer during the decline phase than in the initial 13 ks.
The spectrum is dominated by continuum emission from what appears to be a stellar atmosphere with a peak 30 Å (0.4 keV). The continuum emission shows strong apparent “absorption” features. We tried to identify these features with strong lines from the most abundant elements seen in nova ejecta such as carbon, nitrogen, and oxygen (Burwitz et al., 2003). However, we could not clearly identify any emission or absorption features associated with the rest wavelengths for these lines (marked with solid vertical lines in the bottom panel of Figure 3). We then applied line shifts, using as a guide the velocity reported by Kato et al. (2002), and found that we could identify the H-like and He-like lines of nitrogen (N vii at 24.78 Å and N vi at 28.78 Å) and carbon (C vi at 33.8 Å and C v at 40.27 Å) as well as O vii at 21.6 Å using a velocity of -2400 km s-1. The blue shifted lines are marked by dotted vertical lines in Figure 3 The presence of these ions implies a temperature of 1-2 MK. The continuum temperature will have to be obtained from stellar atmosphere modeling which is underway. Note that our velocity is double the expansion velocity found by Kato et al. (2002) for the material ejected early in the outburst. We also extracted spectra during just the maximum and minimum phases of the oscillations and found the continuum to be slightly softer at minimum but the equivalent widths of the absorption features are hardly changed.

In Figure 4 we show the spectrum extracted during the last 5.4 ks of our observation, i.e., after the decay. While emission lines from N vii, N vi, and C vi can be identified, there are also weak features that may indicate the presence of O viii (18.97 Å) and O vii (21.6 Å). The strong lines are broadened by km s-1 and probably arise in the ejecta. From the N vii/N vi line flux ratio we infer a temperature of 1.6 0.1 MK using the atomic database APEC. The ratio of N vii/C vi indicates an enhanced nitrogen abundance suggesting that we are seeing CNO-cycled material (Schmitt & Ness, 2002).
4. Discussion
This Letter reports on a CHANDRA LETGS+HRC observation of V4743 Sgr in outburst. We find that the light curve exhibits large amplitude oscillations. However, the nova is only bright in X-rays for the first 15 ks. It then declines to nearly zero over about 90 min and stays faint for the rest of the observation. The behavior of the light curve is puzzling and, at this time, we can only present two questions posed by this observation. The first is are we viewing an eclipse or an actual decline of the X-ray emission? The second is what is the cause of the oscillation: pulsation or rotation? The fact that XMM observed it about 3 weeks later and found it to be bright and oscillating suggests that it was an eclipse. However, the long duration of the decline in count rate is difficult to interpret in the eclipse scenario. If this system has a typical Cataclysmic Variable binary period of a few hours, then the duration of the decline (6 ks) is too long for an ingress into total eclipse of just the WD. There are Cataclysmic Variables with longer periods. GK Per, for example, is an Intermediate Polar with hard X-ray variations (Watson et al., 1985) that resemble those of V4743 Sgr. It has an orbital period of nearly 2 days.
Clearly, it is important to determine the binary period, orbital velocity, and the radius of the cooler component. The long decline time could indicate the eclipse of extended emitting regions but this does not seem consistent with the short oscillation period of 22 min, which implies that the X-ray emitting region is compact. For the eclipse scenario to be plausible, it must explain why the harder fraction of the spectrum begins its decline before the softer fraction of the spectrum. During an eclipse of an accretion disk, for example, we expect the outer, cooler, parts to be occulted first so that the spectrum becomes harder during ingress, contrary to what is observed.
The rapid oscillations found in the X-ray light curve exhibit the strongest period at 22 min. This period could be the rotation period of the WD although the complex appearance of the light curve suggests that there is more than one period present in the data which argues against rotation. Drake et al. (2003) interpreted the oscillations seen in the CHANDRA observation of V1494 Aql as pulsations because there were multiple periods present in the light curve of that CN. Given the uncertainties, in addition, our analysis implies that the WD is slightly hotter when it is brighter which implies pulsation and not rotation because it seems too early in the evolution of the outburst for accretion at the poles to have started. Nevertheless, the large amplitude of the oscillations suggests that it could be rotation if we can determine a source of asymmetric light from the system this early in the outburst. Therefore, determining the cause of the oscillations will require more data both from satellites (X-rays) and the ground. Finally, we mention that the BeppoSAX light curve of V382 Vel, obtained during the SSS phase, was also found to be highly variable (Orio et al., 2002), implying that novae show light variations in the SSS phase. However the cause does not, necessarily, have to be the same.
The shape of the X-ray spectrum of V4743 Sgr is consistent with the interpretation that we are viewing the optically thick atmosphere of a hot WD (see also Paerels et al. 2001). Both the continuum shape and the luminosity (determined from the flux and a distance 6 kpc), imply that we have found this nova in the SSS phase of evolution. SSS emission is believed to originate from the hot, optically thick, atmosphere of a WD with ongoing nuclear burning near the surface (Kahabka & van den Heuvel, 1997). The compact source size implied by the 22 min oscillation is compatible with this view. The WD in V4743 Sgr is still hot and luminous because there is ongoing CNO burning in the accreted layers six months after discovery. We note that although both are considered to be SSS, the spectrum that we show in Figure 3 only qualitatively resembles the X-ray spectrum of CAL 83 obtained by XMM (see Paerels et al. 2001). Interesting features of our spectrum are the widths of the absorption features and the wavelength shifts of the few identifiable lines which suggest a velocity of -2400 km s-1. The blue shift implies an ongoing outflow of material from the WD which may not be consistent with the presence of the oscillations if they are caused by pulsation. In addition, the spectra extracted from the maxima of the oscillations are slightly harder than those extracted from the minima. However, the equivalent widths of the absorption features are little changed. While these lines should be formed close to the surface of the hot WD and change during the oscillations, we cannot tell where they are formed until we have done a stellar atmosphere analysis (in progress). Finally, the spectrum extracted from after the decline shows only emission lines, suggesting that we are observing the optically thin ejected gases.
The X-ray light curve and the LETGS spectrum of V4743 Sgr have produced new puzzles which, when understood, will provide important insights into the mechanism of nova explosions. The data presented here are the first part of a CHANDRA observation program that will observe this nova every two months during summer 2003. More detailed analysis is necessary and will be carried out when the observational program is finished. Hopefully, we will see another eclipse, or even the egress phase in one of the future observations. Determination of the orbital period and spatial distribution of the plasma will then be possible.
References
- Burwitz et al. (2003) Burwitz, V., Starrfield, S., et al. 2003, in preparation for A&A
- Drake et al. (2003) Drake, J.J., Wagner, R.M., Starrfield, S., et al. 2003, ApJ, 584, 448
- Gehrz et al. (1998) Gehrz, R.D., Truran, J.W., Williams, R.E., Starrfield, S. 1998, PASP, 110, 3
- Haseda (2002) Haseda, K. 2002, IAU Circ., 7975
- Kahabka & van den Heuvel (1997) Kahabka, P. & van den Heuvel, E. P. J. 1997, ARAA, 35, 69
- Kato et al. (2002) Kato, T., Fujii, M., & Ayani, K. 2002, IAU Circ., 7975
- Krautter et al. (1996) Krautter, J., Ögelmann H., Starrfield S., Wichmann R., Pfeffermann E. 1996, ApJ 456, 788
- Krautter (2002) Krautter, J 2002, in Classical Nova Explosions, ed. M. Hernanz & J. José, AIP Conference Proceedings #637, 345
- Lyke et al. (2002) Lyke, J.E., Kelley, M. S., Gehrz, R. D., & Woodward, C. E. 2002, AAS, 201, #40.03
- Orio et al. (2001) Orio, M., Covington, J., and Ögelmann, H. 2001, A&A, 373, 542
- Orio et al. (2002) Orio, M., Parmar, A. N., Greiner, J., Ögelman, H., Starrfield, S., Trussoni, E. et al. 2002, MNRAS, 333L, 11
- Paerels et al. (2001) Paerels, F., Rasmussen, A.P., et al. 2001, A&A, 365, L308
- Pease et al. (2002) Pease, D., Drake, J.J., et al. 2002, Proc. SPIE, 4851-15
- Schmitt & Ness (2002) Schmitt, J.H.M.M. & Ness, J.-U. 2002, A&A, 388, L13
- Starrfield (1989) Starrfield, S. 1989, in Classical Novae, ed. M. Bode & A. Evans, Wiley, NY, 39
- Watson et al. (1985) Watson, M.G., King, A. R., & Osborne, J. 1985, MNRAS, 212, 917
- West (2002) West, D. 2002, IAU Circ., 7975