A Study of Cyg OB2: Pointing the Way Towards Finding
Our Galaxy’s Super Star Clusters
Abstract
New optical MK classification spectra have been obtained for 14 OB star candidates identified by Comerón et al. (2002) and presumed to be possible members of the Cyg OB2 cluster as recently described by Knödlseder (2000). All 14 candidate OB stars observed are indeed early-type stars, strongly suggesting the remaining 31 candidates by Comerón et al. are also early-type stars. A thorough investigation of the properties of these new candidate members compared to the properties of the Cyg OB2 cluster star have been completed, using traditional as well as newly revised effective temperature scales for O stars. The cooler O-star, effective temperature scale of Martins et al. (2002) gives a very close distance for the cluster (DM = 10.4). However, even using traditional effective temperature scales, Cyg OB2 appears to be slightly closer (DM = 10.8) than previous studies determined (DM = 11.2; Massey & Thompson 1992), when the very young age of the stellar cluster ( 2 x 10⁶ yrs) is taken into account in fitting the late-O and early-B dwarfs to model isochrones. Of the 14 new OB stars observed for this study, as many as half appear to be significantly older than the previously studied optical cluster, making their membership in Cyg OB2 suspect. So, while some of the newly identified OB stars may represent a more extended halo of the Cyg OB2 cluster, the survey of Comerón et al. also picked up a large fraction of non-members. Presently, estimates of the very high mass of this cluster ( and over 100 O stars) first made by Knödlseder (2000) remain higher than this study can support. Despite this, the recognition of Cyg OB2 being a more massive and extensive star cluster than previously realized using 2MASS images, along with the recently recognized candidate super star cluster Westerlund 1 only a few kpc away (Clark & Negueruela 2002), reminds us that we are woefully under-informed about the massive cluster population in our Galaxy. Extrapolations of the locally derived cluster luminosity function indicate 10s to perhaps 100 of these very massive open clusters (, ) should exist within our galaxy. Radio surveys will not detect these massive clusters if they are more than a few million years old. Our best hope for remedying this shortfall is through deep infrared searches and follow up near-infrared spectroscopic observations, as was used by Comeron et al. (2002) to identify candidate members of the Cyg OB2 association.
1 INTRODUCTION
An accurate census of our Galaxy’s massive star content is essential to understanding its evolution and structure (see Russeil 2003). Yet until very recently, few open clusters were known to exist with extinction greater than A. Moving our imaging and spectroscopic studies to the near-infrared, specifically around 1 to 2 m, has begun to uncover significant massive star populations previously unknown or poorly understood. Because of its conspicuous nature, the galactic center region was among the first to be deeply studied in the near-infrared. These studies identified at least three spectacular and very massive clusters (Morris & Serabyn 1996; Figer et al. 1999; Eckart, Ott & Genzel 1999) with unique stellar and cluster properties. Arguments about the unusual nature of the galactic center environment have been used to explain the galactic center cluster characteristics (Morris & Serabyn 1996), but how unique are the galactic center clusters to other massive clusters lurking through out our galaxy? Might similar very massive clusters lie in other regions of our galaxy?
The recently completed 2MASS survey (Skrutskie et al. 1997) represents a critical first step in uncovering massive open clusters in our galaxy. Not only are numerous new clusters being found through near-infrared surveys (Dutra & Bica 2000; 2001; Ivanov et al. 2002), but even well known clusters are being found to be more extensive and massive than previously thought. Such is the case for Cygnus OB2, a massive star cluster less than 2 kpc away. Originally discovered and labeled IV Cygni by Munch & Morgan (1953), Cyg OB2 has been the focus of numerous optical studies, dating back nearly 50 years (Johnson & Morgan 1954; Morgan et al. 1954; Schulte 1956, 1958). The most thorough investigation of Cyg OB2 was completed by Massey & Thompson (1991, hereafter MT91), identifying 120 possible massive star members based on UBV photometry, and giving optical spectral classifications for just over 70 OB stars in the field. Recently, Knödlseder (2000), using 2MASS infrared observations, has reevaluated the stellar content of Cyg OB2, arguing for a more massive and extensive cluster than previously recognized. Knödlseder (2000) proposed Cyg OB2 to be the most massive stellar association known in our Galaxy, and referred to it as a “super star cluster”, containing over 100 O stars (Knödlseder et al. 2002).
The Knödlseder (2000) study of Cyg OB2 was completed using near-infrared imaging photometry alone. Though far more time consuming, and not possible for very heavily reddened sight-lines, optical spectroscopic studies, such as that completed by MT91 on Cyg OB2, give us the needed information to confidently characterize a cluster’s mass, age, initial mass function (IMF), and to accurately study the individual members. As a follow up to the Knödlseder (2000) study, Comerón et al. (2002, here after CPR2002) presented a low resolution - and -band spectroscopic survey of 2MASS identified sources towards Cyg OB2. While these spectra were not of the quality required for near-infrared spectral classification (see Hanson, Howarth and Conti 1997), they were sufficient to quickly confirm which stars already showing “blue” near-infrared colors lacked discernible molecular bands, consistent with them being early-type stars. They identified 77 early-type candidates. Less than half, just 31 stars, had been previously classified with optical spectra to have been OB stars, leaving 46 new candidate OB stars towards Cyg OB2.
In this study, we have obtained classification-quality blue spectra for 14 of the 46 OB star candidates identified by CPR2002 to determine their MK classifications. A 15th star from the CPR2003 list was observed, but it turned out to have been previously studied spectroscopically. The primary goal of this study is to determine if the OB candidates identified using 2MASS colors and low-resolution near-infrared survey spectra are indeed OB stars. In this way, the observations presented here serve as a useful test of this newly explored, but clearly important, near-infrared method of identifying OB star populations through out our galaxy and behind large line-of-sight extinction. Observations are presented in §2, and the new spectra are presented in §3.
A second goal of this paper, which is more difficult than its first, is to determine if the newly found OB stars are associated with the optically studied Cyg OB2 cluster of MT91. This will require a thorough evaluation of the cluster’s characteristics to determine the likelihood of membership for any newly found OB stars in the region. A review of the Cyg OB2 cluster characteristics and the characteristics of the newly found OB stars is given in §4. A final discussion of the search for possible super star clusters within our Galaxy is presented in §5. Concluding remarks are found in §6.
2 OBSERVATIONS AND REDUCTIONS
Observations were made the nights of 6, 7, 8 July, 2002 on the University of Arizona’s 2.3m Bok Telescope, located on Kitt Peak, outside of Tucson, AZ. The Boller and Chivens (B&C) spectrograph was employed and operated with an 832 g/mm grating and a Schott 8612 order separating filter. A full-width, half-maximum resolution of FWHM 2.0 Å (about 2.8 pixels) was achieved for a resolution of R 2200 over the spectral range from 3960 to 4800 Å.
The B&C spectrograph uses a long slit (4′). All observations were made using a slit width of 2.5′′. An average bias as well as sky emission lines were removed by subtracting a median averaged image of several unique slit positions. Pixel-to-pixel gain variations on the CCD detector were removed using observations of an illuminated reflective spot inside the dome. Observations of a Helium-Argon lamp taken periodically through the night provided the wavelength calibrations. Integration times ranged from 16 minutes (Cyg OB2 A46) to as long as an hour (Cyg OB2 A20). The signal-to-noise ratio in the line free continuum exceeds 50 for nearly all spectra. A few spectra drop just below this value at the shortest wavelengths where the CCD response is waning.
| Star | (2000) | (2000) | mB | Exp Time | S/N | SpType |
|---|---|---|---|---|---|---|
| A20 | 20 33 02.9 | 40 47 25 | 14.5 | 60 min. | 50 | O8 II((f)) |
| A23 | 20 30 39.7 | 41 08 48 | 14.0 | 24 min. | 80 | B0.7 Ib |
| A27 | 20 34 44.7 | 40 51 46 | 13.0 | 24 min. | 100 | B0 Ia |
| A29 | 20 34 56.0 | 40 38 18 | 14.0 | 24 min. | 80 | O9.7 Iab |
| A32 | 20 32 30.3 | 40 34 33 | 14.0 | 44 min. | 60 | O9.5 IV |
| A34 | 20 31 36.9 | 42 01 21 | 13.0 | 24 min. | 100 | B0.7 Ib |
| A36 | 20 34 58.7 | 41 36 17 | 13.0 | 30 min. | 80 | B0 Ib(n) sb2? |
| A37 | 20 36 04.5 | 40 56 13 | 14.5 | 30 min. | 50 | O5 V((f)) |
| A39 | 20 32 27.3 | 40 55 18 | 14.0 | 30 min. | 60 | B2 V |
| A41 | 20 31 08.3 | 42 02 42 | 13.0 | 30 min. | 100 | O9.7 II |
| A42 | 20 29 57.0 | 41 09 53 | 14.5 | 50 min. | 60 | B0 V |
| A43 | 20 32 38.5 | 41 25 13 | 12.03 | 24 min. | 100 | O8 V(n)aaSpType from Hutchings (1981) B0; Massey & Thompson (1991, MT91) O7.5 V. |
| A44 | 20 31 46.0 | 40 43 24 | 13.5 | 30 min. | 60 | B0.5 IV |
| A45 | 20 29 46.6 | 41 05 08 | 13.0 | 30 min. | 80 | B0.5 V(n) sb2? |
| A46 | 20 31 00.1 | 40 49 49 | 12.0 | 16 min. | 80 | O7 V((f)) |
2.1 Target Selection
A list of the stars observed and their positions is given in Table 1. Stars were selected from the list of candidate early-type members given in CPR2002. Interstellar extinction towards this sample is exceedingly high in the blue-optical, ranging from AB = 6 to more than 10 magnitudes. Estimated magnitudes were calculated from Table 1 in CPR2002, assuming a standard extinction law (Rieke & Lebofsky 1985). Observations were made of all candidate early-type stars with estimated B magnitudes brighter than . No stars were observed from the list of Br emission stars in CPR2002 (their Table 2).
Optical spectra of the quality presented here were not previously available for any of the target stars with the exception of one star, Cyg OB2 A43. This star was among the first OB stars found in Cyg OB2 based on photometric colors and was identified by Schulte as star 16 (Schulte 1956). Hutchings (1981) and MT91 obtained spectroscopic measures of Cyg OB2 A43, assigning MK spectral types of B0 and O7.5 V, respectively.


3 THE SPECTRA
The new optical spectra are shown in Figures 1 & 2. A very quick examination shows that all stars from the sample show HeI 4471 Å indicating they are early-type stars, as predicted by CPR2002. MK spectral types, determined based on visual comparisons with the CCD spectral atlas of Walborn & Fitzpatrick (1990), are given in Table 1. There is no quantitative method for estimating the uncertainty in spectral types, however, all 15 stars were independently typed by three persons, myself, Phil Massey and Nolan Walborn. There was excellent agreement within a spectral class for all stars (except A39 and A44, which I typed differently). The adopted classifications, independently and consistently given by both Massey and Walborn, are listed in Table 1.
Because of the large line-of-sight extinction, very strong interstellar features are seen in our spectra. The commonly detected diffuse interstellar band (DIB) at 4428 Å is shown to be exceedingly strong in all the spectra. A composite DIB spectrum, which was created from all the Cyg OB2 star spectra after prominent stellar photospheric features where removed, is shown in Figure 3. Using the line lists provided by Jenniskens & Desert (1994), additional DIB features are clearly detected at 4501.80, 4726.59/4727.06 blend, 4761.67/4762.57 blend (one narrow and one quite wide) and 4780.09 Å. Jenniskens & Desert (1994) also list a probable, very broad DIB centered at 4595.0 Å. We may be detecting such a feature, however the line does lie in a region where weak Si III stellar features are plentiful and might not have been adequately removed in the composite spectrum of Fig. 3. Line centers, equivalent width and FWHM measures have been made from fitting the spectrum in Fig. 3. The fit is shown over-plotted in Fig. 3 and the results from the fit are given in Table 2.

| Central | EQWaaEQW: Equivalent width of feature, measured in Angstroms. | FWHMbbFWHM: Full width, half-maximum line depth, measured in Angstroms. |
|---|---|---|
| , Å | Å | Å |
| 4428.2 | 4.8 | 18 |
| 4501.2 | 0.2 | 3.4 |
| 4597.5 | 0.6 | 40 |
| 4726.5 | 0.3 | 4.7 |
| 4762.0 | 0.2 | 4.3 |
| 4762.3 | 1.0 | 35 |
| 4779.4 | 0.07 | 2.8 |
4 THE NEW OB STARS: ARE THEY MEMBERS OF CYG OB2?
Knödlseder (2000) makes a convincing argument, based on 2MASS stellar counts, that a significant fraction of the Cyg OB2 star cluster has been missed in optical surveys. Follow up work by CPR2002 appears to support this interpretation. The amazing success of the CPR2002 study to have identified OB stars in the field would suggest that all 46 candidate OB stars found are indeed OB stars. However, a second equally important goal of this paper is to determine if the OB stars uncovered by CPR2002 are members of the optical OB cluster Cyg OB2 studied by MT91. In this section we will compare the characteristics of the newly identified OB stars with the characteristics of the previously identified OB stars of Cyg OB2 to determine this.
4.1 Location of the new stars
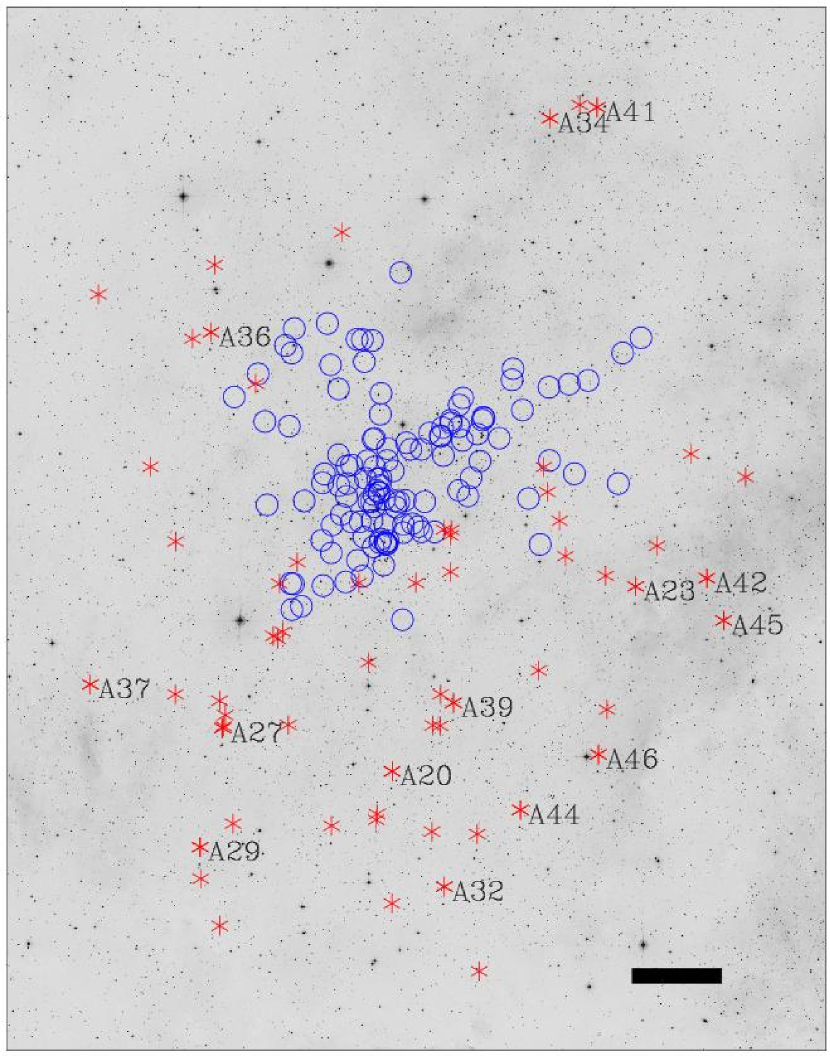
In Figure 4 is shown the CPR2003 survey area, covering a 1.5∘ x 2∘ field of view. The center of the field is aligned with the center of the star distribution seen for Cyg OB2 by Knödelseder (2000) using 2MASS, . The circles correspond to the 120 stars previously identified to be members of the Cyg OB2 cluster by MT91 based on UBV colors. Asterisks in Figure 4 locate a total of 62 new massive star candidates identified by CPR2002. The asterisk sources include 45 candidate early-type members (CPR 2002 A43 is left out since it was previously identified as Schulte 16), 14 stars with Br emission (6 of their 20 Br sources were previously identified), and 3 new sources showing CO in emission.
What is first immediately obvious in this image is that most of the new sources found by CPR2002 lie well away from the previously identified optical cluster stars. Only near the south and west side of the optical field are new candidate OB members seen to lie in close proximity to previously identified cluster members. This study has confirmed 14 new OB stars in the field, all 14 of which are labeled with CPR2002 identifications in Fig 4 (A20, A23, etc.). Of the 14 new OB stars confirmed in this study, all lie a significant distance from the previously identified optical cluster of MT91. The reason most of these OB stars were missed by MT91 was simply because the field over which MT91 searched did not extend to these angular distances.
| Star | SpTy | Teff | Av | mV | MV | V-MV |
|---|---|---|---|---|---|---|
| 059 | O8.5V | 37239 | 5.21 | 11.18 | -4.42 | 10.38 |
| 070 | O9V | 35974 | 6.96 | 12.99 | -4.19 | 10.22 |
| 145 | O9.5V | 34673 | 4.23 | 11.62 | -3.98 | 11.37 |
| 187 | B0.5V | 28183 | 5.40 | 13.24 | -2.69 | 10.53 |
| 215 | B1V | 25409 | 4.03 | 12.97 | -2.15 | 11.10 |
| 227 | O9V | 35974 | 4.73 | 11.47 | -4.19 | 10.93 |
| 250 | B1V | 25409 | 4.08 | 12.88 | -2.15 | 10.96 |
| 258 | O8V | 38459 | 4.49 | 11.10 | -4.74 | 11.35 |
| 259 | B0.5V | 28183 | 3.83 | 11.42 | -2.69 | 10.27 |
| 292 | B1V | 25409 | 5.40 | 13.08 | -2.15 | 9.83 |
| 299 | O8V | 38459 | 4.61 | 10.84 | -4.74 | 10.97 |
| 317 | O8V | 38459 | 4.73 | 10.66 | -4.74 | 10.67 |
| 339 | O8.5V | 37239 | 4.94 | 11.60 | -4.42 | 11.08 |
| 376 | O8V | 38459 | 4.96 | 11.91 | -4.74 | 11.69 |
| 378 | B0V | 31622 | 7.14 | 13.49 | -3.38 | 9.73 |
| 390 | O8V | 38459 | 6.72 | 12.95 | -4.74 | 10.97 |
| 421 | O9.5V | 34673 | 6.83 | 12.86 | -3.98 | 10.00 |
| 429 | B0V | 31622 | 5.64 | 12.98 | -3.38 | 10.71 |
| 455 | O8V | 38459 | 6.38 | 12.92 | -4.74 | 11.27 |
| 467 | B1V | 25409 | 5.04 | 13.43 | -2.15 | 10.55 |
| 470 | O9.5V | 34673 | 5.19 | 12.50 | -3.98 | 11.29 |
| 473 | O8.5V | 37239 | 5.29 | 12.02 | -4.42 | 11.14 |
| 480 | O7.5V | 39810 | 5.82 | 11.88 | -5.06 | 11.12 |
| 485 | O8V | 38459 | 5.58 | 12.06 | -4.74 | 11.21 |
| 507 | O8.5V | 37239 | 5.61 | 12.70 | -4.42 | 11.51 |
| 515 | B1V | 25409 | 6.97 | 14.66 | -2.15 | 9.85 |
| 531 | O8.5V | 37239 | 5.57 | 11.58 | -4.41 | 10.42 |
| 534 | O7.5V | 39810 | 6.54 | 13.00 | -5.06 | 11.51 |
| 555 | O8V | 38459 | 6.57 | 12.51 | -4.74 | 10.68 |
| 588 | B0V | 31622 | 6.02 | 12.40 | -3.38 | 9.76 |
| 605 | B0.5V | 28183 | 4.23 | 11.78 | -2.69 | 10.24 |
| 692 | B0V | 31622 | 5.69 | 13.61 | -3.38 | 11.30 |
| 696 | O9.5V | 34673 | 5.85 | 12.32 | -3.98 | 10.45 |
| 716 | O9V | 35974 | 6.10 | 13.50 | -4.19 | 11.59 |
| 736 | O9V | 35974 | 5.46 | 12.79 | -4.19 | 11.52 |
| Average Vo - Mv = 10.80 | ||||||
4.2 Extinction towards Cyg OB2
From the full sample of 71 Cyg OB2 stars with spectral types published in MT91, a subset of 35 stars, listed in Table 3, was selected to perform specific calibrations of the cluster characteristics. This subset of stars was selected to have optical spectral types between O7.5 and B1 inclusive, all are normal dwarf stars, and all have both UBV values as well as 2MASS JHKS colors. None of the new OB stars presented in this paper were included. Using the intrinsic UBV color terms given by FitzGerald (1970; and recently used by Slesnick, Hillenbrand, & Massey 2002) and JHKS color terms given by Lejenue & Schaerer (2001) for dwarf stars, the extinction characteristics were determined toward each star independently based on the stars observed UBVJHKS colors. This has lead to a well constrained average extinction law towards the cluster as illustrated in Figures 5, 6 and 7. The extinction law created from the fits shown in Figs. 5, 6, and 7 are given in Table 4. The optical extinction law was previously measured by MT91 and Torres-Dodgen et al. (1991). As seen in these previous studies, the extinction was measured to be consistent with a total to selective extinction ratio, , of 3.0. The extinction law through the near-infrared matches that given for the general interstellar medium by Rieke & Lebofsky (1985), except for the K band. The centroid of the 2MASS KS band is at 2.16 m, while Rieke & Lebofsky used Johnson K-band filters centered at 2.22 m. This leads to a slightly larger extinction ratio in the 2MASS KS band () relative to the Rieke & Lebofsky (1985) K band ().
| RL85 | ||
|---|---|---|
| U (0.36 m) | 1.600 | 1.531 |
| B (0.44 m) | 1.333 | 1.324 |
| V (0.55 m) | 1.000 | 1.000 |
| J (1.24 m) | 0.282 | 0.282 |
| H (1.66 m) | 0.175 | 0.175 |
| K (2.16 m) | 0.1251 | 0.1122 |


With a well established extinction law derived for the cluster, AV values for every star with optical spectral types in our full sample of 85 (71 previously identified by MT91, plus the 14 new OB stars confirmed in this study) could be calculated from either UBV, JHKS colors, or both depending on what was available. Extinction values for all stars in this study (inclusive of the 35 dwarf stars also listed in Table 4) are given in Table 5. Of the 85 stars in our complete sample extinction varied from AV = 3.83 up to AV = 10.70 for the infamous B5 supergiant, IV Cyg #12.
It is worth noting that the average extinction towards the 14 CPR2002 OB stars was not significantly greater than that found towards the OB stars previously identified in the optical by MT91 Also, the new OB stars did not show an extinction law any different from that determined for the general Cyg OB2 cluster, beyond a few intrinsically unusual stars listed below. The former indicates that high extinction was not the reason these 14 stars were missed in the optical surveys. However, the remaining 31 stars in the CPR2002 sample of candidate OB stars do have significantly higher extinction than those observed for this study. This may have contributed to their being missed in the optical study of MT91.
4.2.1 Sources with unusual photometric properties
Once the extinction law had been derived for the sight line, it was easy to spot outliers in the numerous color-color diagrams created for the entire sample. Listed below are six sources for which their photometry showed unusual values. With the exception of these six stars, the extinction law towards all the stars in the sample, those found by MT91 and those uncovered by the CRP2002 survey, have essentially identical extinction properties.
MT91 390. This star was identified by Pigulski & Kolaczkowki (1998) as having an irregular variability in the I-band, but otherwise looks fine in our colors. This star was classified as an O8V star by MT91.
MT91 556 Schulte 18. This star was classified as B1Ib by MT91, however it shows some peculiarities in its UBV colors. Schulte 18 had been identified by Pigulski & Kolaczkowki (1998) as having an irregular and rather large variability in the I-band. Unfortunately, the spectrum obtained by MT91 is not shown in their paper.
MT91 575 CPR2003 B13. This star was previously known to be an emission line star from Merrill & Burwell (1950). Its spectral type from MT91 is B1.5V. This star has the largest IR excess in the entire sample, as seen in our (H-KS) vs (J-H) plots. The star is listed in HAe/Be star catalog of The et al. (1994). The spectrum as shown in MT91 looks normal.
MT91 605. This star was previously identified to be an emission line star by Merrill & Burwell (1950). The UBV and JHKS colors for this star appear normal. The spectral type, B0.5V, comes from MT91. The spectrum of this star, as shown in MT91 also appears normal.
MT91 793 CPR2002 B16. This star shows a strong near-infrared excess in its JHKS colors. The spectral type from MT91 is uncertain (B1.5III?). The spectrum shown in MT91 has numerous emission lines, both in hydrogen and from other transitions. It seems likely that this is a Be type star, though it is not mentioned as such in the literature.
CPR2003 A34. This star shows a relatively strong near-infrared excess in the (H-KS) vs (J-H) diagram. From this work, the star has been classified as a B0.7 Ib star.
4.3 Distance to Cyg OB2
The subsample of dwarf late-O and early-B stars given in Table 3 was used to derive the cluster distance. Calculating a star’s distance requires knowing its apparent magnitude, line of sight extinction and its absolute magnitude. The first two measures are well constrained for our sample. The greatest uncertainty in obtaining the distance will be in choosing the absolute magnitude for the dwarf star sample.
There are numerous tables of absolute magnitude as a function of spectral type available in the literature. These show relatively good agreement over the past 3 decades (Walborn 1973; Humphreys & McElroy 1984; Conti 1988; Vacca et al. 1996). Because of the large number of dwarf stars with similar age and distance, the Cyg OB2 data set can be used to test the consistency of the absolute magnitude calibration. First, the distance modulus was determined using the absolute magnitudes of Massey and collaborators, most recently published in Slesnick et al. 2002, based on earlier studies by Conti (1988) for the O stars and Humphreys & McElroy (1984) for the B stars. These values for absolute magnitude are comparable to what has been typically used in the literature, dating back as far as Walborn (1973) and are within a tenth of a magnitude of those quoted in Vacca et al. (1996). Figure 8 shows the distance modulus of each star from the subsample (35 dwarf stars) as a function of spectral type (converted to Teff). The average of all 35 stars yields a distance modulus of 11.16. This is very similar to what was determined in MT91 (DM = 11.20). Some structure is seen in Fig. 8, however. While the O stars (Log T) give a consistent distance, a slight increase is seen in the predicted distance modulus with the cooler stars. If just the O stars are averaged, a slightly lower value of DM = 10.99 is obtained.

The distance to Cyg OB2 was also calculated using the Hipparcos derived absolute magnitudes given by Wegner (2000). The average value for the distance modulus, DM = 10.07, and shown in Fig. 9, is considerably closer than originally given by MT91. Could the distance modulus derived from the Hipparcos values be correct? Comparisons to nearly every other study of absolute magnitude as a function of spectral type in OB stars in the last few decades shows the Wegner values for absolute magnitude to be significantly lower, typically by a full magnitude in mid and late O and early B stars. This strongly suggests that the Hipparcos distances have a strong “near” bias not fully appreciated. Fig. 9 shows a weak but significant dependency of spectral type with average distance, in the same sense as is seen in Fig. 8. Such a dependency would be introduced if the age of the stars used in the calibration is not taken into consideration. Because Cyg OB2 is only a few million years old, the cooler dwarf stars would be found exceedingly close to the ZAMS. Typical late-O and early-B dwarfs used for the calibration of exist in clusters less massive and typically older than Cyg OB2. While these older dwarf stars may have the same spectral type and luminosity class, they represent slightly more massive stars with higher intrinsic luminosities than our near-ZAMS B stars. This effect, also discussed by Walborn (2002), is borne out in the increased DM measured as a function of spectral type in both the Slesnick et al. (2002) absolute magnitudes (Fig. 8) and the Hipparcos values (Fig. 9).

4.3.1 Effective Temperatures of OB stars
Fig. 8 and 9 demonstrate that some consideration of the very young age of the Cyg OB2 cluster needs to be considered in order to properly determine its distance modulus. If Cyg OB2 is to be fit to a very young isochrone, there are just two things that can change in Fig. 8 and 9 to make a better fit. Either the absolute magnitudes are correct and the temperature scales needs to be changed or the other way around. This then introduces a second calibration which is equally important to estimating distance modulus: the stellar effective temperature scale. Knowing a star’s effective temperature is crucial in estimating its absolute luminosity, particularly in theoretical models. Perhaps the most widely used reference to this relationship is given by Vacca et al. (1996) based on calculations using plane parallel, pure hydrogen and helium, non-LTE atmosphere models. However, several independent groups have recently shown that more sophisticated atmospheric models lead to significantly lower effective temperatures in the O-type stars, both in the dwarf stars (Martins et al. 2002; Markova et al. 2003) and the giant and supergiant O supergiants (Bianchi & Garcia 2002; Herrero, Puls & Najarro 2002). The shift in the spectral-type effective-temperature scale is most pronounced in mid-O dwarf stars, and diminishes to near zero offset from the Vacca et al. estimates of effective temperatures for early-B stars. The implications of a new, lower effective temperature scale, as discussed in Bianchi & Garcia (2002), includes a lower luminosity, thus lower mass, when compared to evolutionary tracks. Since the typical goal in studying most OB clusters is to compare the stars to theoretical evolutionary tracks, a lowering of the O star temperature scale will have an immediate effect on results for age, mass and distance to OB clusters.


It is worth noting, the reduced stellar effective temperatures as proposed by recent theoretical arguments appear drastic only when these new values are compared to Vacca et al. (1996). As discussed by Massey & Hunter (1998) and Massey et al. (2000), the Vacca et al. values represented a significant upward trend from previous effective temperature scales (Conti 1973; Humphreys & McElroy 1984; Chlebowski & Garmany 1991). In fact, the Vacca et al. absolute magnitudes, bolometric corrections, and many other calibrations are all highly generous with respect to previous estimates of all these values. Recent studies of young open clusters in the Large Magellanic Cloud (LMC) confirm this. Heydari-Malayeri et al. (2003) showed a marked discrepancy between the high luminosities suggested by Vacca et al. (1996) for their cluster stars over those they derived directly from photometry and a known LMC distance. A comparison of the effective temperature and spectral type calibrations from the previous decade (most notably Humphreys & McElroy 1984) give good agreement, though not entirely coincident, with the dwarf model atmosphere temperatures proposed by Martins et al. (2002).
Our ultimate goal in studying this cluster is to place the stars onto the HR diagram to determine distance, age, and stellar masses. It is reasonable to assume the best fit would be one where the 35 dwarf stars line up along a single isochrone on the HR diagram, provided the stars were predominately co-eval in formation. Using the new spectral type Teff calibration given by Martins et al., we employed the Z = 0.02, 2x mass loss isochrones of LeJeune & Schaerer (2001) to predict total luminosity as a function of temperature for the dwarf stars. An isochrone of 2 million years was chosen, though the cluster clearly shows an age spread of from 1 to 3 million years (see §4.4.1). Using the bolometric corrections of Slesnick et al. (2002), this gave a set of absolute V magnitudes as a function of effective temperature. For the early B-stars, a seamless extrapolation from the Martins et al. values was created based on Teff scales given by Humphreys & McElroy (1984) and Chlewbowski & Garmany (1991). A third plot, showing the distance modulus as a function of Teff using the absolute magnitudes determined in this way is shown in Figure 10. The temperature dependence seen in Figs. 8 and 9 is now entirely gone. Not surprisingly, the average distance, DM = 10.44, is less than previous measures. The reduced stellar temperatures leads to a reduced absolute luminosity for O dwarf stars. Distances predicted using O dwarf stars with such low absolute magnitudes can be tested against other distance measures, such as to the Large Magellanic Cloud. Here, OB stars are routinely observed (Walborn & Blades 1997; Massey, Waterhouse & DeGioia-Eastwood 2000, Heydari-Malayeri et al. 2003) and there are independent checks on distance to derive the absolute magnitudes.
4.3.2 Absolute Magnitudes for ZAMS OB Stars
If the temperature scale for OB stars as given in Figs. 8 and 9 is correct, we can improve the fit of Fig. 8 based on Slesnick et al. (2002) effective temperatures by making small adjustments to the absolute magnitude scale. Again, the Z = 0.02, 2x mass loss isochrones of LeJeune & Schaerer (2001) where used to provide a smooth predicted total luminosity as a function of temperature for the dwarf sample. An isochrone of 2 million years was chosen. Using the bolometric corrections of Slesnick et al. (2002) with the original effective temperature scale of MT91 (also listed in Slesnick, but these are based primarily on Humphreys & McElroy 1984, and Conti 1988), this provides a set of absolute V magnitudes. This final set of spectral type, effective temperature and absolute V magnitude, , used for the dwarf sub-sample is listed in Table 3. The DM value of each star is shown as a function of effective temperature (spectral type) in Fig. 11 and is also given in Table 3. The average distance modulus determined in this way was found to be 10.80. Fig. 11 shows a weak trend not yet seen. The hotter the star, the greater the predicted distance modulus, quite opposite to what was seen in Fig. 8 and 9. One possible explanation is that the cluster is older than 2 million years, and the hotter stars are further from the ZAMS than we’ve estimated. However, its clear based on the presence of the extremely massive O3 If, and other early O supergiants, that the cluster must indeed be quite young. Another explanation is that the assumed effective temperatures of the mid-O stars is too hot, giving them too great a luminosity and thus placing them at a further distance. It will be possible to show in the next section that explanation number one is ruled out. Explanation number two lends a bit of support to the notion that traditional temperature scales for mid-O stars are a bit too high, even after coming down from the generous temperature scale of Vacca et al. (1996).
4.3.3 Final word on the Distance to Cyg OB2
Using the traditional set of absolute magnitudes and stellar effective temperatures for Cyg OB2 yields a distance modulus for the cluster which is consistent with previous studies (MT91, Torres-Dodgen et al. 1991). However, weak but significant dependences of the distance calculated with the stellar spectral type are shown in many of our figures (Figs. 8, 9, and 11 in particular), indicating possible room for improvement. It is of interest to note that any attempt at better fitting the DM values as a function of spectral type ultimately leads to a closer distance for Cyg OB2. It is perhaps premature to boldly accept the much closer distance for Cyg OB2 suggested by Fig. 10 using the Martins et al. (2002) derived values for effective temperature. Beyond the possible inconsistencies with other measures of OB distances as mentioned above, there are significant ramifications to applying a new, closer distance to the Cyg OB2 cluster. Perhaps the most important is a close distance reduces the luminosity of the early O supergiants in Cyg OB2. Among the most important and best studied of the Cyg OB2 supergiants are the O3 If∗ star, IV Cyg # 7 ([MT91] 457), and the O5 If stars, IV Cyg #11, #8A, and #8C ([MT91] 734, 465, and 483, respectively). In a recent paper, one in a series of papers studying the Cyg OB2 supergiant stars, Herrero et al. (2002) assume a distance of 1700 pc (the MT91 DM value of 11.2) for deriving the luminosity of these stars and in modeling their atmospheres and mass loss. Moving the distance to just over 1200 pc (DM=10.44) reduces the intrinsic luminosity of the O supergiant stars by a factor of two! This low a luminosity is simply not consistent with current wind theory because of the difficulty driving the mass loss seen in the Cyg OB2 supergiant stars if their luminosities were reduced a factor of two. However, a DM = 10.80 is not such a problem. The derived luminosities of the before mentioned supergiants, O3 If∗ star, IV Cyg # 7 ([MT91] 457), and the O5 If stars, IV Cyg #11, #8A, and #8C, (MT[91] 734, 465, and 483, respectively) using a DM = 10.80 is given in Table 5. For these stars, we derived = 5.98, 6.06, 6.22, and 5.83, respectively. Herrero et al. (2002), derived = 5.91, 5.92, 6.19, and 5.66 respectively. Moreover, the luminosities calculated by Herrero et al. (2002) for stars [MT91] 632, 217, and 83 of = 5.77, 5.41, and 4.85, are a very good match the values given in Table 5 for these stars: 5.80, 5.83, and 4.64, respectively. For the remainder of this work, a distance modulus of 10.80 will be used for the Cyg OB2 cluster.
4.4 The HR Diagram for Cyg OB2
A new HRD for Cyg OB2 using the distance modulus of 10.80 is shown in Figure 12. Here it can be seen how the location of the dwarf stars are well fit to a 2 million year old isochrone, as given by LeJeune & Schaerer (2001), with a spread in age of between 1 and 3 million years old. The luminosity spread seen in the B1.5 and B2 dwarfs looks to be greater and in the direction of being over-luminous than is seen for the O and earlier B dwarfs. There may be increased contamination from foreground stars at these dwarf star masses which are slightly lower than their hotter dwarfs.

4.4.1 Age of the Cyg OB2 Cluster
As first stated in MT91, a reasonably well-defined main sequence is seen in the HRD of Cyg OB2. However, contamination is present in the form of several evolved giant and supergiant stars (Fig. 12). This indicates contamination from a non-coeval population within the Cyg OB2 sample region. Despite this contamination, we can concentrate on the dwarf stars to estimate the approximate age of the primary constituents of the cluster. The presence the O5 and O5.5 dwarf stars indicates an age not greater than 1 to 1.5 million years old. However, the O5 dwarf (A37) comes from the CPR2002 study and has yet to be confirmed as being part of the main Cyg OB2 cluster. Furthermore, the luminosity of the O5.5 V ([MT91] 516), puts it far from the main sequence (or possibly at a nearer distance), making it also suspect as a reliable age measure for the bulk of the cluster. A well behaved population of dwarf stars is found starting at around O6 and O7 and by O7.5 and O8 there exists a particularly numerous sample of dwarf stars. These mid-O dwarfs put a strong upper limit on the age of the cluster of about 3 million years. An age of 2 million years, with a spread of perhaps one million years, represents a reasonable age for the bulk of the Cyg OB2 cluster based on its most massive dwarf stars. Indeed, a young age of not more than a few million years is needed to explain several very high luminosity blue supergiant stars (such as Cyg OB2 #7, the O3 If) and the possible Wolf-Rayet star members, the positions of which are also shown in Fig. 12. The Wolf-Rayet stars where placed on the HRD in Fig. 12 based on observations of the stars apparent magnitude and line of sight extinction as measured by Schmutz & Vacca (1991) for WR145; Dougherty et al. (2000) for WR146 and Massey et al. (2001) and references therein for WR 144. The temperature of the three WR stars were simply assumed to be 50,000 K. The temperature, apparent magnitude and line of sight extinction of MWC349A was estimated by Hofmann et al. (2002). Citing proximity arguments, Massey et al. (2001) dismissed the Van der Hucht et al. (1981) claim that all three WR stars where members of Cyg OB2. Only WR 144 is near the optically distinct cluster as first studied by MT91. However, if a new extended radius for the Cyg OB2 cluster is to be considered, then WR 145, WR 146 and possibly MWC 349A should be re-considered as possible members.
4.4.2 Mixed-aged Stars towards Cyg OB2
Let’s consider the possibility of non-coeval members appearing in the HRD shown in Fig. 12. Over the temperature range Log Teff = 4.30 to 4.37, four early B stars lie well above the main sequence, A39 (B2 V), 642 (B1 III), 575 (B1.5V), and 793 (B1.5III?) in Fig. 12. Two show near infrared excesses (575, 793), consistent with them being Be stars. A39 is likely foreground. An additional 11 giant and supergiant stars, lying mostly in the temperature range Log Teff = 4.40 to 4.53, are undeniably older than the few million years we’ve assigned to the dwarf stars. Of these eleven older, evolved stars, over half of them originated from the CPR2002 survey (A32, A23, A27, A29, A36, A41). The other five, S03, and MT[91] 632, 601, 642, and 83 where from the original optical survey. The O5 V((f)) star identified by CPR2002 as A37, seems to be two young for the remainder of the Cyg OB2 cluster, indicating an age below 1 million years. Summing things up, 7 of the 14 new stars identified by CPR2002 show ages inconsistent with the remainder of the cluster, and are unlikely members of Cyg OB2. Extending the search for cluster members to larger distances from the central core has lead to an increase in contamination from non-member stars. The IMF values and stellar counts made by MT91 still remain the best estimates for the cluster until the remaining OB candidates identified by CPR2002 are observed. However, it is clear that in an effort to move towards greater completeness of the cluster members, we have also moved towards a greater incidence of contamination. Without reliable measures to establish membership, this will be a chronic problem for all studies attempting deep photometric studies of distant clusters within our galaxy.
| Star | SpTy | Teff | mv | Av | BC | Log |
|---|---|---|---|---|---|---|
| 005 | O6V | 43551.2 | 12.93 | 6.19 | -3.73 | 5.13 |
| 021 | B2? | 19952.6 | 13.74 | 4.41 | -2.00 | 3.29 |
| 059 | O8.5V | 37239.2 | 11.18 | 5.21 | -3.38 | 5.26 |
| 070 | O9V | 35975.0 | 12.99 | 6.96 | -3.31 | 5.20 |
| 083 | B1I | 26302.7 | 10.64 | 4.03 | -2.67 | 4.64 |
| 138 | O8.5I | 34435.0 | 12.26 | 6.73 | -3.25 | 5.36 |
| 145 | O9.5V | 34673.7 | 11.62 | 4.23 | -3.23 | 4.62 |
| 169 | B1.5V | 22387.2 | 13.90 | 4.51 | -2.27 | 3.37 |
| 174 | B1.5V | 22387.2 | 12.55 | 4.46 | -2.27 | 3.89 |
| 187 | B0.5V | 28183.8 | 13.24 | 5.40 | -2.84 | 4.22 |
| 213 | B0Vp | 31622.8 | 11.95 | 4.20 | -3.14 | 4.38 |
| 215 | B1V | 25409.7 | 12.97 | 4.03 | -2.58 | 3.68 |
| 217 | O7III | 39902.5 | 10.22 | 4.42 | -3.59 | 5.41 |
| 227 | O9V | 35975.0 | 11.47 | 4.73 | -3.31 | 4.92 |
| 250 | B1V | 25409.7 | 12.88 | 4.08 | -2.58 | 3.73 |
| 258 | O8V | 38459.2 | 11.10 | 4.49 | -3.43 | 5.04 |
| 259 | B0.5V | 28183.8 | 11.42 | 3.83 | -2.84 | 4.32 |
| 292 | B1V | 25409.7 | 13.08 | 5.40 | -2.58 | 4.18 |
| 299 | O8V | 38459.2 | 10.84 | 4.61 | -3.43 | 5.19 |
| 300 | B1?V | 25409.7 | 13.05 | 4.24 | -2.58 | 3.73 |
| 304 | B5Ie | 13182.6 | 11.46 | 10.79 | -1.83 | 6.38 |
| 317 | O8V | 38459.2 | 10.66 | 4.73 | -3.43 | 5.31 |
| 339 | O8.5V | 37239.2 | 11.60 | 4.94 | -3.38 | 4.99 |
| 358 | B2? | 19952.6 | 14.81 | 6.50 | -2.00 | 3.69 |
| 376 | O8V | 38459.2 | 11.91 | 4.96 | -3.43 | 4.91 |
| 378 | B0V | 31622.8 | 13.49 | 7.14 | -3.14 | 4.94 |
| 390 | O8V | 38459.2 | 12.95 | 6.72 | -3.43 | 5.20 |
| 395 | B1.5V | 22387.2 | 14.14 | 5.94 | -2.27 | 3.85 |
| 403 | B1.5V | 22387.2 | 12.94 | 5.53 | -2.27 | 4.17 |
| 417 | O4III | 48194.8 | 11.55 | 7.15 | -4.01 | 6.18 |
| 421 | O9.5V | 34673.7 | 12.86 | 6.83 | -3.23 | 5.16 |
| 425 | B0V | 31622.8 | 13.62 | 6.78 | -3.14 | 4.74 |
| 426 | B0V | 31622.8 | 14.05 | 6.60 | -3.14 | 4.50 |
| 429 | B0V | 31622.8 | 12.98 | 5.64 | -3.14 | 4.54 |
| 431 | O5If | 44771.3 | 10.80 | 6.99 | -3.76 | 6.33 |
| 448 | O6V | 43551.2 | 13.61 | 7.57 | -3.73 | 5.41 |
| 455 | O8V | 38459.2 | 12.92 | 6.38 | -3.43 | 5.07 |
| 457 | O3If | 50699.1 | 10.49 | 5.44 | -4.11 | 5.98 |
| 462 | O6.5III | 41304.8 | 10.33 | 5.24 | -3.66 | 5.73 |
| 465 | O5.5Ia | 43351.1 | 9.06 | 5.06 | -3.63 | 6.22 |
| 467 | B1V | 25409.7 | 13.43 | 5.04 | -2.58 | 3.90 |
| 470 | O9.5V | 34673.7 | 12.50 | 5.19 | -3.23 | 4.65 |
| 473 | O8.5V | 37239.2 | 12.02 | 5.29 | -3.38 | 4.96 |
| 480 | O7.5V | 39810.7 | 11.88 | 5.82 | -3.48 | 5.30 |
| 483 | O5If | 44771.3 | 10.08 | 5.01 | -3.76 | 5.83 |
| 485 | O8V | 38459.2 | 12.06 | 5.58 | -3.43 | 5.10 |
| 507 | O8.5V | 37239.2 | 12.70 | 5.61 | -3.38 | 4.81 |
| 515 | B1V | 25409.7 | 14.66 | 6.97 | -2.58 | 4.18 |
| 516 | O5.5V | 44874.5 | 11.84 | 7.63 | -3.84 | 6.18 |
| 531 | O8.5V | 37239.2 | 11.58 | 5.57 | -3.38 | 5.25 |
| 534 | O7.5V | 39810.7 | 13.00 | 6.54 | -3.48 | 5.14 |
| 555 | O8V | 38459.2 | 12.51 | 6.57 | -3.43 | 5.31 |
| 556 | B1Ib | 26302.7 | 11.01 | 6.81 | -2.67 | 5.61 |
| 575 | B1.5V | 22387.2 | 13.41 | 7.58 | -2.27 | 4.79 |
| 588 | B0V | 31622.8 | 12.40 | 6.02 | -3.14 | 4.92 |
| 601 | O9.5III | 32961.0 | 11.06 | 6.01 | -3.16 | 5.50 |
| 605 | B0.5V | 28183.8 | 11.78 | 4.23 | -2.84 | 4.34 |
| 611 | O7Vp | 41020.4 | 12.77 | 5.61 | -3.55 | 4.90 |
| 632 | O9.5I | 31477.5 | 9.88 | 5.70 | -3.00 | 5.80 |
| 642 | B1III | 23550.5 | 11.78 | 5.83 | -2.39 | 4.80 |
| 646 | B1.5?V | 22387.2 | 13.34 | 5.13 | -2.27 | 3.84 |
| 692 | B0V | 31622.8 | 13.61 | 5.69 | -3.14 | 4.31 |
| 696 | O9.5V | 34673.7 | 12.32 | 5.85 | -3.23 | 4.99 |
| 716 | O9V | 35975.0 | 13.50 | 6.10 | -3.31 | 4.65 |
| 734 | O5If | 44771.3 | 10.04 | 5.54 | -3.76 | 6.06 |
| 736 | O9V | 35975.0 | 12.79 | 5.46 | -3.31 | 4.68 |
| 745 | O7V | 41020.4 | 11.91 | 5.30 | -3.55 | 5.12 |
| 771 | O7V | 41020.4 | 12.06 | 7.00 | -3.55 | 5.73 |
| 793 | B1.5III? | 22908.7 | 12.29 | 6.13 | -2.33 | 4.69 |
| S03 | O8.5III | 35727.3 | 10.22 | 6.01 | -3.30 | 5.92 |
| S73 | O8V | 38459.2 | 0.00 | 6.04 | -3.43 | 5.28 |
| A20 | O8II | 37153.5 | 0.00 | 7.77 | -3.37 | 5.88 |
| A23 | B0.7Ib | 26915.3 | 0.00 | 7.28 | -2.73 | 5.55 |
| A27 | B0Ia | 28840.3 | 0.00 | 7.06 | -2.88 | 5.75 |
| A29 | O9.7Iab | 30199.5 | 0.00 | 6.92 | -3.00 | 5.48 |
| A32 | O9.5IV | 34673.7 | 0.00 | 6.73 | -3.23 | 5.43 |
| A34 | B0.7Ib | 26915.3 | 0.00 | 5.96 | -2.73 | 5.21 |
| A36 | B0Ib | 28840.3 | 0.00 | 6.51 | -2.88 | 5.48 |
| A37 | O5V | 46131.8 | 0.00 | 6.77 | -3.95 | 5.51 |
| A39 | B2V | 19952.6 | 0.00 | 5.89 | -2.00 | 4.42 |
| A41 | O9.7II | 31622.8 | 0.00 | 5.97 | -3.14 | 5.29 |
| A42 | B0V | 31622.8 | 0.00 | 5.83 | -3.14 | 4.72 |
| A44 | B0.5IV | 28183.8 | 0.00 | 5.04 | -2.84 | 4.62 |
| A45 | B0.5V | 28183.8 | 0.00 | 4.64 | -2.84 | 4.53 |
| A46 | O7V | 41020.4 | 0.00 | 4.56 | -3.55 | 5.19 |
5 DISCUSSION
Comerón et al. (2002) estimate that they have uncovered between 90 and 100 O-type stars or closely related objects in the Cyg OB2 association. Indeed, our results suggest the numerous OB candidates they have identified are likely to be OB stars. The fraction of O-stars in our sample of 14 newly identified OB stars is lower than they had predicted for the candidate sample (77%), though if we include the B supergiants which used to be O stars, we get better agreement (60%) when one considers the sample size.
However, the high fraction of suspected non-members found in this study of 14 new OB stars would suggest that many if not most of the candidate OB stars identified by Comerón et al. (2002) and still yet to be confirmed will also be non-members. The very extended spatial distribution of the CPR2002 sample, as shown in Fig. 4, also supports this prediction. The Cyg OB2 cluster may be more extensive and contain more O stars than previously thought, however it now seems less likely that a concentrated effort would yield over 100 O stars as predicted by Knödlseder (2000). Based on this definition used by Knödlseder (2000), Cyg OB2 would not be classified as a super star cluster. Naturally, spectroscopic observations of the remaining OB candidates listed by Comerón et al. are needed to resolve this debate. Moreover, we can not rule out that deeper near-infrared investigations concentrated on the center of the the Cyg OB2 cluster region may reveal the underlying massive cluster the Knödlseder (2000) near-infrared study suggests.
5.1 Does the Milky Way contain Super Star Clusters?
The term “super star cluster” was first used to describe very luminous young star clusters in nearby late type galaxies (Hodge 1961). Early examples include 30 Dor in the Large Magellanic Cloud and NGC 330 in the Small Magellanic Cloud, each harboring tens of thousands of stars. No such galactic counterparts, outside of the very old globular clusters, were known to exist in the galaxy. Recently, the term has been used to describe quite a number of galactic clusters, first the Arches and Quintuplet clusters near the galactic center, and now Cygnus OB2 (Knödlseder 2000) and Westerlund 1 (Negueruela & Clark 2003). Based on the proximity of the last two, and assuming a similar distribution within the solar circle, Knödlseder et al. (2002) predict there may be as many as 100 similar clusters in the Galaxy. Interestingly, evidence for such a large population of very massive clusters, is not unprecedented. Extrapolating the cluster luminosity function of our galaxy, van den Bergh & Lafontaine (1984) predicted a total of 102 clusters with = -11, the absolute visual magnitude of 30 Dor! A continued extrapolation of our galaxy’s cluster luminosity function predicts our galaxy to contain one cluster with = -12 (Larsen 2002).
Van den Bergh & Lafontaine (1984) found it hard to believe clusters with such mass could be contained within our galaxy. Perhaps for this reason, it’s been assumed that our galaxy’s cluster luminosity function steepened over the range (Larsen 2002). However, there are many factors contributing to massive clusters being hidden from view. Most important is the fact that the most massive open clusters are also among the youngest (see Fig. 6 of Larsen & Richtler 1999). This is because very massive and presumably more extended clusters are preferentially destroyed over lower mass clusters by dynamical friction in a relatively short timescales (109 yrs; de Grijs et al. 2003). Recently, Portegies Zwart et al. (2001; 2002) showed the exceedingly fast dynamical evolution and fatal disruption of massive clusters formed in the inner 200 pc of the galaxy, predicting their apparent loss of detection in just 5 million years. They predict the central portion of our galaxy could easily harbor as many as 50 clusters with properties similar to the Arches or Quintuplet massive cluster systems. Thus, our galaxy’s most massive clusters are severely affected by line of sight (due to their close proximity to the galactic plane) and local extinction (due to their youth) severely hindering our efforts to find such objects. Given the rather low star formation rate (SFR) seen at the sun’s galactic radius, and the known correlation between SFR and cluster luminosities (Larsen 2002 and references therein), one would not expect to find examples of very massive star clusters locally. An absence of massive clusters in the well sampled, but small region out at the galactic radius of our Sun can not be used as evidence for the absence of massive clusters elsewhere. Finally, the known absence of massive clusters in M31 while considering they might yet exist in the Milky Way is reasonable considering M31’s earlier Hubble type (Kennicutt & Chu 1988).
5.2 How might galactic Super Star Clusters be found?
Historically, radio surveys of the galactic plane have been successful to identify very young and massive galactic HII regions (Westerhout 1958), and to trace the structure of our galaxy (Georgelin & Georgelin 1976). A recent series of papers by Blum and collaborators (Blum, Damineli, & Conti 1999; Blum, Conti, & Damineli 2000, Blum, Damineli, & Conti 2001) have further investigated some of the largest of these radio identified HII regions. Referred to as Giant HII regions (GHII), these HII regions have Lyman continuum fluxes more than 10 times that of Orion, or about 10 O stars. Their near-infrared studies were able to spectroscopically confirm OB stars in all three GHII regions. However, emission line sources consistent with very massive young stellar objects were also found to lie among the brightest sources in each of the three clusters, a clear indication of the very young age of clusters (not more than perhaps 1 million years old) found via radio surveys. Curiously, the spectroscopic distances of all three of the GHII regions studied by Blum and collaborators turned out to be nearer than the radio measurements had estimated. This significantly reduced their intrinsic Lyman continuum flux, demoting two of them from being true GHII regions to simply large HII regions. Most important, their results indicate we are still biased to detecting HII regions on the near side of the galaxy, even when using radio surveys. Only a few true GHII regions found via radio surveys are confirmed to lie on the far side of the galaxy (such as W49A, see Conti & Blum 2002).
Neither Cyg OB2 nor Westerlund 1 are easily detected in the radio. This is an important point to recognize. Massive clusters older than a few million years will have been missed in galactic radio surveys. How do we find our Galaxy’s super star clusters?
Systematic infrared surveys to search for massive clusters with follow up near-infrared spectroscopic studies of their stellar members may be the only method. Sifting through deep near-infrared imaging surveys to search for new massive clusters will be an important direction for galactic studies in the next decade. Equally important will be determining the completeness limits for such objects, though it may only be possible within a few kpc from the Sun. It is important to know if massive clusters found in the disk share any of the extreme qualities of the very massive clusters found at the galactic center. To do so means uncovering and then investigating a significant number of disk super star clusters (if they exist) to get a statistically meaningful result on the characteristics of this new class of galactic objects.
The Cyg OB2 cluster serves as an important first calibration. Because it has significant extinction, Knödlseder et al. (2002) was forced to investigate, isolate and characterize the cluster using near-infrared methods. However, the extinction is not so great that cross-checks with more traditional cluster studies, namely optical MK classification of many of its members, was ruled out. Combining near-infrared and optical observations to study Cyg OB2 has given us the best of both methods and resulted in a clearer description of the cluster and member properties. The 100% success rate, so far, of the CPR2002 study to select early-type stars from a dense field using very low resolution near-infrared measurements alone, gives great confidence in the ability to apply similar techniques to heavily reddened, near-infrared clusters now being uncovered. MK classification spectra are the most desirable, but for stars with A or so, the benefits of a more accurately determined optical spectral type are eclipsed by the need for a very large telescope to obtain such spectra. For these stars, and this would include the remaining 31 OB candidate stars listed by CPR2002 which were too extinguished for this study, stellar classification will need to be made at near-infrared wavelengths (Hanson et al. 1996).
6 CONCLUSIONS
New optical MK classification spectra have been obtained for 14 candidate OB stars from the Cyg OB2 cluster which were sifted and identified using near-infrared photometric and low resolution spectroscopic measurements. Our optical spectra confirm the early-type nature of these stars and lends support to Knödlseder’s (2000) result that Cyg OB2 contains more early-type stars than previously thought. However, about half of the OB stars appear to be non-members based on their evolutionary age. For this and other reasons, the present O-star count, still under 100, does not yet allow Cyg OB2 to be classified as a super star cluster, as defined by Knödlseder et al. (2002).
Our investigation of the Cyg OB2 cluster characteristics indicates that its distance may be slightly closer than previous work quoted (DM = 11.2; Massey & Thompson 1992) when the very young age, and thus under-luminous nature of these stars (as compared to the more evolved clusters used in the derivation of dwarf star absolute magnitudes) is taken into consideration. A revised distance of DM = 10.8 is predicted based on fitting 35 dwarf cluster members with spectral types between O7.5 and B1 to a 2 x 10⁶ year isochrone. We also explored the newly presented effective temperature scale for dwarf O stars of Martins et al. (2002), using a similar fit of the dwarf population to a 2 x 10⁶ year isochrone. The new lower temperatures and thus lower absolute luminosities (particularly for mid-O dwarf stars) gives a very close value for the distance to Cyg OB2 (DM = 10.4). This lends some urgency to further observational testing and investigation of the new lower effective temperature scale for O dwarf stars, as it looks to be strongly supported by many independent theoretical groups at this time. Observational studies of additional massive clusters containing a significant sample of OB dwarf stars would be useful in this regard.
Our study has examined and confirmed the reliability of near-infrared broad band colors combined with low resolution survey spectra to accurately sift OB stars from a dense field population. It would appear evidence for very massive clusters in our galaxy is mounting, based both on direct observations of fairly massive clusters near the Sun, as well as extrapolations of our galaxy’s cluster luminosity function. Neither optical nor radio searches are likely to be successful in locating these objects. However, numerous near-infrared clusters are currently being uncovered with 2MASS. For extinction values A, determination of spectral types for the stars in these clusters will need to be obtained using near-infrared classification techniques. Great possibilities lie ahead for the discovery and precise study of very massive galactic OB clusters, uncovering very massive, possible, super star clusters currently hidden within the Galaxy.
References
- (1)
- (2) Bianchi, L. & Garcia, M. 2002, ApJ, 581, 610
- (3)
- (4) Blum, R. D., Damineli, A., & Conti, P.S. 1999, AJ, 117, 1392
- (5)
- (6) Blum, R. D., Conti, P.S. & Damineli, A. 2000, AJ, 119, 1860
- (7)
- (8) Blum, R. D., Damineli, A., & Conti, P.S. 2001, AJ, 121, 3149
- (9)
- (10) Chlebowski, T., & Garmany, C. D. 1991, ApJ, 368, 241
- (11)
- (12) Comerón, F., et al. 2002, A&A, 389, 874
- (13)
- (14) Conti, P. S. 1988, in O Stars and Wolf-Rayet Stars, ed. P. S. Conti & A.B. Underhill (NASA SP-497), 121
- (15)
- (16) Conti, P. S. & Blum, R. D. 2002, ApJ, 564, 827
- (17)
- (18) de Grijs, R., Basian, N. & Lamers, H. J. G. L. M. 2003, ApJ, 583, L17
- (19)
- (20) Dougherty, S.M., williams, P.M., & Pollacco, D.L. 2000, MNRAS, 316, 143
- (21)
- (22) Dutra, C. M., Bica, E. 2000, A&A, 359, L9
- (23)
- (24) Dutra, C. M., Bica, E. 2001, A&A, 376, 434
- (25)
- (26) Eckart, A., Ott, T., Genzel, R. 1999, A&A, 352, L22
- (27)
- (28) Figer, D. et al. 1999, ApJ, 525, 750
- (29)
- (30) FitzGerald, M. P. 1970, A&A, 4, 234
- (31)
- (32) Georgelin, Y.M. & Georgelin, Y.P. 1976, A&A, 49, 57
- (33)
- (34) Hanson, M. M., Conti, P. S., Rieke, M. J. 1996, ApJS, 107, 281
- (35)
- (36) Hanson, M. M., Howarth, I. D., Conti, P. S. 1997, ApJ, 489, 698
- (37)
- (38) Herrero, A., Puls, J., & Najarro, F. 2002, A&A, 396, 949
- (39)
- (40) Heydari-Malayeri, M., Meynadier, F., & Walborn, N. R. 2003, A&A, 400, 923
- (41)
- (42) Hodge, P. 1961, ApJ, 133, 413.
- (43)
- (44) Hofmann, K.-H., Balega, Y., Ikhsanov, N.R., Miroshnichenko, A.S., & Weigelt, G. 2002, A&A, 395, 891
- (45)
- (46) Humphreys, R. M. & McElroy, D. G. 1984, ApJ, 284, 565
- (47)
- (48) Hutchings, J. B. 1981, PASP, 93, 50
- (49)
- (50) Ivanov, V. D., Borissova, J., Pessev, P., Ivanov, G. R., Kurtev, R. 2002, A&A, in press
- (51)
- (52) Jenniskens, P. & Desert, F.-X., 1994, A&A, 106, 39
- (53)
- (54) Johnson, H. L. & Morgan, W. W. 1954, ApJ 119, 344
- (55)
- (56) Kennicutt, R. C. & Chu, Y. 1988, AJ, 95, 720
- (57)
- (58) Knödlseder, J. 2000, A&A, 360, 539
- (59)
- (60) Knödlseder, J. et al. 2002, A&A, 390, 945
- (61)
- (62) Larsen, S. S. 2002, ApJ, 124, 1393
- (63)
- (64) Larsen, S. S. 1999, A&A, 345, 59
- (65)
- (66) Markova, N., Puls, J., Repoloust, T., & Markov, H. 2003, in press
- (67)
- (68) Martins, F., Schearer, D., Hillier, D. J. 2002, A&A, 382, 999
- (69)
- (70) Massey, P. & Hunter, D., 1998, ApJ, 493, 180
- (71)
- (72) Massey, P. & Thompson, A. B., 1991, AJ, 101, 1408
- (73)
- (74) Massey, P., Waterhouse, E., & DeGioia-Eastwood, K. 2000, AJ, 119, 2214
- (75)
- (76) Massey, P., Degioia-Eastwood, K., & Waterhouse, E. 2001, AJ, 121, 1050
- (77)
- (78) Morgan, W. W., Meinel, A. B., Johnson, H. M. 1954, ApJ 120, 506
- (79)
- (80) Munch, L. & Morgan, W. W. 1953, ApJ, 118, 161
- (81)
- (82) Clark, J. S., Negueruela, I. 2002, A&A, 396, L25
- (83)
- (84) Negueruela, I., Clark, J. S. 2003, in a Massive Star Odyssey, from Main Sequence to Supernova, Proceedings IAU Symp. 212, eds. van der Hucht, K. A., Herrero, A., Esteban, C., in press.
- (85)
- (86) Portegies Zwart, S. F., Makino, J., & McMillan, S. L. W. 2001, ApJ, 546, L101
- (87)
- (88) Portegies Zwart, S. F., Makino, J., McMillan, S. L. W. & Hut, P. 2002, ApJ, 565, 265
- (89)
- (90) Rieke, G. H., Lebofsky, M. J. 1985, ApJ, 288, 618
- (91)
- (92) Russeil, D. 2003, A&A, 397, 133
- (93)
- (94) Schmutz, W., & Vacca, W.D. 1991, A&AS, 89, 259
- (95)
- (96) Schulte, D. H. 1956, ApJ, 124, 530
- (97)
- (98) Schulte, D. H. 1958, ApJ, 128, 41
- (99)
- (100) Slesnick, C. L., Hillenbrand, L. A., Massey, P. 2002, ApJ 576, 880
- (101)
- (102) Skrutskie, M., et al. 1997, in The Impact of Large Scale Near-IR Sky Surveys, ed. Garson, et al. (Dordrecht: Kluwer), 25.
- (103)
- (104) Torres-Dodgen, A. V., Carroll, M., Tapia, M. 1991, MNRAS, 249, 1
- (105)
- (106) van den Bergh, S. & Lafontaine, A. 1984, AJ, 89, 1822
- (107)
- (108) Walborn, N. R. & Fitzpatrick, E. L. 1990, PASP, 102, 379
- (109)
- (110) Walborn, N. R. & Blades, J. C. 1997, ApJS, 112, 457
- (111)
- (112) Walborn, N. R. 2002, AJ, 124, 507
- (113)
- (114) Wegner, W. 2000, MNRAS, 319, 771
- (115)
- (116) Westerhout, G. 1958, BAN, 14 215
- (117)