MULTISCALE IMAGE ANALYSIS APPLIED TO /HADRON DISCRIMINATION FOR VERY HIGH ENERGY GAMMA RAY ASTRONOMY WITH ARGO-YBJ
Abstract
Intrinsic differences in the processes involved in the electromagnetic and hadronic shower development in the atmosphere have been evidenced by means of a careful analysis of the event image given by the ARGO-YBJ detector. The images have been analyzed at different length scales and their multifractal nature has been studied. The use of the multiscale approach together with a properly designed and trained Artificial Neural Network, allowed us to obtain a good discrimination power. If confirmed by further studies on different event cathegories, this result would allow to nearly double the detector sensitivity to gamma ray sources.
1 Introduction
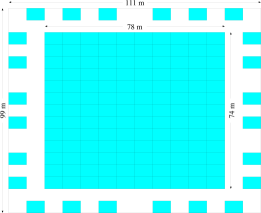
Gamma ray astronomy at energies around 100 -10 is the main scientific goal of the ARGO-YBJ experiment [1, 2]. The detector, which is now being assembled in Tibet (China) at 4300 a.s.l., is a full coverage Extensive Air Shower array consisting of a Resistive Plate Chamber (RPC) carpet of more than 6000 . It is logically divided into 154 units called clusters ( m2), made by 12 RPCs (see Fig.1). Each RPC ( m2) is read out by 10 pads ( cm2), which are further divided into 8 different strips ( cm2), which provide the highest available space resolution. The signals coming from all the strips of a given pad are sent to the same channel of a multihit TDC. The whole system is designed in order to provide a single hit time resolution at the level of 1 ns, thus allowing a complete and detailed three-dimensional reconstruction of the shower front. The high altitude ( g/cm2 ) and the full coverage ensure a very low primary energy threshold (E100 GeV), while the detector time resolution gives a good pointing accuracy, thus allowing a high sensitivity to -ray sources.
Gamma/hadron discrimination is a key issue in Very High Energy (VHE) gamma ray astronomy since it allows, together with a good angular resolution, the rejection of the huge background due to charged primary hadrons. The use of a full coverage detector with a high space granularity - like ARGO-YBJ - can give detailed images of the shower front. Intrinsic differences in the processes involved in the electromagnetic and hadronic shower development in the atmosphere can then be evidenced by means of a careful analysis of the event[3, 4]. Recently the use of multiscale behavior of event images has been showed to give good results in experiments exploiting the Imaging Atmospheric Cherenkov Techniques (IACT), together with the use of the so-called Hillas parameters [5, 6]. In these experiments the image is integrated over the entire shower development, while in the case of ARGO-YBJ a section of the shower is provided at a given (slanted) depth only, thus giving a potential lack of information. However the typical disuniformities present in hadronic events might be better evidenced in the case of ARGO-YBJ , these being partially masked in the case of IACT detectors because of the smearing effect due to the integration of the information along the shower development.
In this work event images have been analyzed at different length scales and their multifractal nature has been studied. In particular the Discrete Wavelet Transforms have been applied since they allowed a differential approach to multifractality, that gave a higher discrimination power.
2 The multiscale approach
2.1 MultiFractal Analysis (MFA)
We have considered the shower image seen by ARGO-YBJ as a function defined on a two-dimensional space and corresponding to the amplitudes given by the measured strip multiplicity. As a first step we can calculate the multifractal moment of order q, defined (see [7]) at the length scale as:
| (1) |
where
| (2) |
gives the probability for a hit to be in the box of dimension centered at , being the total content of the image. By dividing the image, at different steps, into non overlapping pixels of size , we can evaluate the box-amplitudes . As pointed out in [5, 6, 7], at each order , the MF moment is expected to have a power law dependence on in the high resolution limit, namely: for .
By fitting the behavior of on (for each value of ) the MF scaling exponent can be extracted. The dependence of on gives the main information on the MF properties of the image.
2.2 The Discrete Wavelet Transform Analysis (DWTA)
As shown in [7], the MF approach might not sufficiently characterize the image. An approach to multifractality based on the discrete wavelet transformations (DWT) is more appropriate. DWT can be seen as an expansion of on a discrete set of basis functions that are generated by scaling a so-called mother wavelet. For sake of simplicity, let us consider a one-dimensional case. If the Haar mother wavelet is chosen (see Fig.2), the differences between the box amplitudes of two adjacent cells can be given by the proper convolution:
| (3) |
In this simple case, the mother wavelet can be indicated as (+ -). A differential approach to multifractality is then given by defining the DWT moment as:
| (4) |
Also in this case the scaling properties of the image can be evidenced at high resolutions: when .
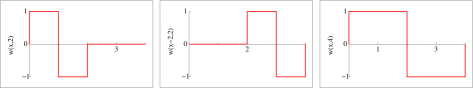
In the case of a two-dimensional distribution (i.e. an image) we need three base wavelets that can be indicated as:
| (5) |
This led to write three different DWT moments , , defined as:
| (6) | |||
These functions are expected to scale like , when , with different exponents , whose dependence on gives the maximum information on the image properties.
3 The Monte Carlo Samples
We have generated 2.8105 gamma-initiated showers and 2.6105 proton-initiated ones making use of the CORSIKA code [8]. The events have been taken within the energy range 30 GeV100 TeV with azimuth between 0 and 15 degrees and core at the detector center. The primary energy spectrum has been generated according to the measured power laws with spectral index =2.5 for gammas and =2.7 for hadrons.
The detector response has been fully simulated by using ARGOG, a tool (based on the GEANT3 package [9]) developed within the ARGO-YBJ collaboration. Since it is the hit multiplicity which is actually measured in EAS experiments, it is correct and appropriate to classify events following this variable and not in terms of the primary energy. Therefore we divided the simulated data sample into five multiplicity windows as reported in Tab.1, where the average primary energies are also shown. The and proton energies are obviously different since they depend on the processes involved in the shower development in the atmosphere. In particular proton-induced showers results in lower multiplicity events with respect to the case of photon-induced ones with the same primary energy. Moreover in order to avoid distortion effects due to the finite size of the energy window in which the samples have been simulated, we have considered in the analysis only events which produced more than 50 and less than 6000 hits. This corresponds to average primary photon energies between GeV and TeV (see Tab.1).
4 Event analysis
The multiresolution quantities defined in Sec.2 have been used to analyze each event image. As reported in Sec.1 the ARGO-YBJ detector is made by a central carpet and a guard ring (see Fig.1). In order to preserve the same symmetry at different lenght scales , we decided to neglect, in this first analysis, the information coming from the external ring. We also decided to mask the central carpet with a square grid. In particular, since it is made of (120130)pads, the first and the last row of pads were not considered, while four empty columns of pads were added (two on the left and two on the right), thus obtaining a (128128) pad mask. In order to limit statistical fluctuations of the hit multiplicity in the smallest pixels, the minimum pixel size considered in the analysis was set at (22)pads - about m2 - which will then corresponds to the maximum resolution, i.e. =1. The analysis of an event goes then throught different steps, each correponding to different lenght scales. At the -th step (with ), the image is divided into 22n square pixels of size , containing each pads, and the total strip multiplicity is computed in each considered pixel.
 |
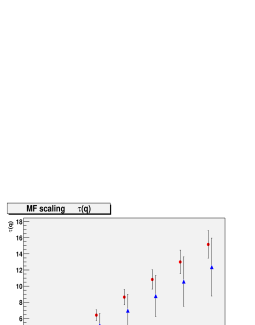 |
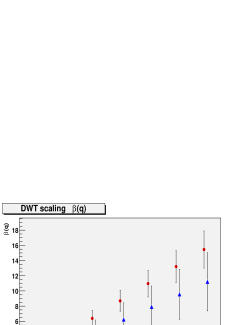
The values of Log(Zq()) and Log(Wq()) have been calculated following Eq.1 and Eq.6, and their dependences on Log() have been fitted with a first order polynomial in the region where the scaling is expected (i.e. ), for different values of the moment . The scaling exponents (q) and (q), defined in Sec.2, have then been obtained for each event. Their dependences on the moment are shown in Fig.3 for a sample of gamma and proton initiated events. As can be seen there is a separation of the average values of the scaling exponents between electromagnetic and hadronic showers, which is however partly masked by the large fluctuations. Therefore the separations of the MF and DWT parameters are not sufficient in order to give a good discrimination between e.m. and hadronic showers, unless an Artificial Neural Network (ANN) is used as in ref.[5, 6]. We then decided to use multifractal parameters as inputs to a properly designed and trained ANN (see Sec.5).
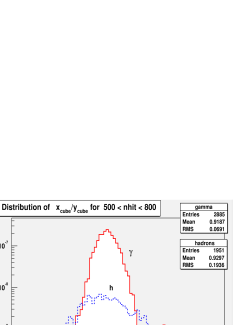
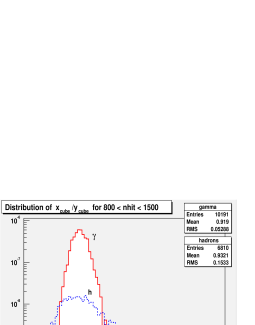
In order to increase the /h separation, a study on the shape and the simmetry of the event image has also been made. In particular we studied the skewness of each event by means of the third moment of the distributions of the hit coordinates on the detector plane, namely and . In general, the skewness of a sequence of values is defined as:
| (7) |
where and are the average and r.m.s. over , respectively. In our case we studied the behaviour of the quantity , with:
| (8) |
where is the strip multiplicity of the pad at the position . The value of is reported in Fig.4 for two samples of e.m. and hadronic showers in two different multiplicity windows. As can be seen, its average is almost one as expected from both its definition and the detector geometry, while the r.m.s is always larger for proton-initiated showers, due to the large fluctuations present in hadronic events. This behaviour suggested the use of as one of the inputs to the ANN.
 |
 |
5 The Artificial Neural Network
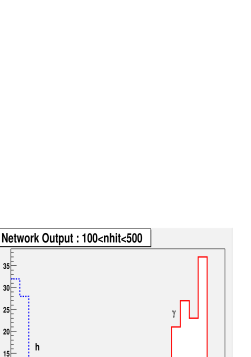
In order to perform the /hadron discrimination using the parameters we have introduced in the previous sections, we decided to make use of an Artificial Neural Network. The Neural Network we have chosen is of the feed forward type and it is made of 3 perceptrons layers. The ANN input is an eight-dimensional vector whose elements are: the event total hit multiplicity , the value of , the multifractal exponents and for . The output vector is defined in a one dimensional space: it is trained to be 1 for gamma-initiated events and 0 for hadronic showers.
 |
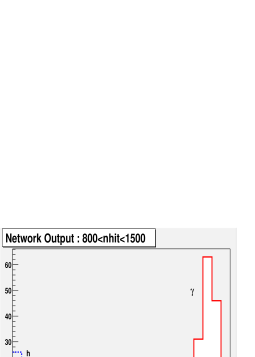 |
Networks were implemented and optimized by using the Stuttgart Neural Network Simulator (SNNS) tool [10]. In designing the ANN, its characteristics were been deeply studied in order to reach a good compromise between the increase of recognition capability and the processing time. The network training was separately performed in 5 multiplicity windows by using several thousands events (see Tab.1). The ANN were then tested by using an independent reduced sample of events and the recognition efficiency , together with the proton contamination , were measured. The quantities and reached their plateau value after few thousands of ANN training epochs. An example of ANN output for a couple of multiplicity windows is shown in Fig.5.
The detector sensitivity to -ray sources is defined as /, where is the number of gamma-initiated events, while is the hadron contamination of the considered sample. The use of a /h discrimination tool like the one we are considering in this work makes the sensitivity to be multiplied by the factor /.
In this work values of 2 have been reached (see Tab.1), which are among the largest obtained with various techniques in the experiments working in the field [6]. This result would allow to nearly double the ARGO-YBJ sensitivity to a given source obtained from the pointing accuracy alone[11] or, equivalently, to reduce by a factor four the time needed to observe it above the hadron background, with a given statistical significance.
| nhits | events () | events (p) | E | E | Q |
|---|---|---|---|---|---|
| 50100 | 6657 | 3862 | 0.8 TeV | 0.5 TeV | 1.280.01 |
| 100500 | 11556 | 6862 | 1.8 TeV | 1.1 TeV | 1.420.02 |
| 500800 | 2571 | 1644 | 4.9 TeV | 2.9 TeV | 2.010.10 |
| 8001500 | 3087 | 1963 | 7.6 TeV | 4.6 TeV | 1.780.07 |
| 15006000 | 4329 | 3053 | 18.4 TeV | 11.3 TeV | 1.780.06 |
6 Concluding remarks
We presented the first results of a multiscale image analysis performed on Monte Carlo events by taking into account all the processes of shower development in the atmosphere and a full simulation of the ARGO-YBJ detector response. The images have been analyzed at different length scales and their multifractal nature has been studied. A set of eight image parameters has been identified and used as the input for an Artificial Neural Network, which was then trained in order to discriminate gamma initiated from proton-initiated showers.
Since this is the first attempt of this kind of analysis in a EAS detector like ARGO-YBJ , we decided to restrict this study to events with the core at the detector center and azimuth angles not larger than 15 degrees, while all the energies with the correct spectral dependencies have been simulated in a wide range. At this level we also neglected the contribution given by primary nuclei heavier than protons. This is a good first order approximation because of the proton-dominated cosmic ray composition in the considered energy region. Furthermore heavier-nuclei-induced showers would produce event patterns with characteristics even more different from gamma-initiated ones.
If the results obtained in this first study will be confirmed by a further analysis on the whole event categories (now in progress), the detector sensitivity to a given source would nearly double or, equivalently, the time needed to observe it above the hadron background, with a given statistical significance, would be reduced by a factor four.
The best performances in /h discrimination have been obtained for photon primary energies in the few TeV range, while at higher energy this analysis might be well complemented by measuring the muon content of the shower [12].
References
- 1 . C.Bacci et al., Nucl. Instr. & Meth. in Phys. Res. A443, 342 (2000)
- 2 . C.Bacci et al., Astroparticle Phys. 17, 151 (2002)
- 3 . R.S.Miller and S.Westerhoff, Astroparticle Phys. 11, 379 (1999)
- 4 . S.Bussino and S.M.Mari, Astroparticle Phys. 15, 65 (2001)
- 5 . A. Haungs et al., Astroparticle Phys. 12 145 (1999)
- 6 . B. M. Schfer et al., Nucl. Instr. Meth. in Phys. Res., A465 342 (2001)
- 7 . Jan W. Kantelhardth et al., Physica A220 219 (1995)
- 8 . D.Heck et al., Report FZKA 6019, Forschungszentrum, Karlsruhe (1998)
- 9 . R.Brun et al., CERN Publication DD/EE/84/1 (1992)
- 10 . http://www-ra.informatik.uni-tubingen.de/SNNS/
- 11 . S.Vernetto et al., Proceedings of the 28th ICRC Conference, Tsukuba, 2003.
- 12 . See K.Fratini et al., these proceedings.