INTEGRAL observations of the black hole candidate H 1743322 in outburst††thanks: Based on observations with INTEGRAL, an ESA project with instruments and science data centre funded by ESA member states (especially the PI countries: Denmark, France, Germany, Italy, Switzerland, Spain), Czech Republic and Poland and with the participation of Russia and the USA.
INTEGRAL made 3 observations in 2003 April of the black hole candidate H 1743322 during the rising part, and close to the maximum, of an outburst. H 1743322 was previously observed in outburst in 1977–1978. The source is located in a crowded region of the sky ( and at least 18 sources are clearly detected in the field of view of the ISGRI gamma-ray imager during a 277 ks exposure. These are well known persistent X-ray binary sources and 3 transient sources in outburst. The combined 5–200 keV JEM-X and SPI spectrum of H 1743322 is well fit with an absorbed atom cm-2) soft (photon index ) power-law model, consistent with H 1743322 being in a high/soft state.
Key Words.:
Accretion, accretion disks – X-rays: individual: H 1743322 X-rays: binaries1 Introduction
The transient X-ray source H 1743322 (also referred to as 1H 1741322) was discovered during an outburst in 1977–1978 using the HEAO-1 and Ariel V satellites (Doxsey et al. d:77 (1977); Kaluzienski & Holt kh:77 (1977)). The X-ray spectrum was very soft with, at times, a power-law tail extending to 100 keV (Cooke et al. c:84 (1984)). Due to these spectral characteristics H 1743322 was proposed as a black hole candidate by White & Marshall (wm:84 (1984)). H 1743322 was not observed subsequently, although there was a detection on 1984 August 31, by the non-imaging EXOSAT Medium Energy instrument during a slew maneuver, of a faint (5 mCrab) source at a position consistent with that of H 1743322 (Reynolds et al. r:99 (1999)).
On 2003 March 21, when INTEGRAL was performing scans of a region of sky close to the galactic centre, a bright source was detected in the field of view of the gamma-ray imager and designated IGR J174643213 (Revnivtsev et al. re:03 (2003)). Subsequent observations showed that the source flux had increased by a factor 3 by 2003 March 26. During an RXTE Proportional Counter Array (PCA) scan of the galactic bulge region on 2003 March 25, Markwardt & Swank (2003a ) reported the detection of a new source which they designated XTE J1746322. They noted that the source was positionally consistent with IGR J174643213. PCA observations on 2003 March 28 revealed strong quasi-periodic oscillations with a period of 20 s, but no coherent pulsations were detected. The PCA spectrum is consistent with a power-law with a photon index, , of and an absorbing column, , of atom cm-2. These timing and spectral properties are consistent with H 1743322 being a black hole candidate. The most commonly used position for H 1743322 is from the HEAO A-1 catalog (Wood et al. w:84 (1984)). However, as Markwardt & Swank (2003b ) point out, the HEAO 1 Modulation Collimator (MC) instrument determined two equally probable positions for H 1743322 (Gursky et al. g:78 (1978)). The HEAO A-1 catalog reports the western position. The eastern MC position is consistent with the INTEGRAL position. Thus, it is highly probable that the source observed by INTEGRAL and RXTE in 2003 is indeed H 1743322 undergoing another outburst.
During the 2003 outburst a compact variable radio source was found with the VLA at a position consistent with H 1743322 (Rupen et al. ru:03 (2003)). Infrared imaging revealed a likely candidate with a K band magnitude of 13–14 (Baba et al. b:03 (2003)) which may also be visible in I and R-band images obtained with the Magellan-Clay telescope (Steeghs et al. s:03 (2003)). The best location for H 1743322 is probably the revised VLA position of R.A. = , Decl. = (J2000) with an uncertainty of (Steeghs et al. s:03 (2003)).
2 Observations
The INTEGRAL payload (Winkler et al. w:03 (2003)) consists of two gamma-ray instruments, one of which is optimized for 15 keV to 10 MeV high-resolution imaging (IBIS; Ubertini et al. u:03 (2003)) and the other for 20 keV to 8 MeV high-resolution spectroscopy (SPI; Verdrenne et al. v:03 (2003)). IBIS provides an angular resolution of full-width at half-maximum (FWHM) and an energy resolution, , of 12 FWHM at 100 keV. SPI provides an angular resolution of FWHM and an of 500 FWHM at 1.3 MeV. The extremely broad energy range of IBIS is covered by two separate detector arrays, ISGRI (15–500 keV) and PICsIT (0.2–10 MeV). The payload is completed by X-ray (JEM-X; 3–35 keV; Lund et al. l:03 (2003)) and optical monitors (OMC; V-band; Mas-Hesse et al. m:03 (2003)). The instruments are co-aligned and are operated simultaneously.
As part of a Target of Opportunity programme on known black hole candidates, 3 INTEGRAL observations of the region of sky containing H 1743322 were performed, each separated by about one week (Table 1). The 2–12 keV RXTE All-Sky Monitor (ASM) light curve and hardness ratio plots of part of the 2003 outburst are shown in Fig. 1 with the times of the INTEGRAL observations indicated. These took place during the initial 30 day rising part of the outburst, with the third observation close to the 2–12 keV outburst maximum. The hardness ratio plot indicates that H 1743322 became softer as the intensity increased towards the maximum.
| Obs | Start Time (UTC) | End Time (UTC) | Exp (ks) | |
|---|---|---|---|---|
| 1 | 2003 Apr 06 15:41 | Apr 07 14:48 | 34 | 74.8 |
| 2 | 2003 Apr 14 00:21 | Apr 15 06:13 | 46 | 101.2 |
| 3 | 2003 Apr 21 06:24 | Apr 22 14:16 | 46 | 101.2 |

The data from the 3 observations were processed using the Off-line Scientific Analysis (OSA) software provided by the INTEGRAL Science Data Centre (ISDC; Courvoisier et al. c:03 (2003)). This includes pipelines for the reduction of INTEGRAL data from all four instruments. The 3 high-energy instruments use coded masks to provide imaging information. This means that photons from a source within the field of view (FOV) are distributed over the detector area in a pattern determined by the position of the source in the FOV. Source positions and intensities are determined by matching the observed distribution of counts with those produced by the mask modulation.
3 Results
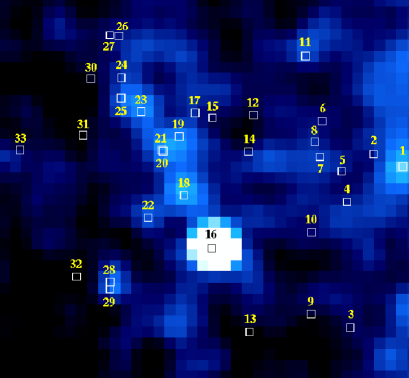
Since H 1743322 is located close to the galactic centre ( where many bright X-ray sources are located, images of the region of sky observed by IBIS were produced in order to ensure that H 1743322 could be resolved from any nearby sources and to study the surrounding field. ISGRI images were produced in the 15–40 keV, 40–100 keV and 100–200 keV energy ranges by summing data from the 126 individual pointings of all 3 observations. H 1743322 was clearly detected in all 3 images which were then combined into a single multi-color image (Fig. 2). At least 18 sources are clearly evident and can be identified with well known persistent X-ray binaries or transients such as IGR J170913624 (Kuulkers et al. k:03 (2003)) which were active at the time. The spectral capability of ISGRI is well demonstrated by the various colors of different types of sources in Fig. 2. Low-mass X-ray binaries with neutron star compact objects such as GX 51, GX 9+1, GX 3+1, GX 349+2, 4U 1820303, 4U 1735444 and 4U 1728337 appear as reddish objects, consistent with their “soft” spectra, while sources such as 1E 1740.72942 and IGR J170913624, which may contain black holes, appear blue due to their “harder” spectra. Closer examination of the “tail” extending from 1E 1740.72942 indicates that this is probably unresolved emission from a number of known X-ray point sources (Fig. 3).
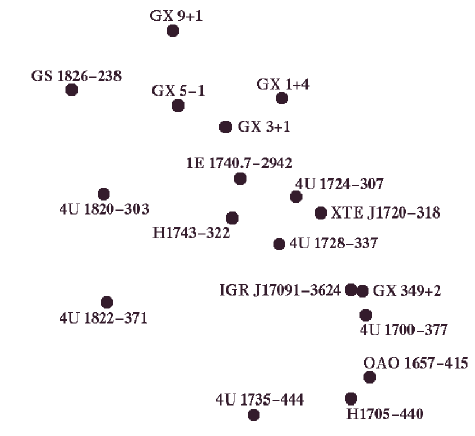
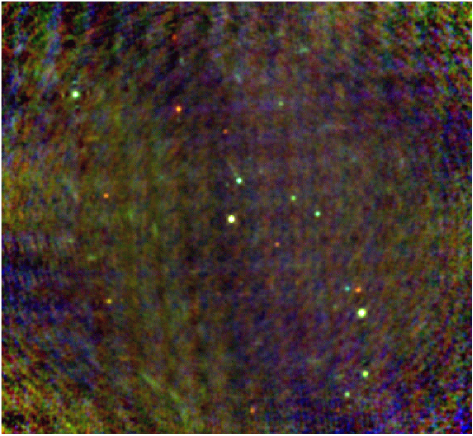
Figure 4 shows ISGRI 15–40 keV and 40–100 keV background subtracted light curves of H 1743322 with a binning of 2200 s. The lower panel shows the hardness ratio (counts in the energy range 40–100 keV divided by those between 15–40 keV). The intensities during the first 2 observation are similar, while during the third observation the source is clearly brighter and more variable. In contrast to the ASM 2–12 keV hardness ratio (Fig. 1), the 15–100 keV ISGRI hardness ratio increased slightly as the source intensity increased.

Attempts to extract ISGRI spectra of H 1743322 using OSA v 1.1 were unsuccessful. Following discussions with the ISDC this is likely due to a known limitation of the software, especially in crowded fields, which will be fixed in a future release. We were unable to combine PICsIT data from individual 2200 s pointings, so these data were not considered further. Figure 2 was examined to see if there are any strong sources close to H 1743322 which could cause source confusion in SPI with its FWHM spatial resolution. The closest such source is 1E 1740.72942 which is away, and well resolved in SPI images. No such problems are expected with JEM-X with its FWHM spatial resolution and so the subsequent spectral analysis concentrates on JEM-X and SPI.
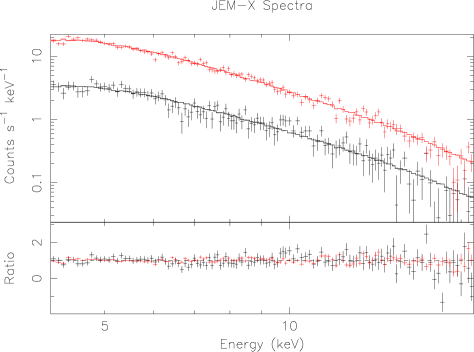
During parts of the 5 x 5 dither patterns H 1743322 was outside the JEM-X FOV and only JEM-X spectra for the pointings when H 1743322 was close to the center of the FOV were extracted. In order to search for any intensity dependent spectral changes in the JEM-X energy range, on-axis spectra during low (2003 April 15 00:26 UTC to 01:03) and high (2003 April 21 14:55 UTC to 15:32) count rate intervals were selected (Fig. 5). An absorbed power-law model was fit to both spectra to give = and and atom cm-2 and atom cm-2 for the low and high count rate intervals, respectively (all spectral uncertainties and upper limits are given at 90% confidence). Thus, there is some evidence for the source spectrum softening with increased 4–20 keV intensity, consistent with the change seen in the 2–12 keV ASM data (see Fig. 1). The upper-limits to are consistent with the absorption of atom cm-2 in the direction of H 1743322 (Dickey & Lockman d:90 (1990)). In the 5–20 keV energy range the best-fit absorbed fluxes correspond to 90 and 400 mCrab during the 2 intervals.
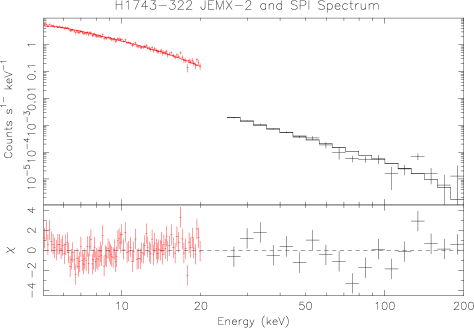
A SPI spectrum was created from data obtained between 2003 April 14 01:11 and April 15 06:17 UTC. Initial attempts to extract SPI spectra resulted in very structured residuals in which background features were clearly visible. These were also evident in the image reconstruction process where 3 individual pointings contributed excessively to the total and were excluded from further analysis. The resulting exposure time is 98.7 ks. The 25–200 keV SPI spectrum was fitted together with the 5–20 keV JEM-X spectrum obtained during the low-count rate interval. The JEM-X to SPI relative nomalisation was left free in the fitting to account for systematic uncertainties in the instrumental responses and the non-simultaneity of the spectra. We note that there were no large changes in hardness ratio during this observation (Fig. 4). The absorbed power-law model gives = and = atom cm-2 with a of 140 for 122 degrees of freedom. The best-fit value for the relative JEM-X normalisation is 0.55 and the 5–200 keV flux corresponds to 210 mCrab.
The SPI spectrum is slightly harder than that from JEM-X. It is unclear whether this is due to uncertainties in data extraction and/or instrument calibration, or additional complexity in the source spectrum, perhaps caused by the presence of a reflection component. We note that signatures of Compton reflection are apparant in the RXTE PCA spectrum of Markwardt & Swank (2003a ). As the somewhat structured residuals in Fig. 6 show, there may be additional features in the SPI background which are not properly accounted for in the extraction process.
4 Discussion
We report on 3 INTEGRAL observations in 2003 April of the poorly studied black hole candidate H 1743322 during the rise and close to the maximum of an outburst. Unfortunately, it is not yet possible to extract an ISGRI spectrum of H 1743322. The combined 5–200 keV JEM-X and SPI spectrum was successfully fit with an absorbed ( = atom cm-2) soft () power-law model. Based on this spectral shape, and the small differences in hardness ratio between the 3 observations, the source was in the canonical high/soft state observed from many black hole candidates (see e.g., McClintock & Remillard mr:03 (2003)) during all 3 observations.
Close to the previous outburst maximum, in mid-September 1977, H 1743322 exhibited a 25–180 keV power-law spectrum with (Cooke et al. c:84 (1984)), similar to that measured here. Six months later the 1–10 keV intensity had fallen by a factor of 10 (Wood et al. w:77 (1977)), but the intensity at 100 keV had hardly changed (see Fig. 2 of Cooke et al. c:84 (1984)), consistent with a hardening of the spectrum with decreasing intensity, as seen during the 2003 outburst (e.g., Fig. 1) and the power-law of measured by the PCA earlier in the outburst (Markwardt & Swank 2003a ). The PCA of atom cm-2 is consistent with that reported here suggesting that the absorption did not change strongly, at least during the early part of the outburst. There is no evidence in the INTEGRAL data presented here, nor in the PCA data of Markwardt & Swank (2003a ), for an additional low-energy component. However, such a component was detected later in the outburst on 2003 May 28 by the PCA (Homan et al. h:03 (2003)) and have been seen during the 1977–1978 outburst by HEAO 1 (R. Doxsey 1980, private communication in Cooke et al. c:84 (1984)), but no published spectrum can be found. A more detailed analysis of the INTEGRAL data will allow a sensitive search for this component, the signature of reflection, and for the 511 keV annihilation feature observed from the black hole candidates 1E 1740.72942 (Bouchet et al. b:91 (1991)) and GRS 1124684 (Goldwurm et al. g:92 (1992)).
Finally, H 1743322 is located in a crowded part of the sky and at least 18 sources are clearly detected in the IBIS FOV. These are well known accreting X-ray binaries as well as 3 transients in outburst. These observations very well illustrate the important role that INTEGRAL can play in the study of bright galactic X-ray sources, especially in crowded regions of sky where non-imaging instruments such as the BeppoSAX Phoswich Detection System (15–300 keV; Frontera et al. f:97 (1997)) may have difficulties with source confusion.
Acknowledgements.
We thank the RXTE instrument teams at MIT and NASA/GSFC for providing the ASM light curves.References
- (1) Baba, D., Nagata, T., Iwata, I., Kato, T., & Yamaoka, H. 2003, IAU Circ., 8112
- (2) Bouchet, L., Mandrou, P., Roques, J. P., et al. 1991, ApJ, 385, L45
- (3) Cooke, B. A., Levine, A. M., Lang, F. L., Primini, F. A., & Lewin, W. H. G. 1984, ApJ, 285, 258
- (4) Courvoisier, T. J.-L., Walter, R., Beckmann, V., et al. 2003, A&A, this issue
- (5) Dickey, J. M., & Lockman, F. J. 1990, ARA&A, 28, 215
- (6) Doxsey, R., Bradt, H., Fabbiano, G., et al. 1977, IAU Circ., 3113
- (7) Frontera, F., Costa, E., Dal Fiume, D., et al. 1997, A&AS, 122, 371
- (8) Goldwurm, A., Ballet, J., Cordier, B., et al. 1992, ApJ, 389, L79
- (9) Gursky, H., Bradt, H., Doxsey, R., et al. 1978, ApJ, 223, 973
- (10) Homan, J., Miller, J. M., Wijnands, R., et al. 2003, ATel, 162
- (11) Kaluzienski, L. J., & Holt, S. S. 1977, IAU Circ., 3099
- (12) Kuulkers, E., Lutovinov, A., Parmar, A., et al. 2003, ATel, 149
- (13) Lund, N., Brandt, S., Budtz-Jørgensen, C., et al. 2003, A&A, this issue
- (14) Markwardt, C. B., & Swank, J. H. 2003a, ATel, 133
- (15) Markwardt, C. B., & Swank, J. H. 2003b, ATel, 136
- (16) Mas-Hesse, M., Giménez, A., Culhane, J. L., et al. 2003, A&A, this issue
- (17) McClintock, J. E., & Remillard, R. A. 2003, preprint (astro-ph/0306213)
- (18) Revnivtsev, M., Chernyakova, M., Capitanio, F., et al. 2003, ATel, 132
- (19) Reynolds, A. P., Parmar, A. N., Hakala, P. J., et al. 1999, A&AS, 134, 287
- (20) Rupen, M. P., Mioduszewski, A. J., & Dhawan, V. 2003, IAU Circ., 8105
- (21) Sakano, M., Koyama, K., Murakami, H., Maeda, Y., & Yamauchi, S. 2002, ApJS, 138, 19
- (22) Steeghs, D., Miller, J. M., Kaplan, D., & Rupen, M. 2003, ATel, 146
- (23) Ubertini, P., Lebrun, F., Di Cocco, G., et al. 2003, A&A, this issue
- (24) Verdrenne, G., Roques, J.-P., Schönfelder, V., et al. 2003, A&A, this issue
- (25) White, N. E., & Marshall, F. E. 1984, ApJ, 281, 354
- (26) Winkler, C., Courvoisier, T. J.-L., Di Cocco, G., et al. 2003, A&A, this issue
- (27) Wood, K., Share, G., Johnson, N., et al. 1977, IAU Circ., 3203
- (28) Wood, K. S., Meekins, J. F., Yentis, D. J., et al. 1984, ApJS, 56, 507