Heating cooling flows with jets
Abstract
Active galactic nuclei are clearly heating gas in ‘cooling flows’. The effectiveness and spatial distribution of the heating are controversial. We use three-dimensional simulations on adaptive grids to study the impact on a cooling flow of weak, subrelativistic jets. The simulations show cavities and vortex rings as in the observations. The cavities are fast-expanding dynamical objects rather than buoyant bubbles as previously modelled, but shocks still remain extremely hard to detect with X-rays. At late times the cavities turn into overdensities that strongly excite the cluster’s g-modes. These modes damp on a long timescale. Radial mixing is shown to be an important phenomenon, but the jets weaken the metallicity gradient only very near the centre. The central entropy density is modestly increased by the jets. We use a novel algorithm to impose the jets on the simulations.
keywords:
cooling flows – X-rays: galaxies: clusters – galaxies: jets – hydrodynamics1 Introduction
The arrival of data from the Chandra and XMM-Newton X-ray satellites has initiated a major change in our understanding of cooling flow systems. In particular, the new data have convinced many astronomers that these systems are powerfully influenced by AGN. Many aspects of this interaction are controversial, however, because the dynamics of the interaction between high-entropy plasma ejected by the AGN and the surrounding thermal plasma is complex. In particular, the interaction is inevitably time-dependent, chaotic and geometrically irregular. Numerical simulations are capable of giving us insights into the interaction and current thinking has been strongly influenced by the simulations of Churazov et al. (2001), Quilis et al. (2001), Brüggen & Kaiser (2001), Brüggen & Kaiser (2002), Brüggen et al. (2002), Reynolds et al. (2001, 2002), and Basson & Alexander (2003). In this paper we attempt to clarify the issues and to explore new territory with numerical simulations that are novel in several respects. Most crucially we present the first three-dimensional simulations that use an adaptive grid to simulate the entire cooling flow with significant spatial resolution at the centre. We draw attention to the possible importance of momentum input from the AGN for the dynamics of the cluster gas, and explore a part of the parameter space that is opened up once momentum input is considered.
In Section 2 we motivate our simulations by reviewing the history of cooling flows and the reasons why the new data have had a profound impact. We explain why simulations are essential for developing a sound understanding of the connection between a cooling flow and its embedded AGN. In Section 3 we motivate our phenomenological model of how an AGN impacts on its immediate surroundings. In Section 4 we introduce a new way to simulate jets that are embedded in a large-scale system. Section 5 describes a pair of simulations, and Section 6 compares these simulations with previously published ones. In Section 7 we discuss the implications of our work and what should be done next.
2 Cooling-flow history
The early X-ray satellites discovered that the deep gravitational potential wells of clusters of galaxies and luminous elliptical galaxies confine substantial masses of gas at the virial temperature (Forman et al., 1972; Bahcall & Bahcall, 1975; Mitchell et al., 1976; Serlemitsos et al., 1977; Forman et al., 1978; Abramopoulos & Ku, 1983; Jones & Forman, 1984). It was recognized that towards the centres of these systems the cooling time is shorter than the Hubble time (Silk, 1976). Motivated by this observation, Cowie & Binney (1977) modelled these systems under the assumption that they had achieved a steady state, in which gas seeped slowly inwards as it radiated energy. The early models did not explain what became of gas once it had cooled to below the virial temperature and out of the X-ray band, beyond arguing that isobaric cooling is thermally unstable, so at sufficiently small radii clouds of cold gas might be expected to form (Cowie & Binney, 1977). Fabian & Nulsen (1977) argued that these cold clouds gave rise to the H filaments that were observed in many cooling flows (Lynds, 1970; Cowie et al., 1983).
As the spatial resolution of the X-ray spectroscopy increased, it became clear that if the steady-state conjecture was valid, mass must be dropping out of the flow into cool clouds throughout the region of radius , where is the radius at which the cooling time equals the Hubble time. Nulsen (1986) introduced a theory of a multi-component intracluster medium (ICM) which allowed for such distributed ‘mass dropout’, and showed that the observed X-ray brightness profiles of cooling flows, which were less steep than the original steady-state models predicted, could be explained if the distribution in temperature of the gas at a given radius were suitably chosen.
A puzzling feature of models with distributed mass dropout was the failure of strenuous efforts to observe objects – ionized or neutral clouds, or young stars – that formed from the 10 to of dropout that the models predicted (Fabian, 1994). Ionized gas was detected early on (Lynds, 1970; Cowie et al., 1983), and molecular gas has been detected more recently (Donahue et al., 2000; Edge, 2001; Edge et al., 2002), but the mass of such matter falls short of predictions by a factor of at least ten, and it is more centrally concentrated than predicted. As the quality of the available spectra improved, the models’ predictions for the X-ray spectra also came into conflict with the data. In particular, the X-ray luminosity below , tended to be significantly smaller than predicted (Stewart et al., 1984b, a).
2.1 Cracks in the edifice
Soon after the tenth birthday of cooling-flow theory its intellectual foundations were shot away by two papers. Malagoli et al. (1987) showed that when gas at a range of specific entropies is confined by a potential well with specific entropy increasing outwards, the gas is not thermally unstable: a region in which the temperature is lower than ambient is under-buoyant and will sink and then oscillate around the radius at which the ambient medium has the same specific entropy. In principle, cooling causes these oscillations to be over-damped (Balbus & Soker, 1989; Tribble, 1989), but the growth rate is low and in a real system turbulent damping is likely to suppress the over-stability. In a second lethal attack on the steady-state cooling-flow model, Murray & Balbus (1992) showed that the differential equations that govern trapped cooling gas do not tend to a steady state. Rather, as the system evolves from a generic initial condition, the importance of partial derivatives with respect to time increases secularly because the size of is not of order over the age of the system, as Cowie & Binney (1977) and subsequent papers had implicitly argued, but , where is the time of a future cooling catastrophe, when the local density will diverge.
In view of these theoretical developments, a handful of theorists argued that a cooling flow is an unsteady response to heating by a galactic nucleus, the nuclear activity being episodically stimulated by the development of a cooling catastrophe in its environs (Tabor & Binney, 1993; Binney & Tabor, 1995; Binney, 1996; Ciotti & Ostriker, 1997; Binney, 1999; Ciotti & Ostriker, 2001). Unfortunately, the steady-state cooling-flow picture had by this stage developed such momentum that it could not be derailed by mere theoretical considerations. A variety of mechanisms was invoked to explain the conflict between the basic model and the new data. These included strong internal absorption (Allen & Fabian, 1997), magnetic locking of over-dense regions (Tribble, 1989; Balbus, 1991), abundance anomalies (Fabian et al., 2001; Morris & Fabian, 2003), and conduction of heat from large to small radii (Bertschinger & Meiksin, 1986; Narayan & Medvedev, 2001).
2.2 Decisive new data
The arrival of data from Chandra and XMM-Newton has finally turned the tide of opinion away from the distributed mass-dropout hypothesis. In particular, the new data show that internal absorption is not viable as an explanation of the paucity of flux below keV because it suppresses very soft photons that are observed in abundance (Böhringer et al., 2002). Moreover, spatially resolved spectra are incompatible with the predicted multiphase ICM: there is no evidence for plasma at more than one temperature at a given location (Tamura et al., 2001; Peterson et al., 2002). Within the cooling radius the temperature of the ICM is found to decline with decreasing radius, but has a floor value that varies from system to system. The floor almost always lies above keV, so the paucity of flux below keV simply reflects an absence of very cool gas, in clear conflict with the steady-state model. Kaiser & Binney (2003) have shown, by contrast, that if cooling flows are episodically heated, very cool gas will rarely be seen, because in any given system it appears only fleetingly and in small quantity.
In addition to completing the falsification of the mass-dropout model, the new data have provided morphological evidence for heating by AGN. It has long been recognized that cooling flows generally have embedded non-thermal radio sources (Fabbiano, Gioia & Trinchieri, 1989), but it used to be argued that there was no convincing evidence that these sources had a significant impact on their cooling flows (Allen et al., 2001; Fabian et al., 2001), even though the beautiful radio map of Virgo A by Owen et al. (2000) showed that in Virgo AGN-powered ultrarelativistic electrons densely permeate the region . Imaging data for several systems now show ‘cavities’ in the X-ray emitting plasma that coincide to some degree with peaks in the non-thermal radio emission (Böhringer et al., 1993; Churazov et al., 2000; McNamara et al., 2000, 2001; Blanton et al., 2001). The interpretation that the cavities are ‘bubbles’ inflated by radio sources in the thermal plasma, has gained currency (Churazov et al., 2001; Quilis et al., 2001; Brüggen & Kaiser, 2001, 2002; Brüggen et al., 2002). Consequently, it is now widely believed that cooling-flow gas is significantly affected by AGN.
3 Key Questions
Many fundamental questions regarding the nature of AGN/cooling-flow interaction remain to be answered. For example:
-
1.
Are the observed cavities inflated by ultrarelativistic jets or by sub-relativistic bipolar flows, or by a combination of the two? We shall see that the answer to this question has a strong bearing on the dynamics of the cavities: an ultrarelativistic jet carries very little momentum, so the cavities it inflates simply rise buoyantly, as in the simulations of Churazov et al. (2001), Quilis et al. (2001), Brüggen & Kaiser (2002) and others; a subrelativistic wind imparts momentum as well as energy to the cavity, which is thus driven up through the ambient gas, with implications for the stability and longevity of the cavity.
-
2.
How is the energy that we know lies within the observed cavities, transferred to the thermal X-ray emitting gas?
-
3.
Do the observed cavities in cooling flows such as those in Hydra and Perseus heat the systems fast enough to offset radiative cooling? While it is now clear that cooling flows are heated by AGN and that locally partial derivatives with respect to time are significant terms in the governing equations, it is not clear whether the azimuthally averaged profiles of flows are strongly time dependent. At one extreme Kaiser & Binney (2003) present a picture in which heating is unimportant for several hundred megayears between catastrophic AGN outbursts, and the radial density profile evolves significantly between outbursts. At the other extreme there is the possibility that the cores are in a turbulent steady-state in which azimuthally-averaged heating and cooling are in balance (Tabor & Binney, 1993).
-
4.
On what timescale does a cooling-flow settle to approximate hydrostatic equilibrium after a nuclear outburst?
-
5.
How visible in X-rays will be non-equilibrium structures, such as cavities and shocks, that the AGN generates?
-
6.
What is the radial distribution of injected energy after approximate hydrostatic equilibrium has been restored? This distribution effectively determines the predicted X-ray brightness profile and the time elapse between outbursts.
-
7.
What impact does AGN-induced radial mixing have on metallicity gradients? Is this impact compatible with models of metal enrichment and observed metallicity distributions?
-
8.
We must expect the outflow from the AGN to fluctuate on very short timescales. What observable phenomena will be generated by these fluctuations? A priori we expect the shortest timescale fluctuations to be evident at the smallest radii. What phenomena are expected at different radii, and what are the associated timescales?
- 9.
-
10.
Gas trapped in a potential well is likely to have non-zero angular momentum. As the gas cools, the dynamical importance of angular momentum is liable to increase – in proto-spiral galaxies it evidently becomes dominant. Radial stirring of gas by an AGN is liable to move angular momentum outwards and make it dynamically less important. How rapid is such angular-momentum transport? What impact does it have on the evident failure of giant elliptical galaxies to form disks recently (Emsellem et al., 2002)? and on the location of the molecular gas that has been found in cooling flows (Donahue et al., 2000; Edge, 2001; Edge et al., 2002)?
Since the interaction between an AGN and a cooling flow is inherently non-spherical and unsteady, simulations have a vital role to play in answering these questions. Several sets of simulations of AGN / cooling-flow interaction have appeared in the literature (Churazov et al., 2001; Quilis et al., 2001; Brüggen & Kaiser, 2001, 2002; Reynolds et al., 2001, 2002; Brüggen et al., 2002; Basson & Alexander, 2003). For reasons of computational cost, most published simulations assume spherical or axisymmetric symmetry or use a rather coarse spatial resolution. We present simulations that are fully three-dimensional and achieve competitive spatial resolution in a large box by exploiting adaptive grids.
3.1 Heating mechanism
Published simulations adopt a variety of approaches to the way in which the AGN transfers energy to its environs.
Ciotti & Ostriker (1997, 2001) consider inverse-Compton heating of the gas. This is an inefficient process since a photon of energy transfers to the gas a fraction of its energy, so even if the Thompson-Compton optical depth to the AGN is significant, radiation carries away most of the AGN’s output unless the spectrum of the radiation is hard. Moreover, for observed cooling flows the Thompson-Compton optical depth from infinity to radius is small down to the smallest radii (pc) that can be resolved in state-of-the-art simulations. Consequently, any inverse-Compton heating of the gas is likely to be concentrated at unresolved radii, and to impact on the simulated region by forcing an inflow across the simulation’s inner boundary. In this respect the inverse-Compton model is similar to the model on which we shall concentrate. The essential difference is that we shall assume a strongly bipolar outflow, whereas inverse-Compton heating might produce a nearly spherical flow at the inner boundary.
Our simulations assume that a cooling flow is primarily heated by a bipolar flow. This assumption is based on several considerations. First it is now generally accepted that AGN are powered by accretion onto a massive black hole. Bipolar outflows are observed around most accreting objects, be they forming stars (Arce & Goodman, 2002), accreting black holes that power AGN (Pounds et al., 2003) and micro-quasars (Mirabel & Rodriguez, 1999), or forming galaxies (Pettini et al., 2002). Hence, it is natural to expect a bipolar outflow to emerge from an AGN that is heating a cooling flow.
A second reason to believe that cooling flows are heated by bipolar flows follows from the observation (Fabian & Canizares, 1988) that the apparent luminosities of many galactic nuclei are several orders of magnitude smaller than is predicted by Bondi-Hoyle accretion onto the black holes that are known to reside there, given plausible lower limits on the central gas density in the cooling flow. The Advection Dominated Accretion Flow (ADAF) model of accretion onto black holes has been extensively explored as a way of explaining this surprising result (Ichimaru, 1977; Narayan & Yi, 1994). However, the basic physical premise of the ADAF model, that coulomb scattering is the dominant process for establishing equipartition between electrons and ions, is probably false (Binney, 2003). Blandford & Begelman (1999) propose an alternative to the ADAF model as an explanation of the low luminosities of galactic nuclei. In their ADIOS model most of the accretion energy that is released as plasma falls into the black hole is used to drive a wind from the surface of the accretion disk. Most of the gas that falls onto the outer edge of the accretion disk is carried by this wind away from the black hole, with the result that the hole’s accretion rate is much smaller than the disk’s accretion rate.
Our simulations assume that the ADIOS model correctly predicts that much of the energy released by accretion onto the black hole is channelled into a sub-relativistic bipolar flow. We emphasize that this flow is probably distinct from the highly relativistic flow that generates jets of synchrotron radiation in many well observed systems, such as M87. Key differences between the bipolar flow on which we focus and the underlying synchrotron jets include (i) the former is subrelativistic since material is blown off the accretion disk at the local Kepler speed, while superluminal motion and one-sidedness show the latter to have a Lorentz factor of several; (ii) the former will comprise an ordinary H/He gas, while the latter is quite possibly an e± plasma; (iii) the former is a direct and inevitable corollary of accretion while the latter probably draws its energy from the black hole’s spin via vacuum breakdown (Blandford & Znajek, 1977), and it may switch on and off in an erratic way.
The distinction between the bipolar flow from the disk and the one that generates synchrotron jets is important because the latter flow probably dominates radio maps at all radii through its superior ability to generate ultrarelativistic electrons. However, in many observed systems both flows are likely to be present simultaneously, so we should imagine the outflow to consist of a series of concentric cylinders (or cones in the case of non-negligible jet opening angle), each cylinder moving parallel to the axis at a speed that increases from on the outside to at the centre. Instabilities powered by the shear within this system will steadily transfer momentum and energy outwards, and cause ambient plasma to be entrained at the edge. A very basic point, but one that is often overlooked, is that the mechanical luminosity of the entire jet is orders of magnitude greater than the synchrotron luminosity. The ratio of these luminosities will be especially large if there is no ultrarelativistic jet at the core of the subrelativistic outflow.
Outflows with speeds and mechanical luminosities of order the Eddington luminosity are directly observed in spectra of accreting relativistic objects (Pounds et al., 2003). While these outflows are suggestive, they are not directly relevant to the systems of interest here because they are observed in objects with comparable photon luminosities and they may be radiatively driven (King & Pounds, 2003). It is likely that in very dense environments much of the accretion energy is degraded into photons, while in systems with very hot and therefore rarefied central gas, the accretion energy emerges in largely mechanical form.
4 Simulation technique
Even with the best current soft- and hard-ware it is impracticable to simulate flows from the sub-parsec scales on which jets form, out to beyond . In practice one must start at some smallest resolved scale , using a model of the jets on that scale that derives from a mixture of physical intuition and a critical examination of observed jets. From observations and modelling of jet evolution at , one hopes to infer the structure that the jets must have on much smaller scales if they are to have the inferred structure of scales and above.
4.1 Generating jets
On a given scale, a jet is characterized by the rates , and at which it injects mass, momentum and energy into the larger-scale plasma. If the characteristic speed of flow within the jet, , is subrelativistic, these three numbers are clearly related by and , where is the specific internal energy of the jet material. So long as the jet is highly supersonic, . Entrainment causes to rise and to decline as one proceeds down the jet, such that remains approximately constant. Entrainment leads to an increase in relative to the kinetic contribution to , while radiative cooling causes to decrease.
Our simulations employ the three-dimensional adaptive-mesh hydrocode ENZO (Bryan & Norman, 1997) with a Piecewise Parabolic Method (PPM) Riemann solver (Colella & Woodward, 1984). The refinements are dynamically generated based on the density gradient down to 6 levels of refinement, with an effective resolution of cells. The computational box is on a side, and as a result the central is covered by cells measuring . Periodic boundary conditions are enforced.
We simulate the action of a pair of sub-grid jets by adding mass, -momentum and energy to cells that lie within the plane at , where . During a timestep of length , the injected mass is distributed over cells that lie in a thin disk according to the window function
| (1) |
Here is the distance of the cell from the -axis and . The injected momentum and energy are distributed in the same manner. We present results for two values of , namely 2 and to illustrate the effect of changing this parameter. The cross-sectional area of the jet at the highest resolution is resolved into () cells for the () case.
The first increments in the dynamical variables after a jet is switched on increase the mean velocity of material in a disk cell only very slightly because the injected momentum has to be shared with a substantial quantity of stationary gas. Consequently, little of the injected energy is tied up in the kinetic energy of the cell. Hence, nearly all the injected energy is used to heat the gas that was originally in the cell, and this gas expands in response. The resulting decline in the density of gas in disk cells causes subsequent momentum increments to yield ever larger bulk velocities for disk cells, and gradually a significant fraction of the injected energy goes into bulk kinetic energy.
From this discussion it will be seen that the speed that characterizes the ratio of the increments in momentum and energy, controls the relative importance of heating, which tends to expand the nuclear gas isotropically, and bulk motion, which generates bipolarity within the cooling flow. In this paper we restrict ourselves to simulations in which and , which corresponds to a total power for two jets. The jets remain powered for so that they inject in total. We shall explore the effects of changing the jet power in a later paper. The low value of adopted here contrasts with the much higher jet velocities () studied in Reynolds et al. (2001, 2002) and Basson & Alexander (2003).
Our approach to jet simulation avoids the imposition of boundary conditions at points internal to the simulation. It involves adding source terms for each cell to generate the appropriate , , and . Given these, the code computes increments in the internal energy . Neither the temperature nor the density at the base of the jet is hard-wired; they evolve as natural consequences of , , and . Our approach guarantees a gradual dynamical response to the jets being either turned on or off.
The power of our jets is smaller than the X-ray luminosities of the cluster that we model ( (David et al., 2000)), so jets of this power could significantly modify the cooling flow only if they were active for much of the time. It seems likely that jet activity is intermittent, and our goal in this paper is to understand the impact of a single outburst. The relevant dynamical timescale of the cluster gas turns out to be quite long (see below), so the dynamical impact of an outburst is evident more than a gigayear after the jets have switched off. By contrast, in the absence of a further outburst, the core will proceed to a cooling catastrophe within (e.g. Kaiser & Binney (2003)). Hence if we are to understand the impact of a single outburst, we must suppress radiative cooling. We reserve to a later paper simulations that include radiative cooling and repeated outbursts.
4.2 The cluster model

The background that is disturbed by the jets is based on Chandra observations of the Hydra cluster by David et al. (2000). The gravitational potential is that of the NFW model that David et al. fitted to their data. From this potential we calculated electron densities for an isothermal distribution of plasma, and chose the temperature K that provides the best fit to the electron density that David et al. inferred. The equations of motion were integrated for before the jets were switched on to ensure that the system was not far from numerical equilibrium when the jets were ignited. The jets fired for before turning off, and the subsequent evolution was followed for .


The jets deform the initially spherical surfaces of constant specific entropy. After the jets have turned off, the surfaces of constant specific entropy are expected to wiggle in and out with a characteristic period that increases from small radii to large. The period of these oscillations are of order , where the Brunt-Vaisala frequency is given by
| (2) |
where is the gravitational potential and is the entropy index. In Fig. 1 we plot as a function of radius in our initial model of the Hydra cluster. The period rises from at the origin to at . Hence the period is everywhere longer than the likely lifetime of a jet.
5 Results
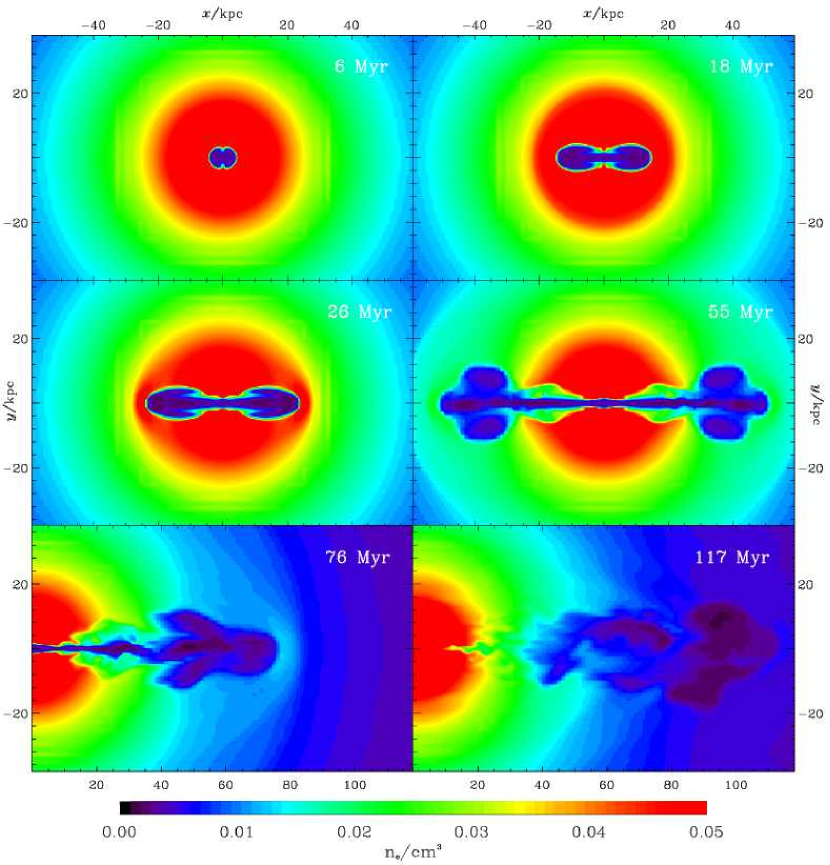
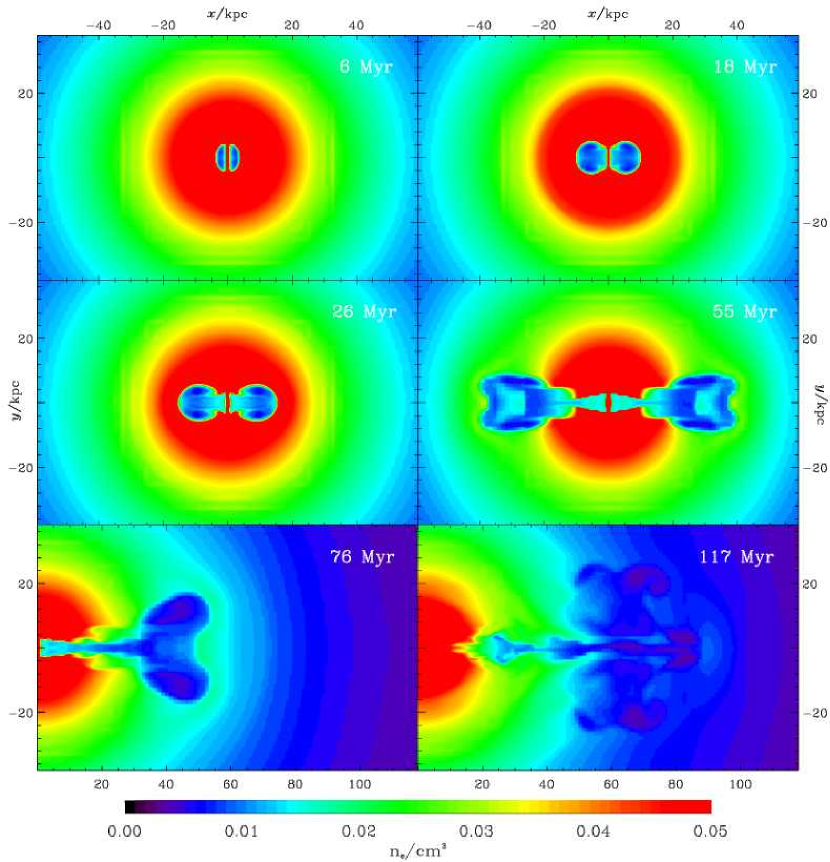
Fig. 2 describes the process of jet formation once mass, momentum and energy start being injected into the disk by plotting the temperature and -velocity on the jet axis at , and from the cluster centre. The upper full curves show that the temperature at rises steeply to a sharp peak as injection starts. The temperature then fluctuates before settling to a plateau that lies above in the case of the narrower jet, and slightly below in the wider case. The dotted curves in the temperature panels show that after a delay this process is repeated at slightly lower temperatures at . The full curves for the -velocity in Fig. 2 show that at the velocity rises slightly less rapidly than the temperature before falling and levelling off at a plateau for the narrow jet, and for the wider one. Since the speed of sound in the ambient medium is , the corresponding Mach numbers with respect to the ambient medium are and . The jets’ internal Mach numbers are much less than unity. For both jets the peak velocities are larger at than at . In light of the lower temperatures at , this suggests that between these two points the jet has narrowed and accelerated as in a nozzle. Thus these are pressure-confined jets such as are thought to exist in low-power (FR I) radio galaxies, rather than the ballistic jets of FR II sources.
The dot-dashed curves in Fig. 2 show similar trends at except that (i) the impact of the jet is delayed by , and (ii) the temperature attains much smaller peak values. The lower temperatures again suggests adiabatic expansion. The pressure at a given radius should be approximately time-independent since it is determined by the ambient cooling flow. Hence, in the absence of entrainment, the Bernoulli function of each fluid element would be conserved. Actually the decrease in is not associated with a corresponding increase in velocity, so entrainment probably is important. Direct measurements of mass flux at various radii confirm this inference. At all three locations both temperature and velocity drop precipitately soon after injection ceases. Interestingly, the delay between the velocity dropping from location to location is smaller than the corresponding delay that accompanied jet ignition. Thus it takes only for the jet channel to fill up out to , compared to the required to cut the channel that far.
The fact that the plateau velocities at in Fig. 2 are substantially smaller than reflects the importance of entrainment at the base of the jet. Near the plane , gas is sucked in towards the axis, flows through the injection disks, and is then blasted out along the axis. This flow diminishes the final jet velocity in two ways: (i) it diminishes the pressure just behind the injection disk, which tends to throttle the flow; (ii) it causes the momentum injected on the disk to be shared by a larger quantity of gas. The flow induced through the back of the injection disk is larger in the case of the wider jet, because the area of its disk is times that of the narrower disk. In fact, the plateau velocity of the wider jet is smaller than that of the narrow jet by a very similar factor, . The detail of this entrainment process is highly artificial, but the general physical principle is sound: gas will be entrained by a jet that has propagated out from the AGN to the radius at which we have placed our injection disks. By measuring the flux of gas at we find that the jet entrains at its base, while the jet entrains .
Fig. 3 shows for five times electron density and -velocity along a cross-sections through the jets at . (The density fields in a two dimensional plane at these times are depicted in Figs. 4 and 5.) The upper panels in Fig. 3 show that by , injection has drastically lowered the density on the axis, by a factor in the case and by a factor in the case of the wider jet. The situation at is more complex: in the narrower jet the density is already low out to of the jet axis, but it is slightly raised in the region beyond 4 kpc by the jet-driven flow of material away from the centre; at this early time the wider jet has yet to reach so the density lies above its original value throughout the cross section and, at , the velocity is still subsonic. At the narrower jet is highly supersonic (with respect to the ambient medium; ) and shows a significant backflow in the region , with speeds up to . The wider jet develops a backflow later at , and in both cases the backflow region moves away from at later times. It is interesting that both the density and velocity plots show that the jets become narrower with time. This fact reflects the movement downstream of the backflow region and suggests that the artificial shear viscosity in ENZO is rather small. The velocity profiles for and show quite wide wings either side of the narrowing core. Although the velocities associated with these wings are modest, the corresponding net momentum is a significant fraction of the jet’s momentum because the areas and densities associated with the wings are large. Indeed, the directly measured mass flux in the region of either jet reveals a further mass loading of .
Figs. 4 and 5 show the density field in a two dimensional plane () at the same six times for the and jets, respectively. At the first time shown, i.e. after the jets were turned on, two lunes of low density can be seen, one on each side of the injection disk. These lunes rapidly swell parallel to the axis and develop internal structure that makes them resemble mushrooms, those for the wider jet being shorter and plumper. By more complex structures have developed that differ significantly between the jets: the narrower jet has a butterfly-shaped cavity about long that has its head about from the origin and a wide tail around a long straight section of jet that reaches back to the origin. By contrast, the cavity generated by the wider jet extends only to along the axis and is shaped rather like a red pepper. A shorter, wider jet leads back from this structure to the origin. The structures seen at show similar differences between the two jets. At , after the jets turned off, the channels along which the jets ran are rapidly filling near the origin and the outer structures are becoming more turbulent. The heads of the cavities continue to plough outwards. About after the jets have turned off (not shown) the outward crashing structures undergo a fundamental change: a stream of colder than ambient gas surges up from behind the cavity, largely filling it and bursting out of its leading edge. In this way the cavities turn into overdensities.
In the snapshot of the jet we see that the flow is disturbed in the region , where the jet no longer follows a linear path. This is a highly turbulent region with strong internal shocks that disrupts the jet stem and almost separates it from the established cavity. There is no analogous feature in the jet, but do we find that such features play an important role in simulations with faster jets.
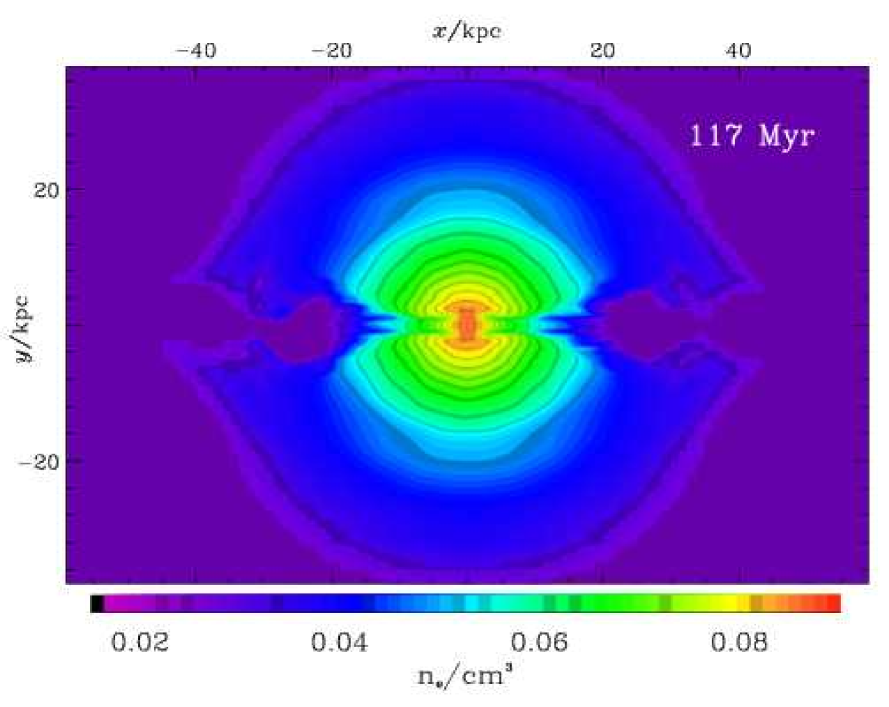
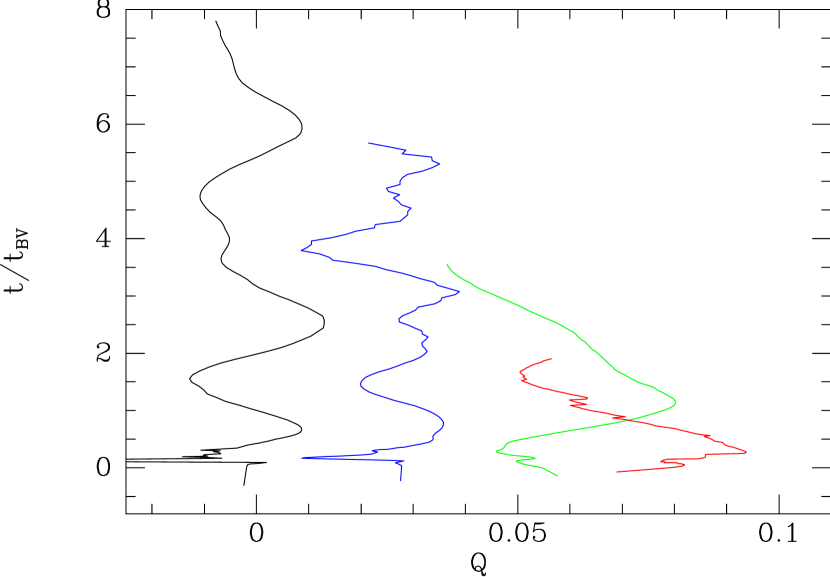
Fig. 6, which is a centered view of the cluster core at , shows that the equidensity surfaces remain markedly aspherical some time after the stem has retreated from a given radius. They soon after become roughly elliptical and distort under radial oscillations that are analogous to the g-modes of a star. Fig. 7 quantifies the relaxation of the equal-entropy surfaces by plotting as a function of scaled time , where is the local Brunt Vaisala time from Fig. 1, the quadrupole moment of the entropy distribution
| (3) |
where is colatitude with respect to the jet axis and is the average value of the entropy index on a sphere of radius . At and a large excursion in is evident as the jet first impacts, followed by an oscillation pattern that looks like an interference pattern between the first few harmonics with fundamental period comparable to . At and very few cycles are seen even though the baseline in time extends to .
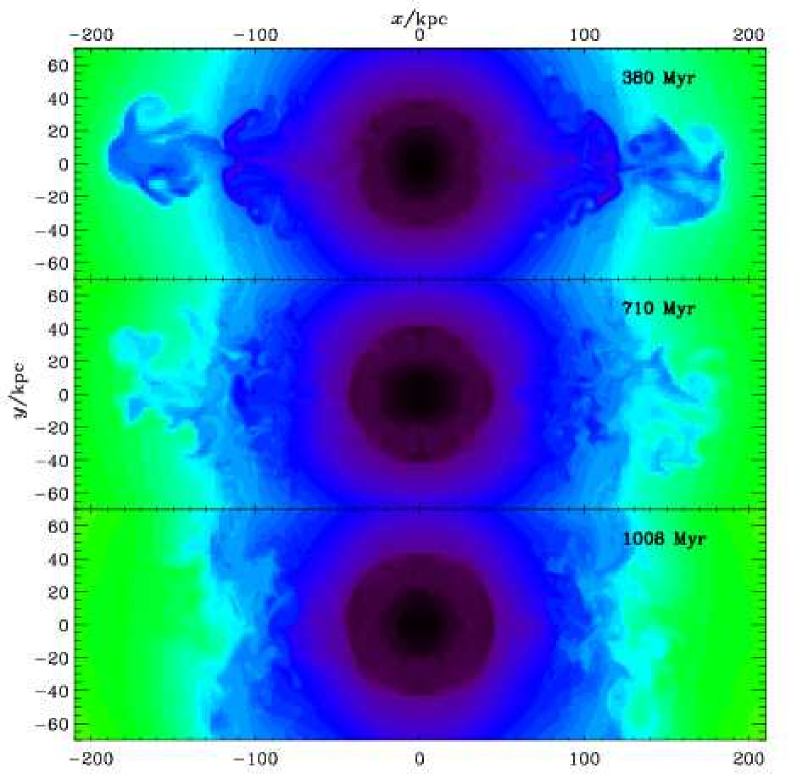
Fig. 8 shows the entropy field for the jet at three late times. The panel for shows the flow after the cavities have transformed into over-densities. In the panel for we see that around overdense material has fallen back and indented the otherwise fairly smooth isoentropy surfaces at that radius. In the bottom panel we see the same process happening further out at . This outward-moving wave of material falling back strongly excites the system’s g-modes.


ENZO follows the density of several dyes, each one of which moves with the main fluid according to the usual continuity equation. This facility enables us to explore the extent to which an outburst moves material radially. The full curves in Fig. 9 show the distribution at six times of a dye that was initially distributed like the gas density interior to , and had zero density outside this ‘inner core’ volume. Data for the narrower jet are on the left. The dashed curves show the distribution of a second ‘outer core’ dye, which was initially distributed like the gas density in the radial range and had zero density elsewhere. The upper middle panel for the narrower jet in Fig. 9 shows that after the jet turns on, a significant amount of inner-core dye has moved out to the range ; the next panel shows that when the jet turns off, the inner core material extends out to . The lower panels show that after the jet has died, inner core material is carried out to before falling back slightly in the last part of the simulation. Similar effects are evident in the right panels for the jet, the main difference being that this wider jet ejects essentially all rather than most of the inner core material.
The dashed curves in Fig. 9 show that the jet has a less dramatic impact on the outer-core material. Nevertheless, in the left panels we see that outer-core material is pushed out to beyond , mostly after the jet has switched off. Moreover, by the end of the simulation with , sufficient outer-core material has flowed in to the inner-core region for the densities of the two fluids to be essentially equal at the centre, with the density of the outer-core material declining much more slowly with radius than that of the inner-core material. The equality of the central densities is masked in Fig. 9 by the difference in the adopted mass scales. The ability of the wider jet to displace most of the inner core gas while affecting the outer core gas only about as much as the narrower jet does, is consistent with the conclusion we reached from Fig. 3 that the main difference between the two jets lies in the different quantities of plasma that they entrain near the injection discs.
Fig. 10 shows the evolution of the metallicity of the IGM. This was followed by distributing a dye in the initial configuration with a density that is proportional to a power of the main plasma density, with the power chosen such that the ‘metallicity’ declines by a factor 10 between and . The upper set of four curves, which shows the spherically averaged metallicity density for the simulation with the narrower jet, shows that the expulsion of inner-core material weakens the central metallicity gradient slightly, but does not eliminate it. The wider jet causes the central metallicity to decline slightly more: to 0.857 rather than 0.888 of its original value. Naturally changes in metallicity are largest along the line of the jets. The lower set of curves in Fig. 10 shows as a function of distance down the jet axis the metallicity an observer would measure along the jet if the cluster were oriented such that the jets lie in the plane of the sky. The original metallicity gradient is smaller than that obtained by spherical averaging. Also at the metallicity is clearly seen to be enhanced by uplift of material from the core.

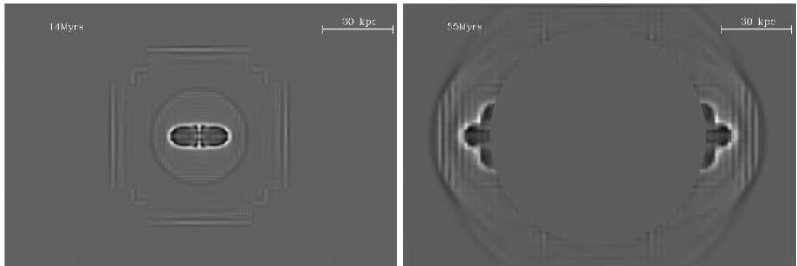
The top row of Fig. 11 shows the divergence of the velocity field in the plane at and after ignition of the jet. At the first time shown we can see the injection disks and, nearly connected to them, a network of bright regions that roughly mark the boundaries of the mushrooms we encountered in the density field. Further out a circle of brightness delineates the bow shock as it advances into the undisturbed IGM. At the divergence field is more complex, on account of the emergence of internal shocks within the jets. A pair of wedges mark the interface between ejected material and the disturbed IGM and a little further out a bow shock appears as two sectors of a circle. The original quasi-spherical shock is too weak to see in this plot, but the unsharp-masked X-ray image at bottom right reveals it at about 10 o’clock and 2 o’clock. At 3 o’clock the jet’s bow shock has just penetrated the spherical locus of the original shock. The distance between the jet head and the original shock has not increased between and , so the head is moving supersonically – from Fig. 4 we find that the jet head moves in the from , so its average speed is a factor times the sound speed at .
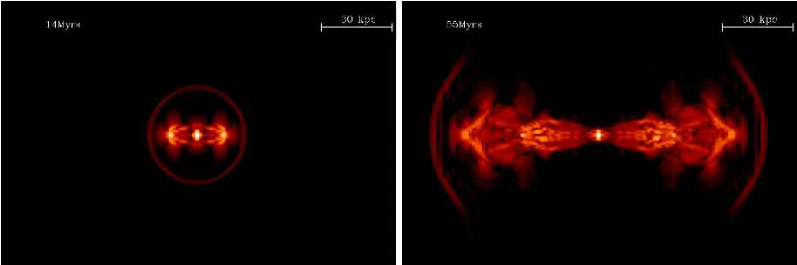
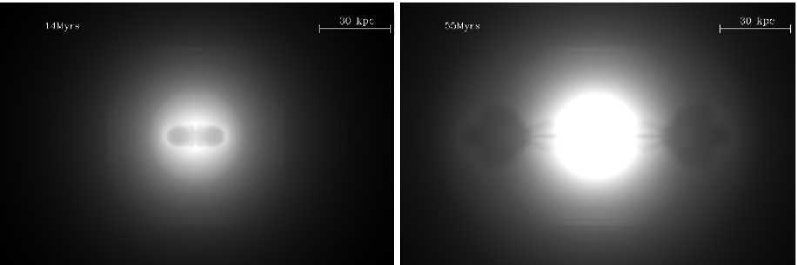
The middle row in Fig. 11 shows the X-ray emissivity projected along the axis at the times of the top panels. The shocks that are clearly evident in the top panels are invisible in the X-ray data. The bottom panels show unsharp-masked versions of the middle panels. In these images the shocks are evident. Recently Fabian et al. (2003a) have unsharp masked a very long exposure of the Perseus cluster and detected numerous weak arc-like regions of enhanced density gradient that are similar to those seen in Fig. 11.
The right-hand panels in the middle and lower rows of Fig. 11 show X-ray cavities that are very similar to those observed in Hydra, Perseus and other clusters (Böhringer et al., 1993; McNamara et al., 2000; Fabian et al., 2000; Heinz et al., 2002; Blanton, Sarazin & McNamara, 2003). The cavities in our simulations are slightly edge brightened, but rather less so than are the observed cavities because the material at the edge is not cooler than ambient. In part this will be because we start with an isothermal temperature profile rather than one that drops near the centre. It may also be the case that in a realistic cluster environment the jets plough into dense material dredged up by a previous jet. This would produce a bow shock comprised of denser material, which would shine more brightly in X-rays. It is therefore important to extend these simulations to include multiple jet eruptions (Soker et al., 2002).


Fig. 12 shows the overall impact that the jet has on the system by comparing the radial run of mass at four times for the narrower jet (the corresponding plots for the wider jet are similar). The upper panel shows the radius within which mass lies. This increases slightly at the centre. The lower panel shows this increase in more detail by showing the ratio of the radius that contains at time to the radius that originally contained the same mass. Near the centre, is percent bigger than so long as the jet is powered. Further out a wave of increase in can be seen propagating out while the jet is on. By after the jet is switched off, is larger than by percent at all radii.
We have seen that the jet transports cool material from the centre and deposits it at large radii. Hence an increase in at fixed does not necessarily mean that a physical shell of material moves outwards; the shell may in fact move inwards but its decrease in be more than compensated by the decrease in its mass coordinate .
Fig. 13 shows the distribution of binding energy per unit mass as a function of mass at four times scaled such that the area under the curves is total binding energy in units of . Thus the injection of by the jets has the effect of shifting the mean level of the curves vertically by only in the units of the vertical axis. The lower panel shows the difference in the binding energy per unit mass at each enclosed mass between the given time and the moment before jet ignition. Heating by the jet reduces binding energy and thus lowers the curves. Around we see a pronounced dip in the curve for . There is a corresponding dip in the curve for around . This increase in the radius of the dip reflects outward propagation of energy. The decline on the extreme right in the curve for implies that by this time the extra energy has migrated to the highest mass shells included in the figure, which lie near , approximately the cooling radius in this cluster (David et al., 2000).
Consider the effect of uplift of cold gas on a physical shell of matter that lies between the radii from which the jet takes and then dumps cold gas. If the shell is not directly disturbed by the jet, its energy will be constant, but the value of its mass coordinate will decrease. Since in the original configuration specific binding energy decreases with increasing , the decrease in will have the effect of decreasing at given . Hence in Fig. 13 uplift has the same effect as a distributed source of heat that acts between the radii between which the jet transports material.
The areas under the curves of the lower panel should equal the energy injected up to each time and thus provide valuable checks on the accuracy of the simulation. The area under the full curve should be 9.4 and is 9.45, while the area under the other two curves should be 20 and is 22.6 for and 11.4 for . Extremely similar values are obtained for the jet with . In view of the smallness of the energy injected relative to the total energy, the agreement between the expected and measured values at the first two times is satisfactory. The shape of the dashed curve in Fig. 13 suggests that the discrepancy at the third time arises because the integration has not been carried out to sufficiently large enclosed masses – the outermost mass shell included lies at . Thus this figure indicates that the energy injected by the jet ends near the cooling radius. A simple calculation explains why this is so. We have seen that the jet blows a cavity that travels at close to the sound speed and remains an underdensity for about twice as long as the jet fires. Hence the radius at which it becomes an overdensity and deposits its energy is for our choice . If heating is to make good radiative losses, the heating action of the jet needs to be concentrated at rather smaller radii. Thus our assumed jet lifetime is likely to be too large by a factor of a few. Since the size and energy content of the cavities we generate are realistic, any decrease in should be compensated by an increase in jet power.
Fig. 14 shows the variation with enclosed mass of the entropy index in the case of the narrower jet. A prompt increase in the entropy density at is evident. Subsequently, the entropy density decreases in this zone, but remains above its initial value. However, around the entropy index at drops slightly below its initial value. This depression is associated with an enhancement in binding energy that is clearly visible towards the left-hand edge of Fig. 13. From Fig. 12 we see that the corresponding radial coordinate is , which Fig. 11 shows to be the extent down the axis of a grid boundary. Consequently, there has to be a suspicion that this feature is a numerical artifact.
6 comparison with other work
Churazov et al. (2001), Quilis et al. (2001), Brüggen & Kaiser (2001), Brüggen et al. (2002) and Brüggen & Kaiser (2002) injected energy only, whereas we have injected both energy and momentum. Moreover, with the exception of Quilis et al. (2001) these authors simulate only a part of the cluster that varies in scale from the volume of Brüggen et al. (2002) to a hemisphere of radius of Brüggen & Kaiser (2001). Only the simulations of Quilis et al. (2001) and Brüggen et al. (2002) are fully three-dimensional, and only Brüggen & Kaiser (2002) had an adaptive grid: unfortunately, this two-dimensional simulation had slab rather than rotational symmetry. In all these simulations energy was injected at a fixed point that is significantly removed from the cluster centre without any physical motivation for its location.
The presence of the bow shock (see Fig. 11) and of the strong turbulence in the ejected material underlines the difference between our model and models in which ‘bubbles’ of plasma buoyantly rise up in a quasi-stationary manner (Churazov et al., 2001; Quilis et al., 2001; Brüggen & Kaiser, 2001, 2002; Brüggen et al., 2002). Outward motion of the point at which the jet’s energy is thermalized is clearly important for the dynamics of cavities in our simulations, and missing from most early discussions of bubble dynamics.
Two groups have simulated the impact of jets on cooling flows (Reynolds et al., 2001, 2002; Basson & Alexander, 2003). Both groups employed a version of the ZEUS code on a single spherical grid that excluded a sphere around the origin. In the case of Reynolds et al., the radius of this sphere was 1 percent of that () of the outer boundary sphere, while in the simulations of Basson & Alexander the ratio of these radii was percent and the outer bounding radius was . Our computational domain is on a side and includes the origin. In these simulation the PPM Riemann solver was employed, while ZEUS uses artificial viscosity to simulate shocks.
While Reynolds et al. forced axisymmetry, the simulations of Basson & Alexander were fully three-dimensiional. In both simulations the jets were imposed as conical inflows through inner boundary. The jets were faster and more powerful than ours: they emerged from the inner sphere at a speed of and a density 100 times lower than the ambient density. In the simulations of Reynolds et al. the net jet power was . We estimate the power of the jets of Basson & Alexander to be . Hence, in both simulations the jets are more powerful than ours by at least a factor 150 to 400. The rate of mass injection was just to times ours. Thus the jets were significantly less heavily loaded with momentum than ours, yet there was enough momentum for the head, at which energy was randomized, to move out through the cluster, rather than remaining stuck at an arbitrarily chosen point, as in earlier work.
An important difference between the Reynolds et al. simulations and ours is that in their simulations, the backflows extended all the way to the origin for the lifetime of the jet, whereas in our simulations the backflow region moves away from the origin at some distance from the head of the jet. This difference is a natural consequence of the different momentum loadings of the two jets since a higher ratio of momentum to energy increases the speed of advance of the head relative to the speed of the backflow.
A second notable difference between the simulations is in the temporal and spatial scales of the outbursts. In the Reynolds et al. simulations, the cavities created by the jets have still not been overtaken by uplifted cold material at 15 times the lifetime () of the jets, by which time the cavities are from the centre. Thus in these simulations the AGN has a major impact to the edge of the cluster. A similar situation is evident in Fig. 1 of Basson & Alexander. The observations suggest that the AGN’s impact should lie primarily within the cooling radius and in future work we plan to concentrate on the part of parameter space in which this is so. The high-power outbursts simulated by Reynolds et al. and Basson & Alexander clearly do not have promising parameters from this point of view.
7 discussion
It is now clear that AGN have a significant impact on cooling flows. The largest question that remains unresolved is whether the best observed systems are in an approximate steady state, or are cycling between configurations that have significantly different central density profiles and temperatures. Another important issue is whether the observed cavities are driven outwards by momentum-laden jets, or simply rise buoyantly. We have argued that the low luminosities of black holes embedded in X-ray emitting gas, coupled with the implausibility of the ADAF model, support the conjecture of Blandford & Begelman (1999) that a subrelativistic bipolar flow is the primary output channel of these black holes. This conclusion amounts to a prima facie case for momentum driving. Our simulations explore the regime of strong momentum driving, and provide a counterpoint to simulations in which energy alone is released at some point in the flow.
We have modelled the impact on a cooling flow similar to that in the Hydra cluster, of an outburst by an AGN that lasts and has mechanical power delivered by opposing jets. The jet power is smaller than the X-ray luminosity of the Hydra cluster, so to achieve a quasi-steady state a series of more powerful outbursts would have to follow one another. We have sought to gain physical insight into the overall response of the cooling flow to energy input by jets by suppressing both subsequent outbursts and radiative cooling.
The jets are created within the simulation by an algorithm that avoids the imposition of any boundary conditions near the cluster centre. The speed and early development of the jets depends on the width of the base of the jets because wider jets entrain more ambient material at their base. The gross features of jet action are independent of the assumed jet width, however. Cavities of very hot plasma grow around the heads of the jets, and these move supersonically outwards. Ahead of the cavities run two cap-like bow shocks, one over each jet head, which eventually overtake the weakening spherical shock front that is generated as the jets ignite. The cavities, which advance supersonically, are evident in simulated raw X-ray images, but the bow shocks can only be detected in the X-ray data when they are unsharp-masked.
A turbulent vortex that contains a significant quantity of entrained and uplifted material trails each cavity. After the jet has turned off the cavity weakens and slows relative to the denser vortex. About after the jet turned off, the vortex fills and overtakes the cavity, which is thus replaced by a region of outward-moving, cool, overdense gas. Eventually this over-density falls back inwards. Many studies (e.g. Alexander (2002) and references therein) have pointed out that an AGN outburst will lift significant quantities of low-entropy material out of the cluster core. However, they have discussed this process in the context of shock-acceleration of material ahead of a rising cavity. It is not clear that shock-acceleration causes the dense following vortex that we see; this structure is probably a part of the global circulation pattern that the jets excite, in which gas flows in perpendicular to the jet axis and out parallel to the axis.
We have used dyes to assess the importance of turbulent mixing. Much or most of the material that was originally in an inner core of radius is ejected to radii as large as . Material that originally lay between and moves in part inward to replace the ejected inner-core material, and in part outwards. Most stays put, with the result that an original metallicity gradient in the IGM is only slightly weakened.
There is a small overall inflation of the IGM: while the jets are still firing, the radius at a given value of the mass coordinate increases by percent within a few kiloparsecs of the centre. The long-term increase in radius of material within is only of order a percent. The entropy index of the innermost increases by up to a few percent. Most of the energy injected by the jets ends up around the cooling radius or beyond because the distance that the cavities move is of order . Heating could more readily offset cooling if a smaller value of and a larger value of the jet power were used.
We now return to the questions posed in Section 3:
-
1.
The outflow from an accreting black hole must carry momentum as well as energy. Most previous studies have neglected the momentum flux because they have been directed at the effects of ultrarelativistic jets, that probably consist of a very light electron-positron plasma. We have stressed the likelihood that any such jet lies at the core of a massive, subrelativistic bipolar flow that comes from the accretion torus rather than the black hole’s ergosphere. Our assumption of a non-negligible momentum flux enables our simulations to be self-consistent in a way that the energy-only simulations are not: in our simulations the point at which the jet’s ordered kinetic energy is randomized is self-consistently determined, whereas in the simulations of Brüggen & Kaiser (2002) and others the point at which energy is injected is arbitrarily chosen. Moreover, cavities that are pushed out into the ambient medium are more stable than ones that merely rise buoyantly and we tentatively infer from the morphology of the Virgo A radio source that the data favour stable cavities. Specifically, Fig. 15 shows that a feature in the radio-continuum map of Virgo A in Owen et al. (2000) closely resembles a feature in one of our simulations. This resemblance cannot count as hard evidence for momentum driving because the quantities plotted in the two cases are very different. But our impression is that no feature in the energy-only simulations so closely resembles the observed feature because the simulated features are too prone to fragmentation.
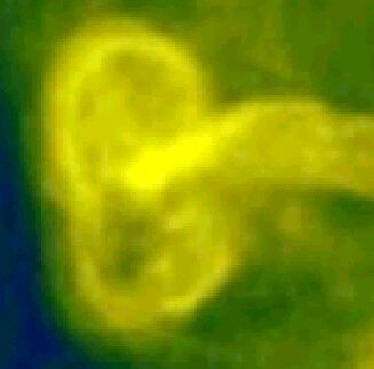
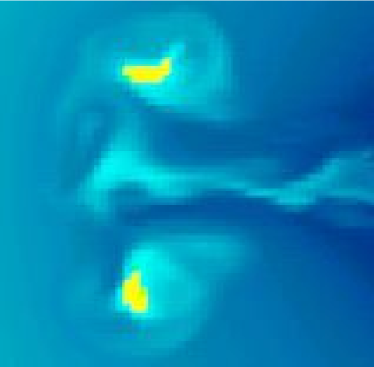
Figure 15: Left: a piece of the radio-continuum map of Virgo A by (Owen et al., 2000). Right: a piece of the map of specific entropy in the plane from one of our simulations. -
2.
The jet’s energy offsets the effects of radiative cooling in several ways: 1) gas at the very centre is pushed up high, where it mixes in with higher-entropy material and is heated by dissipation of the system’s strongly excited g-modes; 2) gas slightly further out is first shock heated and then adiabatically compressed as it sinks inward to take up the volume vacated by ejected gas; 3) gas at all radii is heated by being turbulently mixed with the extremely hot shocked jet material; 4) the radio map of Owen et al. (2000) strongly suggests that in Virgo shocked jet material is distributed throughout the inner . If the jet consisted primarily of ultrarelativistic material, it would not follow that the thermal plasma had gained significant heat from the jet because the coupling between ultrarelativistic particles and thermal plasma is weak. If we accept the likelihood that the observed ultrarelativistic jet is sheathed in a subrelativistic wind, it does follow from the radio map that turbulent mixing will have heated the thermal plasma within of the cluster centre.
-
3.
The rate of jet heating can be estimated as the energy within the observed cavities, divided by cavity lifetime . Our conclusion that cavities survive for about twice the time it takes to inflate them is consistent with the observation of two pairs of cavities in clusters such as Perseus, one pair being radio bright and the other a pair of ghost cavities. Since cavities move at the speed of sound, we can determine their lifetimes from how far out we find them. For Perseus we thus infer , and a heating rate per -radius cavity. This is close to but less than the X-ray luminosity from within the cooling radius. So are cooling flows in steady states? We think not. First, it is unlikely that the black hole’s output can be closely matched to the radiative cooling rate because the characteristic timescales of the black hole and the cooling flow are so discrepant. Second, as Motl et al. (2003) and Kay et al. (2003) have stressed, clusters experience substantial infall of gas, and a significant quantity almost certainly reaches the centre without being shock heated to the virial temperature. It is likely that the gas observed in molecular form (Donahue et al., 2000; Edge, 2001; Edge et al., 2002) and as H-emitting filaments (Lynds, 1970; Cowie et al., 1983; Conselice et al., 2001) is just such gas rather than gas that has cooled in the flow: as Sparks, Macchetto & Golombek (1989) have stressed, dust in the filaments would be unlikely to have perfectly normal Galactic extinction properties if the gas had condensed from the hot phase. Moreover, the filaments would not have their highly disturbed morphology if they had condensed from the flow. X-ray data from Chandra show that the cold gas is in thermal contact with the X-ray emitting plasma (Fabian et al., 2003b), and it is probably being evaporated by the latter. If so, this activity will be a significant drain on the energy resources of the cluster gas, making it likely that, notwithstanding current AGN heating, clusters such as Perseus are drifting towards a cooling catastrophe.
-
4.
After an outburst, hydrostatic equilibrium is approached after several Brunt–Vaisala times. From Fig.1 we see that this timescale is very long, being at and still larger further out. Consequently cooling-flow clusters should show significant deviations from hydrostatic equilibrium at most radii, and several different AGN outbursts will have an impact at the current time.
-
5.
Raw X-ray images are expected to show cavities but not shocks, even though the cavities move supersonically. If X-ray data of exceptionally high signal-to-noise are available, unsharp-masking will reveal the shocks. Cavities live for about twice as long as the jet that inflates them, so there should be 2–4 cavities visible at any given time. We do not simulate the production of synchrotron-emitting electrons, but in view of the short lifetimes of these particles ( for Lorentz factors ), one would not expect cavities to be bright synchrotron sources for long after their parent jet died. Hence our simulations suggest that a significant fraction of cavities should be radio-invisible ‘ghost’ cavities.
-
6.
Although Fig. 14 shows that the specific entropy of matter at the centre is increased by the AGN, Fig. 13 suggests that most of the energy injected by an outburst ends up near or beyond the cooling radius. This result follows from the facts 1) that much of the jet’s energy goes into inflating a cavity which moves mildly supersonically, and 2) that we have assumed that the jet fires for and find that the cavity survives for a further after the jet expires. Travelling at for , the cavity moves out to before depositing its energy.
If one accepts that averaged over gigayear times, heating by AGN offsets radiative cooling, then the heating ought to be concentrated well within the cooling radius, which is in the Hydra cluster (David et al., 2000). Moreover, Owen et al. (2000) find that in Virgo the synchrotron emission has a sharp outer boundary at percent of the cooling radius. This observation suggests that in Virgo no cavity has reached the cooling radius, and Soker et al. (2002) remark that observed radio jets do not propoagate to large distances in cooling-flow clusters. We tentatively conclude that in our simulations the cavities move to unrealistically large radii. This deficiency would be resolved by halving the lifetime of the outburst. Since the energy in our cavities is about right, this halving of the lifetime would have to be offset by a doubling of the jet power.
-
7.
A crude picture of the impact of jets on the ICM is that the jets entrain a substantial body of gas from the very centre, heat it and transport it to rather large radii, where it mixes in with ambient material. Material that originally overlay the ejected gas then sinks inwards to take its place. In this picture the curves of metallicity versus radius in the left panel of Fig. 10 would simply stretch to the left at constant metallicity because the gas from the centre would have a negligible effect on the metallicity of the much larger quantity of gas with which it mixed at large radii. In this case the decline in the central metallicity gradient would be very small. Fig. 10 indeed shows that, although an outburst flattens the metallicity gradient, the effect is confined to and is small. Ongoing stellar evolution would have a countervailing tendency to increase the metallicity gradient. Thus there does not seem to be a conflict between heating by jets and the existence of metallicity gradients near cluster centres.
-
8.
Since Fig. 1 shows that the dynamical time of the ICM exceeds at all radii, the large-scale structure of the ICM will be unaffected by fluctuations in the AGN’s power on short timescales. However fluctuations on shorter timescales may be important. Of particular interest is the timescale on which the jet channel closes up after the jet turns off, since a jet that is quiescent for this time or longer can probably not reactivate the cavities that it was formerly inflating. Hence new cavities will be formed when the jet comes back online. Our simulations suggest that the channel fills up more quickly than they are cut, but shorter timescales are conceivable, especially if the ICM is rotating and the jet does not fire along the axis of rotation.
Although great strides have been made in our understanding of cooling flows in the last few years, many key questions remain open. The cooling flow phenomenon is an extremely important one both because of its connection with galaxy formation, and because of the insights it gives to the dynamics of AGN. Simulations will have an important role to play in understanding cooling flows because they are inherently dynamical systems. Although a certain amount of progress can be made with axisymmetric simulations, the chaotic and turbulent nature of cooling flows makes essential three-dimensional simulations such as those we have presented here. Limitations of the simulations that arise from only limited spatial resolution are a worry, particularly in the three-dimensional case. For this reason we have chosen to focus in this paper on just two simulations, which are highly artificial in that they exclude radiative cooling. These simulations have clarified a number of numerical issues and provided a foundation for further work. We are currently experimenting with shorter-lived, more powerful jets and with simulations that include cooling and rotation of the cluster gas. Animations of the simulations described here and a number of other simulations can be viewed at www.clusterheating.org.
Acknowledgments
Work by HNO was made possible by funding from the Norwegian Research Council. JJB thanks Merton College for support. AS acknowledges the support of a fellowship from the UK Astrophysical Fluids Facility. We thank Katherine Blundell for valuable comments on an early draft of this paper.
References
- Abramopoulos & Ku (1983) Abramopoulos F., Ku W.H.-M., 1983, ApJ, 271, 446
- Alexander (2002) Alexander P., 2002, MNRAS, 353, 610
- Allen & Fabian (1997) Allen S.W., Fabian A.C., 1997, MNRAS, 286, 583
- Allen et al. (2001) Allen S.W., Taylor G.B., Nulsen P.E.J., Johnstone R.M., David L.P., Ettori S., Fabian A.C., Forman W., Jones C., McNamara B., 2001, MNRAS, 324, 842
- Arce & Goodman (2002) Arce H.G., Goodman A.A., 2002, ApJ, 575, 911
- Basson & Alexander (2003) Basson J.F., Alexander P., 2003, MNRAS, 339, 353
- Bahcall & Bahcall (1975) Bahcall J.N., Bahcall N.A., 1975, ApJ, 199, L89
- Balbus (1991) Balbus S.A., 1991, ApJ, 372, 25
- Balbus & Hawley (1991) Balbus S.A., Hawley J.F., 1991, ApJ, 376, 214
- Balbus & Soker (1989) Balbus S.A., Soker N., 1989, ApJ, 341, 611
- Bertschinger & Meiksin (1986) Bertschinger E., Meiksin A., 1986, ApJ, 306, L1
- Binney (1996) Binney J., 1996, in ‘Gravitational Dynamics’, eds O. Lahav, E. Terlevich, R. Terlevich, Cambridge University Press, p. 89
- Binney (1999) Binney J.J., 1999, in ‘The Radio Galaxy Messier 87’ ed. H.-J. Röser & K. Meisenheimer, Springer, Berlin, p. 116
- Binney (2003) Binney J., 2003, MNRAS submited
- Binney & Tabor (1995) Binney J., Tabor G., 1995, MNRAS, 276, 663
- Blandford & Begelman (1999) Blandford R.D., Begelman M.C., 1999, MNRAS, 303, L1
- Blandford & Znajek ( 1977) Blandford R.D., Znajek R.L., 1977, MNRAS, 179, 433
- Blanton et al. (2001) Blanton E.L., Sarazin C.L., McNamara B.R., Wise M.W., 2001, ApJ, 558, L15
- Blanton, Sarazin & McNamara (2003) Blanton E.L., Sarazin C.L., McNamara B.R., 2003, ApJ, astro-ph/0211027
- Böhringer et al. (2002) Böhringer H., Matsushita K., Churazov E., Ikebe Y., Chen Y., 2002, A&A, 382, 804
- Böhringer et al. (1993) Böhringer H., Voges W., Fabian A.C., Edge A.C., Neumann D.M., 1993, MNRAS, 264, L25
- Brüggen & Kaiser (2001) Brüggen M., Kaiser C.R., 2001, MNRAS, 325, 676
- Brüggen & Kaiser (2002) Brüggen M., Kaiser C.R., 2002, Nature 418, 301
- Brüggen et al. (2002) Brüggen M., Kaiser C.R., Churazov E., Ensslin T.A., 2002, MNRAS 331, 545
- Bryan & Norman (1997) Bryan G.L., Norman M.L., 1997, in ‘Computational Astrophysics’, ASP Conf. Ser. 123, p. 363
- Churazov et al. (2001) Churazov E., Brüggen M., Kaiser C.R., Böhringer H., Forman W., 2001, ApJ, 554, 261
- Churazov et al. (2000) Churazov E., Forman W., Jones C., Böhringer H., 2000, A&A, 356, 788
- Ciotti & Ostriker (1997) Ciotti L., Ostriker J.P., 1997, ApJL, 487, L105
- Ciotti & Ostriker (2001) Ciotti L., Ostriker J.P., 2001, ApJ, 551, 131
- Colella & Woodward (1984) Colella P., Woodward P.R., 1984, J. Comp. Phys., 54, 174
- Conselice et al. (2001) Conselice C.J., Gallagher J.S., Wyse R.F.G., 2001, AJ, 122, 2281
- Cowie & Binney (1977) Cowie L.L., Binney J., 1977, ApJ, 215, 723
- Cowie et al. (1983) Cowie L.L., Hu E.M., Jenkins E.B., York D.G., 1983, ApJ, 272, 29
- David et al. (2000) David L.P., Nulsen P.E.J., McNamara B.R., Forman W., Jones C., Ponman T. Robertson B., Wise M., 2001, ApJ, 557, 546
- Donahue et al. (2000) Donahue M., Mack J., Voit G.M., Sparks W., Elston R., Maloney P.R., 2000, ApJ, 545, 670
- Edge (2001) Edge A.C., 2001, MNRAS, 328, 762
- Edge et al. (2002) Edge A.C., Wilman R.J., Johnstone R.M., Crawfor C.S., Fabian A.C., Allen S.W., 2002, MNRAS, 337, 49
- Emsellem et al. (2002) Emsellem E., et al., 2002, Astrophysics and Space Science, 281, 363
- Fabian & Nulsen (1977) Fabian A.C., Nulsen P.E.J., 1977, MNRAS, 180, 479
- Fabbiano, Gioia & Trinchieri (1989) Fabbiano G., Gioia I.M., Trinchieri G., 1989, ApJ, 347, 127
- Fabian (1994) Fabian A.C., 1994, ARA&Ap, 32, 277
- Fabian (2001) Fabian A.C., 2001, in ‘Particles and Fields in Radio Galaxies’, eds R.A. Laing & K.M. Blundell, ASP Conf. Ser. 250, p. 471
- Fabian & Canizares (1988) Fabian, A.C., Canizares, C., 1988, Nature, 333, 829
- Fabian et al. (2001) Fabian A.C., Mushotzky R.F., Nulsen P.E.J., Peterson J.R., 2001, MNRAS, 321, L20
- Fabian et al. (2003a) Fabian A.C., Sanders J.S., Allen C.S., Crawford C.S., Iwasawa K., Johnstone R.M., Schmidt R.W., Taylor G.B., 2003a, astro-ph/0306036
- Fabian et al. (2003b) Fabian A.C., Sanders J.S., Crawford C.S., Conselice C.J., Gallagher, J.S., Wyse R.F.G., 2003b, astro-ph/0306039
- Fabian et al. (2000) Fabian A.C., Sanders J.S., Ettori S., Taylor G.B., Allen S.W., Crawford C.S., Iwasawa K., Johnstone R.M., Ogle P.M, 2000, MNRAS, 318, L65
- Forman et al. (1972) Forman W., Kellogg E., Gursky H., Tananbaum H., Giacconi R., 1972, ApJ, 178, 309
- Forman et al. (1978) Forman W., Jones C., Murray S., Giacconi R., 1978, ApJ, 225, L1
- Hawley, Balbus & Stone (2001) Hawley J.F., Balbus S.A., Stone J.M., 2001, ApJ, 554, L49
- Heinz et al. (2002) Heinz S., Choi Y.-Y., Reynolds C.S., Begelman, M.C., 2002, ApJ, 569, L79
- Ichimaru (1977) Ichimaru S., 1977, ApJ, 214, 840
- Jones & Forman (1984) Jones C., Forman W., 1984, ApJ, 276, 38
- Kaiser & Binney (2003) Kaiser C.R., Binney J., 2003, MNRAS, 338, 837
- Kay et al. (2003) Kay S.T., Thomas P.A., Theuns T., 2003, MNRAS, astro-ph/0210560
- King & Pounds (2003) King A.R. & Pounds K.A., 2003, astro-ph/0305541
- Lynds (1970) Lynds R., 1970, ApJ, 159, L151
- Malagoli et al. (1987) Malagoli A., Rosner R., Bodo G., 1987, ApJ, 319, 632
- McNamara et al. (2000) McNamara B., Wise M., Nulsen P.E.J., David L.P, Sarazin C.L., Bautz M., Markevitch M., Vikhlinin A., Forman W.R., Jones C., Harris D.E., 2000, ApJ, 534, L135
- McNamara et al. (2001) McNamara B. et al, 2001, ApJL, 562, L149
- Milgrom (1979) Milgrom M., 1979, A&A, 78, L9
- Mirabel & Rodriguez (1999) Mirabel I.F., Rodriguez L.F., 1999, ARA&A, 37, 409
- Mitchell et al. (1976) Mitchell R.J., Culhane J.L., Davison P.J.N., Ives J.C., 1976, MNRAS, 175 P29
- Morris & Fabian (2003) Morris R.G., Fabian A.C., 2003, MNRAS, 338, 824
- Motl et al. (2003) Motl P.M., Burns J.O., Loken C., Norman M.L., Bryan G., 2003, astro-ph/0302427
- Murray & Balbus (1992) Murray S.D., Balbus S.A., 1992, ApJ, 395, 99
- Narayan & Medvedev (2001) Narayan R., Medvedev M.V., 2001, ApJL, 562, L129
- Narayan & Yi (1994) Narayan R., Yi I., 1994, ApJL, 428, L13
- Nulsen (1986) Nulsen P.E.J., 1986, MNRAS, 211, 377
- Owen et al. (2000) Owen F.N., Eilek J.A., Kassim N.E., 2000, ApJ, 543, 611
- Peterson et al. (2002) Peterson et al. 2002, astro-ph/0210662
- Pettini et al. (2002) Pettini M., Rix S.A., Steidel C.C., Delberger K.L., Hunt M.P., Shapley A.E., 2002, ApJ, 569 742
- Pounds et al. (2003) Pounds K.A., Reeves J.N., King A.R., Page K.L., O’Brien P.T., Turner M.J.L., 2003, astro-ph/0303603
- Quilis et al. (2001) Quilis V., Bower R.G., Balogh M.L., 2001, MNRAS, 328, 1091
- Reynolds et al. (2001) Reynolds C.S., Heinz S., Begelman M.C., 2001, ApJL, 549, L179
- Reynolds et al. (2002) Reynolds C.S., Heinz S., Begelman M.C., 2002, MNRAS, 332, 271
- Serlemitsos et al. (1977) Serlemitsos P.J., Smith B.W., Boldt E.A., Holt S.S., Swank J.H., 1977, ApJ, 211, L63
- Silk (1976) Silk J., 1976, ApJ, 208, 646
- Soker (2003) Soker N., 2003, astro-ph/0309095
- Soker et al. (2002) Soker N., Blanton E.L., Sarazin C.L., 2002, ApJ, 573, 533
- Sparks, Macchetto & Golombek (1989) Sparks W.B., Macchetto F., & Golombek D., 1989, ApJ, 345, 153
- Stewart et al. (1984a) Stewart G.C., Fabian A.C., Jones C., Forman W., 1984, ApJ, 285, 1
- Stewart et al. (1984b) Stewart G.C., Fabian A.C., Nulsen P.E.J., Canizares C.R., 1984, ApJ, 278, 536
- Tabor & Binney (1993) Tabor G., Binney J., 1993, MNRAS, 263, 323
- Tamura et al. (2001) Tamura T., et al., 2001, A&A, 365, L87
- Tribble (1989) Tribble P.C., 1989, MNRAS, 238, 1247