Astrometry with Hubble Space Telescope: A Parallax of the Central Star of the Planetary Nebula NGC 6853111Based on observations made with the NASA/ESA Hubble Space Telescope, obtained at the Space Telescope Science Institute, which is operated by the Association of Universities for Research in Astronomy, Inc., under NASA contract NAS5-26555
Abstract
We present an absolute parallax and relative proper motion for the central star of the planetary nebula NGC 6853 (The Dumbell). We obtain these with astrometric data from FGS 3, a white-light interferometer on HST. Spectral classifications and VRIJHKT2M and DDO51 photometry of the stars comprising the astrometric reference frame provide spectrophotometric estimates of their absolute parallaxes. Introducing these into our model as observations with error, we find mas for the DAO central star of NGC 6853. A weighted average with a previous ground-based USNO determination yields . We assume that the extinction suffered by the reference stars nearest (in angular separation and distance) to the central star is the same as for the central star. Correcting for color differences, we find A = 0.30 0.06 for the central star, hence, an absolute magnitude M. A recent determination of the central star effective temperature aided in estimating the central star radius, , a star that may be descending to the white dwarf cooling track.
1 Introduction
Planetary nebulae are a visually spectacular and relatively short-lived step in the evolution from asymptotic giant branch (AGB) stars, to a final white dwarf stage. Iben & Renzini (1983) first showed that the ejection of most of the gaseous envelope in asymptotic giant branch (AGB) stars occurs at the tip of the thermal pulse phase, in the form of a massive, low-velocity wind. As summarized by Stanghellini et al. (2002), the remnant central star (CS) ionizes the gaseous ejecta, while a fast, low mass-loss rate CS wind shapes the PN. PN morphology depends on a complicated combination of phenomena, some occurring within the nebular gas, which evolves in dynamic timescale, and others caused by the evolution of the stellar progenitors and of the CS. Morphology may also depend on the physical status of the interstellar environment of the PN progenitor. Intercomparison of PN can aid our understanding of the complicated astrophysics of this stage of stellar evolution, particularly if distances are known. Many indirect methods of PN distance determination exist (Ciardullo et al. (1999) and Napiwotzki (2001)). Agreement among these methods is seldom better than 20%. Direct parallax measurments of PN central stars rarely have precisions smaller than the measured parallax, a notable exception being Harris et al. (1997), who provide 0.5 mas precision parallaxes for 7 planetary nebulae CS nearer than 500 pc.
As the last object on the Hubble Space Telescope (HST) Astrometry Science Team list of astrophysically interesting stars, we have determined the absolute parallax of the CS of NGC 6853 (The Dumbell, M27) using FGS 3. Napiwotzki (1999) classifies the central star as a white dwarf of type DAO. Our extensive investigation of the astrometric reference stars provides an independent estimation of the line of sight extinction to NGC 6853, a significant contributor to the uncertainty in the absolute magnitude, MV, of its CS. We present the results of extensive spectrophotometry of the astrometric reference stars, required to correct our relative parallax to absolute; briefly discuss data acquisition and analysis; and derive an absolute parallax for the CS of NGC 6853. Finally, from a weighted average of our new result and that of Harris et al. (1997) we calculate an absolute magnitude for the CS and apply it to derive a stellar radius.
Bradley et al. (1991) and Nelan et al. (2001) provide an overview of the FGS 3 instrument and Benedict et al. (1999) and Benedict et al. (2002a) describe the fringe tracking (POS) mode astrometric capabilities of FGS 3, along with the data acquisition and reduction strategies used in the present study. We time-tag our data with a modified Julian Date, , and abbreviate millisecond of arc, mas, throughout.
2 Observations and Data Reduction
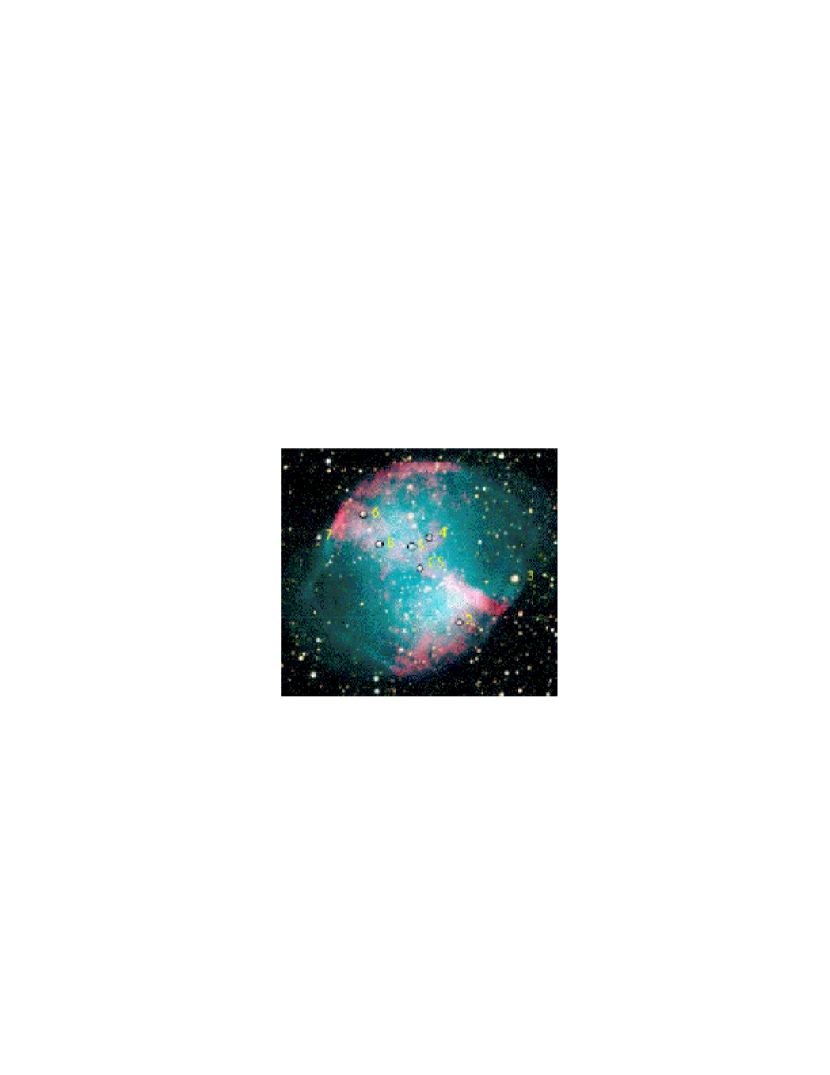
Figure 1 shows the distribution of the seven reference stars and the CS relative to the brightest regions of the PN. This image, produced by compositing Johnson B, V, and I bandpass frames obtained with the McDonald Observatory 0.8m telescope and Prime Focus Camera, reveals a particular difficulty with these data. The PN emission can contaminate the ancillary photometry and spectroscopy required to generate reference star spectrophotometric parallaxes (Section 3). Eight sets of astrometric data were acquired with HST, spanning 2.59 years, for a total of 140 measurements of the NGC 6853 CS and reference stars. Each data set required approximately 33 minutes of spacecraft time. The data were reduced and calibrated as detailed in Benedict et al. (2002a), Benedict et al. (2002b), and McArthur et al. (2001). At each epoch we measured reference stars and the target multiple times, this to correct for intra-orbit drift of the type seen in the cross filter calibration data shown in figure 1 of Benedict et al. (2002a).
Table 1 lists the eight epochs of observation and highlights another particular difficulty with these data. We obtain observations at each of the two maximum parallax factors; hence the two distinct spacecraft roll values in Table 1. These are imposed by the requirement that HST roll to keep its solar panels fully illuminated throughout the year. This roll constraint generally imposes alternate orientations at each time of maximum positive or negative parallax factor over a typical 2.5 year campaign, usually allowing a clean separation of parallax and proper motion signatures. In this case two guide star acquisition failures on two attempts at roll° (along with a bookkeeping error in scheduling the makeup observation), left us with the less than satisfactory temporal segregation of orientations shown in Table 1. Only the first two epochs occur at maximum negative parallax factor.
3 Spectrophotometric Absolute Parallaxes of the Astrometric Reference Stars
Because the parallax determined for the NGC 6853 CS will be measured with respect to reference frame stars which have their own parallaxes, we must either apply a statistically derived correction from relative to absolute parallax (Van Altena, Lee & Hofleit 1995, hereafter YPC95) or estimate the absolute parallaxes of the reference frame stars listed in Table 2. In principle, the colors, spectral type, and luminosity class of a star can be used to estimate the absolute magnitude, MV, and V-band absorption, AV. The absolute parallax is then simply,
| (1) |
The luminosity class is generally more difficult to estimate than the spectral type (temperature class). However, the derived absolute magnitudes are critically dependent on the luminosity class. As a consequence we obtained additional photometry in an attempt to confirm the luminosity classes. Specifically, we employ the technique used by Majewski et al. (2000) to discriminate between giants and dwarfs for stars later than G5, an approach also discussed by Paltoglou & Bell (1994).
3.1 Photometry
Our band passes for reference star photometry include: BVRI (CCD photometry from a 0.4m telescope at New Mexico State University), JHK (from a pre-release of 2MASS111The Two Micron All Sky Survey is a joint project of the University of Massachusetts and the Infrared Processing and Analysis Center/California Institute of Technology ), and Washington/DDO filters M, DDO51, and T2 (obtained at McDonald Observatory with the 0.8m and Prime Focus Camera). The 2MASS JHK have been transformed to the Bessell & Brett (1988) system using the transformations provided in Carpenter (2001). The RI are transformed (Bessell, 1979) to the Johnson system from Kron-Cousins measures. Tables 3 and 4 list the visible, infrared, and Washington/DDO photometry for the NGC 6853 reference stars, ref-2 through ref-8.
3.2 Spectroscopy and Luminosity Class-sensitive Photometry
The spectra from which we estimated spectral type and luminosity class come from the New Mexico State University Apache Peak Observatory222 The Apache Point Observatory 3.5 m telescope is owned and operated by the Astrophysical Research Consortium.. The dispersion was 1.61 Å/pixel with wavelength coverage 4101 – 4905 Å. Classifications used a combination of template matching and line ratios. The brightest targets had about 1500 counts above sky per pixel, or S/N 40, while the faintest targets had about 400 counts per pixel (S/N 20). The spectral types for the higher S/N stars are within 1 subclass. Classifications for the lower S/N stars are 2 subclasses. Table 6 lists the spectral types and luminosity classes for our reference stars. The estimated classification uncertainties are used to generate the values in that table.
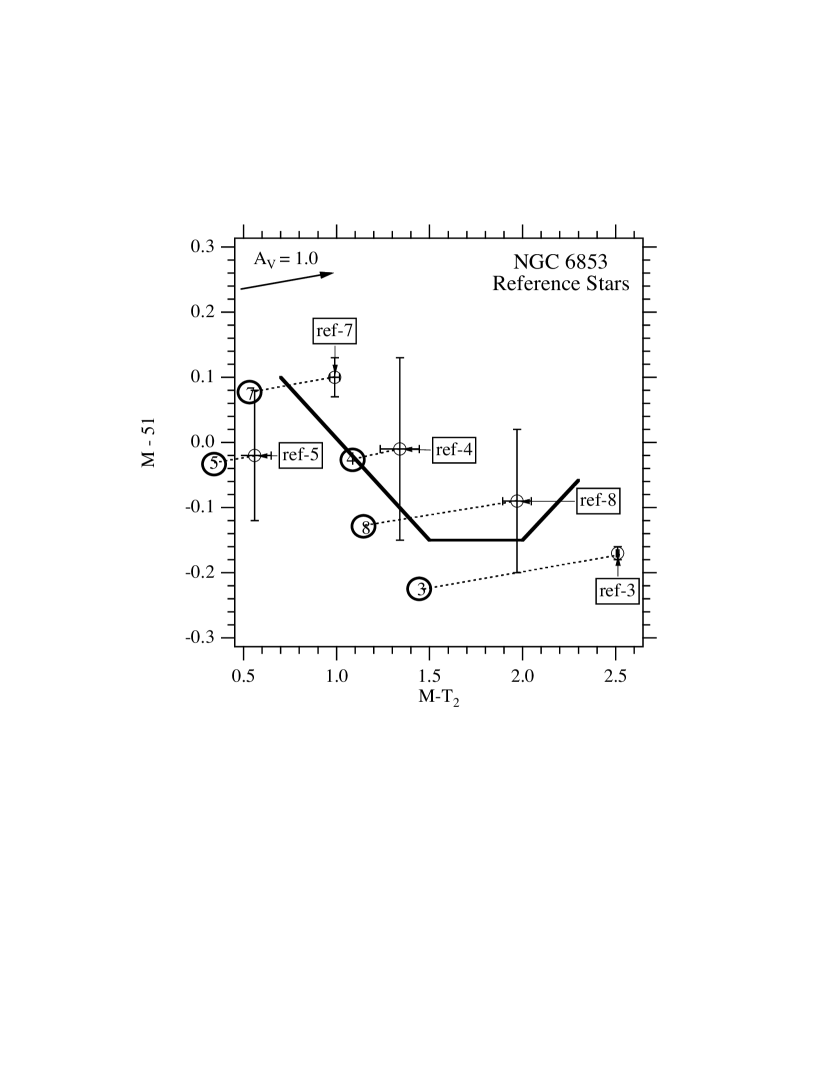
The Washington/DDO photometry can provide a possible confirmation of the estimated luminosity class, depending on the spectral type and luminosity class of the star (later than G5 for dwarfs, later than G0 for giants). Washington/DDO photometry is less helpful as a discriminator in this case than it has proved for our previous targets (e.g., Benedict et al. 2002a, Benedict et al. 2002b , McArthur et al. 2001). As seen in Figure 1 the nebular emission can contaminate the aperture photometry, depending on the filter bandpass. This contamination occurs predominantly in the M filter, because its effective bandpass (4500 - 5400 Å) includes the strong emission lines at 5007 Å [O III] and Å H. This results in broadband M-T2 colors which are slightly bluer than they would be in the absence of the nebula, and significantly bluer M-DDO51 indices (M-51 in Figure 2). Additionally, the nebular emission contaminates the sky annulus, which leads to larger measured magnitude errors than would be the case in the absence of the nebula. We list in Table 4 the Washington-DDO photometry. Unfortunately both ref-2 and ref-6 fell on bad columns in the photometer CCD. Figure 3 shows the Washington-DDO photometry along with a dividing line between dwarfs and giants (Paltoglou & Bell 1994 ). The boundary between giants and dwarfs is actually far ’fuzzier’ than suggested by the solid line in Figure 3 and complicated by the photometric transition from dwarfs to giants through subgiants. This soft boundary is readily apparent in Majewski et al. (2000) figure 14. In the absence of contaminating nebular flux objects just above the heavy line are statistically more likely to be giants than objects just below the line. After correcting for interstellar extinction, our reference stars lie on the dividing line to the left, where giant/dwarf discrimination is poorest. Nebular emission lines could have depressed ref-3 and ref-8 (giants, as determined from spectroscopy) below the giant-dwarf dividing line.
3.3 Interstellar Extinction
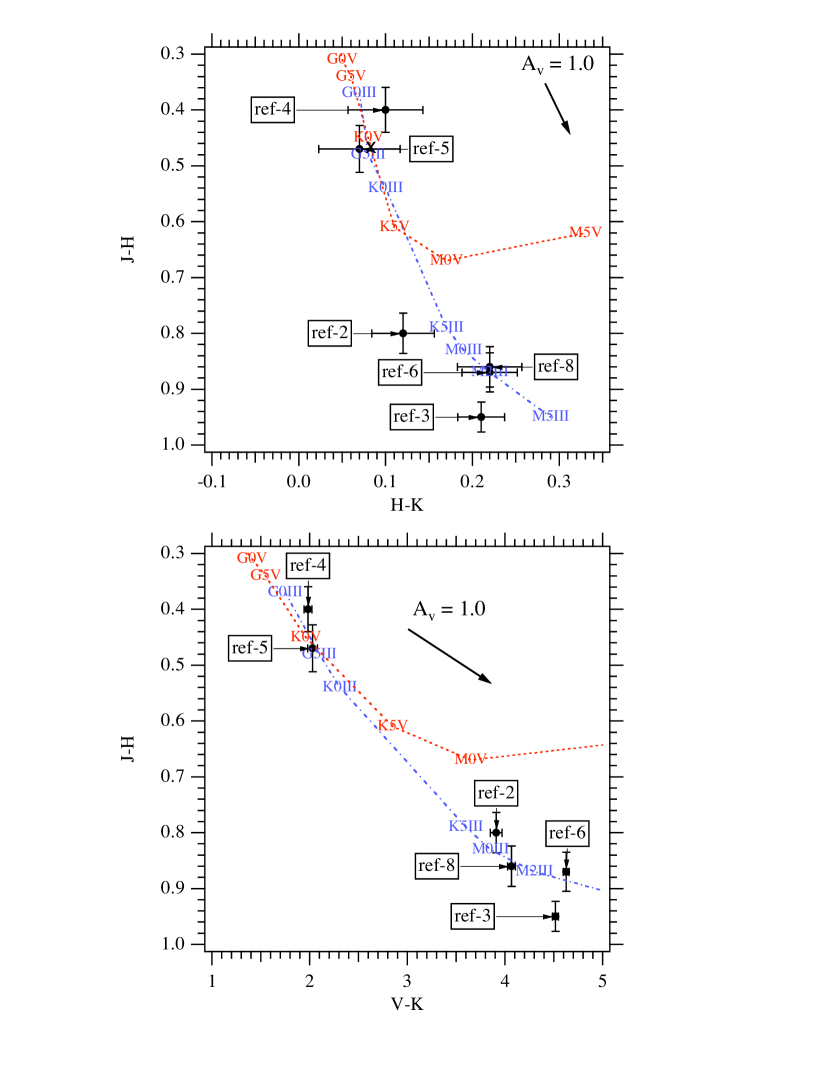
To determine interstellar extinction we first plot these stars on several color-color diagrams. A comparison of the relationships between spectral type and intrinsic color against those we measured provides an estimate of reddening. Figure 3 contains J-H vs H-K and J-H vs V-K color-color diagrams and reddening vectors for AV = 1.0. Also plotted are mappings between spectral type and luminosity class V and III from Bessell & Brett (1988) and Cox (2000) (hereafter AQ2000). Figure 3, and similar plots for the other measured colors, along with the estimated spectral types, provides an indication of the reddening for each reference star.
Assuming an R = 3.1 galactic reddening law (Savage & Mathis 1979), we derive AV values by comparing the measured colors (Tables 3 and 4 ) with intrinsic V-R, V-I, J-K, and V-K colors from Bessell & Brett (1988) and AQ2000. Specifically we estimate AV from four different ratios, each derived from the Savage & Mathis (1977) reddening law: AV/E(V-R) = 5.1; AV/E(J-K) = 5.8; AV/E(V-K) = 1.1; and AV/E(V-I) = 2.4. We excluded AV/E(B-V) due to the higher errors in that color index. The resulting AV are collected in Table 5. The errors are the standard deviation of the means for each star. We also tabulate AV per unit 100 pc distance for each star. Colors and spectral types of the NGC 6853 reference stars are consistent with a field-wide average A=1.460.35, far less than the maximum reddening, A determined by Schlegel et al. (1998).
3.4 Adopted Reference Frame Absolute Parallaxes
We derive absolute parallaxes with MV values from AQ2000 and the A derived from the photometry. Our parallax values are listed in Table 6. Individually, no reference star parallax is better determined than = 18%. The average absolute parallax for the reference frame is mas. As a check we compare this to the correction to absolute parallax discussed and presented in YPC95 (section 3.2, fig. 2). Entering YPC95, fig. 2, with the NGC 6853 galactic latitude, l = -37, and average magnitude for the reference frame, Vref = 14.3, we obtain a correction to absolute of 1.1 mas. We will use the 1.0 mas correction derived from spectrophotometry. When such data are available the use of spectrophotometric parallaxes offers a more direct way of determining the reference star absolute parallaxes.
4 Absolute Parallax of the Central Star of NGC 6853
4.1 The Astrometric Model
With the positions measured by FGS 3 we determine the scale, rotation, and offset “plate constants” relative to an arbitrarily adopted constraint epoch (the so-called “master plate”) for each observation set (the data acquired at each epoch). The mJD of each observation set is listed in Table 1, along with a measured magnitude transformed from the FGS instrumental system as per Benedict et al. (1998). The NGC 6853 reference frame contains 7 stars. We employ the six parameter model discussed in McArthur et al. (2001) for those observations. In this case we determined the plate parameters from reference star data only, then apply them as constants to obtain the parallax and proper motion of the CS. For the NGC 6853 field all the reference stars are redder than the science target. Hence, we apply the corrections for lateral color discussed in Benedict et al. (1999).
As for all our previous astrometric analyses, we employ GaussFit (Jefferys et al. (1987)) to minimize . The solved equations of condition for NGC 6853 are:
| (2) |
| (3) |
| (4) |
| (5) |
where and are the measured coordinates from HST; and are the lateral color corrections from Benedict et al. 1999; and are the B-V colors of each star. A and B are scale and rotation plate constants, C and F are offsets; and are radial terms; and are proper motions; t is the epoch difference from the mean epoch; and are parallax factors; and and are the parallaxes in x and y. We obtain the parallax factors from a JPL Earth orbit predictor (Standish (1990)), upgraded to version DE405. We imposed the constraint that the reference star proper motions are random in direction by forcing their sum in x and y to be zero, . Orientation to the sky is obtained from ground-based astrometry (USNO-A2.0 catalog, Monet 1998) with uncertainties in the field orientation .
4.2 Assessing Reference Frame Residuals
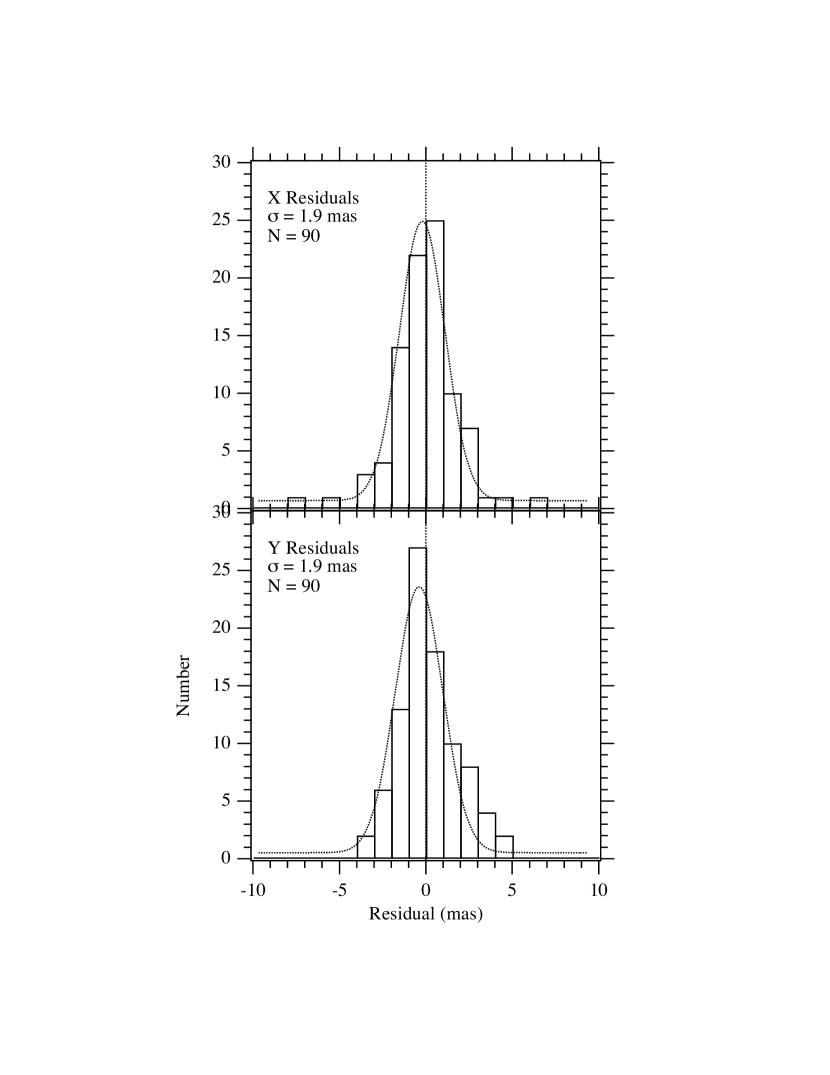
The Optical Field Angle Distortion calibration (McArthur et al. (1997)) reduces as-built HST telescope and FGS 3 distortions with amplitude to below 2 mas over much of the FGS 3 field of regard. From histograms of the reference star astrometric residuals (Figure 4) we conclude that we have obtained satisfactory correction in the region available at all HST rolls (an inscribed circle centered on the pickle-shaped FGS field of regard). The resulting reference frame ’catalog’ in and standard coordinates (Table 2) was determined with and mas.
To determine if there might be unmodeled - but possibly correctable - systematic effects at the 1 mas level, we plotted the NGC 6853 reference frame X and Y residuals against a number of spacecraft, instrumental, and astronomical parameters. These included X, Y position within the pickle; radial distance from the pickle center; reference star V magnitude and B-V color; and epoch of observation. We saw no obvious trends, other than an expected increase in positional uncertainty with reference star magnitude.
4.3 The Absolute Parallax of the NGC 6853 Central Star
In a quasi-Bayesian approach the reference star spectrophotometric absolute parallaxes were input as observations with associated errors, not as hardwired quantities known to infinite precision. We obtain for the NGC 6853 CS an absolute parallax mas. We note that the formal error on this particular HST parallax is larger than we typically achieve with FGS 3. For eight objects in common with HIPPARCOS we obtain an average parallax precision, = 0.26 mas, with no statistically significant scale difference compared to HIPPARCOS (Benedict et al. 2002b and Benedict et al. 2002c). We attribute the larger than expected parallax error for the NGC 6853 CS to the less than optimum pattern of maximum positive and negative parallax factors seen in Table 1. However, our result agrees within the errors with the previous ground-based parallax measurement of the NGC 6853 CS (Harris et al. 1997), mas. Parallaxes from HST and USNO and relative proper motion results from HST are collected in Table 7. For the remainder of this paper we adopt as the absolute parallax of the NGC 6853 CS, mas, the weighted average of these two completely independent parallax determinations.
5 Discussion and Summary
5.1 FGS Photometry of the CS
FGS 3 is a precision photometer, yielding relative photometry with 0.002 mag errors (Benedict et al. 1998). During each of the eight total observation sets we observed the NGC 6853 CS 6–7 times over approximately 33 minutes. No non-random variations were noted within any one data set. The average for the eight data sets was 0.002 mag. However, statistically significant variations over the 2.6 year campaign duration are evident in Table 1. Our coverage is too sparse to extract any periodic component to this variation.
5.2 The Lutz-Kelker-Hanson Bias
When using a trigonometric parallax to estimate the absolute magnitude of a star, a correction should be made for the Lutz-Kelker bias (Lutz & Kelker (1973)) as modified by Hanson (1979). Because of the galactic latitude and distance of NGC 6853, and the scale height of the stellar population of which it is a member, we use a uniform space density for determining this LKH bias. The LKH bias is proportional to . Presuming that the CS belongs to the same class of object as RR Lyr (evolved Main Sequence stars), we scale the LKH correction determined for RR Lyr in Benedict et al. (2002a) and obtain LKH = -0.15 0.07.
5.3 The Absolute Magnitude of the Central Star of NGC 6853
Adopting for the NGC 6853 CS V= 13.98 0.03 and the weighted average absolute parallax, mas from Section 4.3, we determine a distance modulus, m-M = 8.10. In Table 5 (Section 3.3) we list a derived per-star, per-unit 100 pc distance absorption, V/100pc. Given the considerable scatter in that value, we adopt the average of the three stars nearest the central target (see Figure 1), ref-4, -5, and -8, A/100pc = 0.070.03. With this per-unit 100 pc A and the measured distance to the NGC 6853 central star, d = 417 pc, we obtain a total absorption for the CS, A. As a check we employ the formulation (Laney & Stobie 1993),
| (6) |
to obtain for the NGC 6853 CS, R = 2.99. From R = AV/E(B-V) we then obtain E(B-V) = 0.10 and a reddening-corrected B-V = -0.34, a value one would expect for an object with T K. For further confirmation of this reddening value Ciardullo et al. (1999) obtain for NGC 6853 A = 0.20.1 from an E(B-V), c relation, assuming a CS temperature of 105 K. With A we obtain M, where we have included the LKH correction and its uncertainty and the 0.06 magnitude uncertainty in A in quadrature.
5.4 A Central Star Radius
To estimate a radius, , for this star we require a distance, an absolute magnitude, an effective temperature, Teff, and a bolometric correction (B.C.) . These quantities then yield a radius via differential comparison with the sun. Our parallax provides a distance, d = 417 pc and an absolute magnitude, M. Napiwotzki (1999) has estimated T 6800 K from model atmosphere fits to the Balmer H and H absorption lines.
For the B.C. we have two sources. Bergeron et al. (1995) tabulate B.C. up to T K from a pure Hydrogen, log DA white dwarf model convolved with a V bandpass. A small extrapolation yields B.C. = -7.13. Flower (1996) provides bolometric corrections for normal stars up to T. From Flower (1996), figure 4, the relationship between log Teff and B.C. is linear for T 25,000 K. Hotter stars lie on the Rayleigh-Jeans tail of the blackbody curve, where flux is roughly proportional to Teff, not T. A linear extrapolation yields B.C. = -7.03 for the NGC 6853 CS. We adopt B.C. = - 7.1 0.2, where the error is dominated by the uncertainty in Teff and the poorly characterized behavior of the B.C. at these high temperatures.
We obtain a CS bolometric luminosity Mbol = MV + B.C. = -1.67 . follows from the expression
| (7) |
where we assume for the Sun and . We find . The sources of error for this radius are in the absolute magnitude (i.e., the parallax), the bolometric correction, and the .
A second way to obtain involves the V-band average flux, , discussed in Bergeron et al. (1995). They list as a function of temperature for, again, a pure Hydrogen, DA model. We obtain for K by a small extrapolation from the highest temperature considered by Bergeron et al. (1995), K. If we can determine an , we can derive from
| (8) |
In Benedict et al. (2000), where we estimated the radius of Feige 24, the exponent on was inadvertantly omitted, but not in the calculation. In that paper we obtained by convolving the Bessell (1990) V band response with the solar spectral distribution listed in Allen (1973). We calculated ergs cm-2 s-1 Å-1 str-1. We obtain for this CS with , from our parallax, and an . As a final check we calculate from equation 8, but differentially with respect to our Feige 24 (Benedict et al. 2000, table 5), rather than . This also yields . Given that the approach relying directly on the B.C. and the approach utilizing yield values that agree within their errors, we adopt . The error on this radius (2.75) cannot be further reduced by a weighted average of the results from the two approaches, because their errors are highly correlated, both having significant contributions from the uncertainties in and M.
Comparing with the results presented in Provencal et al. (1998), figure 3, and our radius for the hot white dwarf Feige 24, we find the CS of NGC 6853 to have a radius larger than any other white dwarf so far measured. On a log - log Teff diagram (Napiwotzki 1999, figure 2) the evolutionary track of a post-AGB star of a given mass traces a path at first of both increasing log and log Teff. Once the star reaches the WD cooling track, log Teff then decreases, with a smaller rate of change in log . Having determined both Teff and log from line profile fitting, Napiwotzki (1999) estimates the mass of the NGC 6853 CS from such a diagram, obtaining . A mass and radius uniquely determine a gravity, ,
| (9) |
5.5 Summary
HST astrometry yields an absolute trigonometric parallax for the NGC 6853 CS, mas. A weighted average with a previous ground-based determination (Harris et al. 1997) provides mas. The higher precision resulting from the average of two independent parallax determinations requires a smaller LKH bias correction, -0.150.07 magnitude. Spectrophotometry of the astrometric reference stars local to NGC 6853 suggest an extinction for the CS, A = 0.300.06. The dominant error terms in the resulting absolute magnitude, M, are the parallax and the uncertainty in the amount of extinction for the CS itself. Two methods for estimating the radius of the CS yield , suggesting a star still above the white dwarf cooling track.
References
- Allen (1973) Allen, C. W. 1973, London: University of London, Athlone Press, 3rd ed.
- Benedict et al. (1998) Benedict, G. F., McArthur, B., Nelan, E., Story, D., Whipple, A. L., Shelus, P. J., Jefferys, W. H., Hemenway, P. D., Franz, O. G., Wasserman, L. H., Duncombe, R. L., van Altena, W., & Fredrick, L. W. 1998, AJ, 116, 429
- Benedict et al. (1999) Benedict, G. F., McArthur, B., Chappell, D. W., Nelan, E., Jefferys, W. H., van Altena, W., Lee, J., Cornell, D., Shelus, P. J., Hemenway, P. D., Franz, O. G., Wasserman, L. H., Duncombe, R. L., Story, D., Whipple, A., & Fredrick, L. W. 1999, AJ, 118, 1086
- Benedict et al. (2000) Benedict, G. F., McArthur, B. E., Franz, O. G., Wasserman, L. H., Nelan, E., Lee, J., Fredrick, L. W., Jefferys, W. H., van Altena, W., Robinson, E. L., Spiesman, W. J., Shelus, P. J., Hemenway, P. D., Duncombe, R. L., Story, D., Whipple, A. L., & Bradley, A. al. 2000, AJ, 119, 2382
- Benedict et al. (2002a) Benedict, G. F., McArthur, B. E., Fredrick, L. W., Harrison, T. E., Lee, J., Slesnick, C. L., Rhee, J., Patterson, R. J., Nelan, E., Jefferys, W. H., van Altena, W., Shelus, P. J., Franz, O. G., Wasserman, L. H., Hemenway, P. D., Duncombe, R. L., Story, D., Whipple, A. L., & Bradley, A. J. 2002a, AJ, 123, 473
- Benedict et al. (2002b) Benedict, G. F., McArthur, B. E., Fredrick, L. W., Harrison, T. E., Slesnick, C. L., Rhee, J., Patterson, R. J., Skrutskie, M. F., Franz, O. G., Wasserman, L. H., Jefferys, W. H., Nelan, E., van Altena, W., Shelus, P. J., Hemenway, P. D., Duncombe, R. L., Story, D., Whipple, A. L., & Bradley, A. J. 2002b, AJ, 124, 1695
- Benedict et al. (2002c) Benedict, G. F., McArthur, B. E., Forveille, T., Delfosse, X., Nelan, E., Butler, R. P., Spiesman, W., Marcy, G., Goldman, B., Perrier, C., Jefferys, W. H., & Mayor, M. 2002c, ApJ, 581, L115
- Bergeron et al. (1995) Bergeron, P., Wesemael, F. & Beauchamp, A. 1995, PASP, 107, 1047
- Bessell (1990) Bessell, M. S. 1990, PASP, 102, 1181
- Bessell & Brett (1988) Bessell, M. S. & Brett, J. M. 1988, PASP, 100, 1134
- Bessell (1979) Bessell, M. S. 1979, PASP, 91, 5
- Bradley et al. (1991) Bradley, A., Abramowicz-Reed, L., Story, D., Benedict, G. & Jefferys, W. 1991, PASP, 103, 317
- Carpenter (2001) Carpenter, J. M. 2001, AJ, 121, 2851
- Ciardullo et al. (1999) Ciardullo, R., Bond, H. E., Sipior, M. S., Fullton, L. K., Zhang, C.-Y., & Schaefer, K. G. 1999, AJ, 118, 488
- Cox (2000) Cox, A. N. 2000, Allen’s astrophysical quantities, 4th ed. Publisher: New York: AIP Press, Springer, 2000. Edited by Arthur N. Cox. (AQ2000)
- Flower (1996) Flower, P. J. 1996, ApJ, 469, 355
- Hanson (1979) Hanson, R. B. 1979, MNRAS, 186, 87
- Harris et al. (1997) Harris, H. C., Dahn, C. C., Monet, D. G., & Pier, J. R. 1997, IAU Symp. 180: Planetary Nebulae, 180, 40
- Iben & Renzini (1983) Iben, I. & Renzini, A. 1983, ARA&A, 21, 271
- Jefferys et al. (1987) Jefferys, W., Fitzpatrick, J., and McArthur, B. 1987, Celest. Mech. 41, 39.
- Laney & Stobie (1993) Laney, C. D. & Stobie, R. S. 1993, MNRAS, 263, 921
- Lutz & Kelker (1973) Lutz, T. E. & Kelker, D. H. 1973, PASP, 85, 573
- Majewski et al. (2000) Majewski, S. R., Ostheimer, J. C., Kunkel, W. E., & Patterson, R. J. 2000, AJ, 120, 2550
- McArthur et al. (1997) McArthur, B., Benedict, G. F., Jefferys, W. H., and Nelan, E. 1997. in Proc. 1997 HST Calibration Workshop, ed. S. Casertano, R. Jedrzejewski, T. Keyes, and M. Stevens, STScI Publication, Baltimore, MD
- McArthur et al. (2001) McArthur, B. E. et al. 2001, ApJ, 560, 907
- Monet (1998) Monet, D. G. 1998, American Astronomical Society Meeting, 193, 112.003
- Napiwotzki (2001) Napiwotzki, R. 2001, A&A, 367, 973
- Napiwotzki (1999) Napiwotzki, R. 1999, A&A, 350, 101
- Nelan et al. (2001) Nelan, E. 2001, Fine Guidance Sensor Instrument Handbook (version 10; Baltimore: STScI)
- Paltoglou & Bell (1994) Paltoglou, G. & Bell, R. A. 1994, MNRAS, 268, 793
- Provencal et al. (1998) Provencal, J. L., Shipman, H. L., Høg, E. & Thejll, P. 1998, ApJ, 494, 759
- Savage & Mathis (1979) Savage, B. D. & Mathis, J. S. 1979, ARA&A, 17, 73
- Schlegel et al. (1998) Schlegel, D. J., Finkbeiner, D. P., & Davis, M. 1998, ApJ, 500, 525
- Standish (1990) Standish, E. M., Jr. 1990, A&A, 233, 252
- Stanghellini, Villaver, Manchado, & Guerrero (2002) Stanghellini, L., Villaver, E., Manchado, A., & Guerrero, M. A. 2002, ApJ, 576, 285
- van Altena Lee & Hoffleit (1995) van Altena, W. F., Lee, J. T., & Hoffleit, E. D. 1995, Yale Parallax Catalog (4th ed. ; New Haven, CT: Yale Univ. Obs.) (YPC95)
| Set | mJD | Roll (°) aaSpacecraft roll as defined in Chapter 2, FGS Instrument Handbook (Nelan, 2001) | VbbAverage of 6 to 7 observations at each epoch. Errors are internal, not external. |
|---|---|---|---|
| 1 | 49985.60531 | 101.91 | 13.9850.004 |
| 2 | 50021.33038 | 103.9 | 13.9790.002 |
| 3 | 50172.92498 | 268.6 | 14.0150.003 |
| 4 | 50178.95797 | 270.4 | 14.0160.002 |
| 5 | 50208.6424 | 286.6 | 14.0120.002 |
| 6 | 50233.84447 | 286.6 | 14.0260.002 |
| 7 | 50569.61249 | 286.0 | 13.9940.003 |
| 8 | 50932.79954 | 286.0 | 14.0070.003 |
| ID | aa and are relative positions in arcseconds | aa and are relative positions in arcseconds | bb and are relative motions in arcsec yr-1 | bb and are relative motions in arcsec yr-1 | |
|---|---|---|---|---|---|
| CSccRA = 19 59 36.38 Dec = 22 43 16.0, J2000, epoch = mJD 51486.092. CS position from 2MASS. | 0.00000.0006 | 0.00000.0005 | 0.00690.0005 | 0.01790.0004 | |
| ref-2 | -62.98770.0007 | -90.34900.0008 | - 0.00130.0010 | 0.00520.0007 | |
| ref-3 | -154.28620.0008 | -20.59960.0009 | 0.00280.0026 | - 0.01120.0020 | |
| ref-4 | -13.27700.0007 | 48.47150.0007 | -0.00660.0026 | 0.0098 | 0.0021 |
| ref-5 | 15.59630.0008 | 34.43500.0007 | 0.00580.0031 | 0.01230.0025 | |
| ref-6 | 93.10160.0008 | 89.07450.0008 | 0.00040.0006 | 0.00200.0006 | |
| ref-7 | 164.55350.0010 | 51.15930.0011 | 0.00260.0024 | - 0.01070.0019 | |
| ref-8 | 67.35710.0008 | 40.59660.0008 | - 0.00640.0023 | 0.00480.0019 |
| ID | V | B-V | V-R | V-I | V-K | |
|---|---|---|---|---|---|---|
| CS | 13.980.03 | -0.240.04 | -0.460.04 | -0.080.04 | ||
| ref-2 | 15.410.06 | 2.20.2 | 1.110.08 | 2.190.08 | 3.910.06 | |
| ref-3 | 11.660.02 | 1.870.03 | 1.470.03 | 2.570.03 | 4.520.03 | |
| ref-4 | 14.940.03 | 0.760.07 | 0.590.04 | 1.210.04 | 1.980.04 | |
| ref-5 | 15.450.04 | 0.920.07 | 0.550.05 | 1.180.05 | 2.030.05 | |
| ref-6 | 14.100.03 | 1.950.07 | 1.580.04 | 2.660.04 | 4.630.03 | |
| ref-7 | 13.710.03 | 0.660.06 | 0.490.04 | 1.050.04 | ||
| ref-8 | 14.690.03 | 1.980.07 | 1.120.04 | 2.130.04 | 4.070.04 |
| ID | K | J-H | H-K | M-T2 | M-51 | ||
|---|---|---|---|---|---|---|---|
| ref-2 | 11.500.02 | 0.740.04 | 0.150.04 | ||||
| ref-3 | 7.140.02 | 0.890.03 | 0.230.03 | 2.510.01 | -0.170.01 | ||
| ref-4 | 12.960.03 | 0.350.04 | 0.130.04 | 1.340.10 | -0.010.14 | ||
| ref-5 | 13.420.03 | 0.420.04 | 0.100.05 | 0.560.09 | -0.020.1 | ||
| ref-6 | 9.470.02 | 0.810.03 | 0.250.03 | ||||
| ref-7 | 0.990.03 | 0.100.03 | |||||
| ref-8 | 10.620.03 | 0.800.04 | 0.240.04 | 1.970.08 | -0.090.11 |
| ID | AV(V-I) | AV(V-R) | AV(V-K) | AV(J-K) | A | A/100pc |
|---|---|---|---|---|---|---|
| ref-2 | 1.64 | 2.02 | 1.68 | 1.68 | 1.750.10 | 0.050.01 |
| ref-3 | 2.44 | 2.09 | 1.59 | 2.09 | 2.050.20 | 0.290.03 |
| ref-4 | 0.29 | 1.13 | 0.51 | 0.64 | 0.640.21 | 0.130.04**Stars used to estimate A/100pc for CS |
| ref-5 | 0.04 | 0.07 | 0.51 | 0.81 | 0.360.21 | 0.040.02**Stars used to estimate A/100pc for CS |
| ref-6 | 3.89 | 3.07 | 2.43 | 2.73 | 3.030.36 | 0.260.03 |
| ref-7 | 0.55 | 1.27 | 0.00 | 0.00 | 0.910.36 | 0.100.04 |
| ref-8 | 1.37 | 1.61 | 1.44 | 1.97 | 1.600.16 | 0.050.01**Stars used to estimate A/100pc for CS |
| ID | Sp. T. | V | MV | AV | (mas) |
|---|---|---|---|---|---|
| ref-2 | K0 III | 15.41 | 0.70.4 | 1.8 | 0.30.1 |
| ref-3 | K3 III | 11.66 | 0.30.4 | 2.1 | 1.40.2 |
| ref-4 | G3 V | 14.94 | 5.90.4 | 0.6 | 2.10.4 |
| ref-5 | G5 V | 15.45 | 5.10.4 | 0.4 | 1.20.5 |
| ref-6 | K0 III | 14.10 | 0.70.4 | 3.0 | 0.80.2 |
| ref-7 | F4 V | 13.71 | 3.30.4 | 0.9 | 1.30.2 |
| ref-8 | K2 III | 14.69 | 0.50.4 | 1.6 | 0.30.1 |
| Parameter | Value |
|---|---|
| HST study duration | 2.59 y |
| number of observation sets | 8 |
| ref. stars | |
| ref. stars | |
| HST Absolute Parallax | 2.10 0.48 mas |
| USNO Absolute Parallax | 2.63 0.43 mas |
| Weighted Average Absolute Parallax | 2.40 0.32 mas |
| HST Proper Motion | 19.2 1.1 mas y-1 |
| in pos. angle | 21° 1° |
| Parameter | Value | Source |
|---|---|---|
| 13.98 0.03 | this paper, Table 3 | |
| B V | -0.24 0.04 | this paper, Table 3 |
| d | 417 pc | this paper |
| d & A/100pc for ref-4, 5, 8 | ||
| m-M | this paper | |
| LKH Bias | -0.15 0.07 | this paper |
| m-M, , LKH Bias | ||
| Napiwotzki (1999) | ||
| B.C. | Flower (1996), Bergeron et al. (1995) | |
| = +B.C. | ||
| this paper | ||
| Napiwotzki (1999) | ||
| log | 6.7 0.2, 6.7 0.4 | Napiwotzki (1999), this paper |