Submillimetre observations of a sample of broad absorption line quasars
Abstract
The broad absorption line (BAL) features seen in a small fraction of quasar optical/UV spectra are attributed to bulk outflows away from the quasar core. Observational evidence suggests that dust plays a key role in these systems, although whether the inferred dust properties are a signature of orientation effects or whether they are indicative of an evolutionary sequence remains an outstanding issue. Submillimetre (submm) detections of BAL quasars (BALQSOs), which would clearly help to resolve this issue, have so far been sparse. This paper reports on new submm observations of seven BALQSOs. The strongest influence on the observed flux is found to be the redshift, with the two highest redshift sources appearing intrinsically more submm-luminous than the lower redshift ones. Since this trend is also seen in other high redshift AGN, including non-BAL quasars it implies that the dust emission properties of these systems are no different from those of the general AGN population, which is difficult to reconcile with the evolutionary interpretation of the BAL phenomenon.
Subject headings:
Quasars: Active Galaxies: Ultraluminous Galaxies1. Introduction
A small fraction ( – Hewett & Foltz 2003; Becker et al. 2000) of quasars display broad absorption features in their spectra, with widths of several thousand , blue-ward of the prominent broad emission lines. Seen only in permitted lines, these absorption troughs are attributed to bulk outflows from the quasar’s heart. Typically, the BALs are seen in high ionization lines, such as , and , although more rarely some systems also display low ionization lines such as ; these latter systems comprise of the BALQSO population and are referred to as LoBALQSOs, whereas HiBALQSOs display solely high ionization absorption features. The BAL phenomenon in quasars appears to be part of a much broader manifestation of absorption outflows from AGN; lower velocity and narrower UV absorption features are detected more readily in Seyfert spectra and similar spectral features from ‘associated absorbers’ are also detected in some (mainly steep-spectrum) radio-loud quasars (see Crenshaw, Kraemer & George 2002 for a review). Indeed, the recently released catalog of BALQSOs from the Sloan Digital Sky Survey (Reichard et al., 2003) reveals numerous quasars possessing weak, difficult to classify absorption features, hinting at the possible ubiquitous nature of intrinsic absorption outflows.
| Name | ||||||
|---|---|---|---|---|---|---|
| (mJy) | (mJy) | |||||
| PSS 1537+1227 | 1.20 | -10.132.2 | -0.4 1.0 | 2.1 | 7.2 | 713 |
| 0840+3633 | 1.22 | -4.89.2 | 1.11.0 | 2.1 | 7.2 | 713 |
| 1104-0004 | 1.35 | 7.813.2 | 0.71.8 | 3.9 | 12.8 | 1276 |
| 1556+3517 | 1.50 | 31.028.7 | 1.61.2 | 1.1 | 3.7 | 371 |
| 1053-0058 | 1.55 | 6.615.3 | 0.91.2 | 0.7 | 2.5 | 248 |
| LBQS 0059-2735 | 1.59 | 19.256.3 | 10.33.3 | 7.12.4 | 23.66.9 | 2369764 |
| Hawaii 167 | 2.35 | 66.020.7 | 6.01.7 | 3.71.0 | 12.23.3 | 1219333 |
The BAL phenomenon, and in particular its relation to the overall quasar population, has been the subject of debate for a number of years. Two distinct competing interpretations for the occurrence of BALs amongst quasar spectra are the orientation and evolution hypotheses. According to the orientation interpretation (Weymann, et al., 1991; Schmidt & Hines, 1999), all quasars possess BAL outflows with a restricted covering factor, so that the frequency of detection simply translates to the rate at which our line-of-sight intercepts the outflow. According to the evolution hypothesis (Briggs, Turnshek, & Wolfe, 1984; Voit, Weymann, & Korista, 1993), the incidence rate of the BAL phenomenon is interpreted as the duration of a phase of a quasar’s natural life cycle.
Observational evidence supporting the orientation hypothesis comes largely from spectral comparisons of BAL and non-BAL quasars (Weymann, et al., 1991) and polarization studies (Hines & Wills, 1995; Goodrich & Miller, 1995; Cohen et al., 1995; Hutsemekers, Lamy, & Remy, 1998; Schmidt & Hines, 1999). Evidence in favour of the evolution hypothesis comes largely from IRAS-selected BALQSOs (e.g. Boroson & Meyers, 1992), particularly those showing evidence for recent mergers or close interactions, consistent with proposed evolutionary scenarios for quasars (e.g. Sanders et al., 1988). Further support to the evolution hypothesis has been provided indirectly by radio observations of BALQSOs, which are inconsistent with simple orientation schemes (Becker et al., 2000).
Both hypotheses, however, also rely on observations indicating that: 1. BALQSOs are substantially more reddened than non-BAL quasars (Hall, et al., 1997; Reichard et al., 2003); 2. their continua are virtually indistinguishable from those of non-BAL quasars once dust extinction is taken into account (e.g. Yamamoto & Vansevicius, 1999); and 3. LoBALQSOs are much redder than HiBALQSOs (Sprayberry & Foltz, 1992). In the orientation scheme, these observations support the idea that BAL outflows become increasingly more dusty as the viewing angle becomes more inclined, with LoBALs seen along sight-lines grazing the putative nuclear dusty torus which plays a key role in orientation-based unification schemes for AGN. In evolutionary scenarios, the merging of two gas-rich systems fuels both vigorous star formation and a central AGN, resulting in the strong dust emission associated with an Ultraluminous Infrared Galaxy (ULIRG) phase (Sanders et al., 1988; Voit, Weymann, & Korista, 1993; Sanders & Mirabel, 1996; Canalizo & Stockton, 2001). The overall evolutionary path in this scenario is gas-rich mergers ULIRG LoBALQSO HiBALQSO unobscured quasar.
Since evolutionary models implicitly predict that BALQSOs should exhibit enhanced dust emission with respect to non-BAL quasars, one method of distinguishing between the two competing hypotheses is to measure submm luminosities. To date, only a handful of BALQSOs have been observed at submm wavelengths (e.g. Hughes, Dunlop, & Rawlings, 1997; Lewis et al., 1998; Page et al., 2001). In this paper, we present submm photometry observations of seven BALQSOs in order to determine how their dust emission properties compare to that of the general quasar and AGN population.
2. Observations
Our target sample was drawn from the literature111 This research has made use of the NASA/IPAC Extragalactic Database (NED) which is operated by the Jet Propulsion Laboratory, California Institute of Technology, under contract with the National Aeronautics and Space Administration. and consisted of a range of BAL systems. Given weather constraints, seven of our sample was observed. These were PSS 1537+1227 222 Currently unpublished, the position of this quasar was deduced from images available in the press as 15 37 42, 12 27 44 (J2000), 0840+3633 (Becker et al., 1997), 1104-0004 (Brotherton et al., 1998), 1556+3517 (Najita et al., 2000), 1053-0058 (Brotherton et al., 1998) and LBQS 0059-2735 (Hazard et al., 1987; Weymann, et al., 1991), whose submm flux are presented in this paper The details of our observations of Hawaii 167 (Cowie, et al., 1994; Egami et al., 1996) are presented elsewhere (Lewis & Chapman, 2000).
This sample was observed in May 2000 with the Submillimetre Common-User Bolometer Array (SCUBA) on the James Clerk Maxwell Telescope 333The James Clerk Maxwell Telescope is operated by The Joint Astronomy Centre on behalf of the Particle Physics and Astronomy Research Council of the United Kingdom, the Netherlands Organisation for Scientific Research, and the National Research Council of Canada. on Mauna Kea, Hawaii. We used the PHOTOMETRY three bolometer chopping mode described in Chapman et al. (2000) and Scott et al. (2000) to keep the source in a bolometer throughout the observation. This mode has the additional advantage of allowing a check on the apparent detection of a source over three independent bolometers. While the 450m and 850m arrays are illuminated simultaneously, the bolometer alignment is not perfect, and we did not include the 450m offbeams in our final flux estimate, except to check that the source had offbeam flux consistent with the detection in the primary bolometer.
The observations incorporate chopping (7.8125 Hz) and nodding (every 9 seconds), and the final flux density in an individual bolometer is a double-difference with beams. The central beam has an efficiency of unity and the two off beams have
| (1) |
where is the angular distance of the off-beam centre from the source, and is the Gaussian half-width of the beam. For the secondary bolometer the beam efficiency is simply 0.5. However, distortion in the field results in our chosen third bolometer being slightly offset from the source position, resulting in a beam efficiency of 0.44. Our 2- and 3-beam measured fluxes agree within of the primary beam measurement in all non-detection cases. For the two sources we claim as detections, H167 and LBQS0059, the detection significance increases after folding in the negative flux density from the two offbeam pixels.
The effective integration time on source varied from 1200 s to 4800 s for the seven objects in our sample. The secondary was chopped with a throw of 52 arcsec to keep the source on bolometer at all times. Pointing was checked before and after the observation on blazars and a sky-dip was performed to measure the atmospheric opacity directly. The rms pointing errors were 1.4 arcsec, while the average atmospheric zenith opacities at 450m and 850m were 1.7 and 0.21 respectively. The data were reduced using the Starlink package SURF (Scuba User Reduction Facility, Jenness & Lightfoot 1998) and our own reduction routines to implement the three bolometer chopping mode. Spikes were first carefully rejected from the data, followed by correction for atmospheric opacity and sky subtraction using the median of all the array pixels, except for obviously bad pixels and the source pixels. The data were then calibrated against standard planetary and compact H ii region sources, observed during the same night.

3. Results
Table 1 summarizes the submm photometry and dust properties of our sample of BALQSOs. There is a strong redshift dependence upon the submm properties of these BAL systems, with only upper limits for all systems below , despite deep and uniform noise limits achieved for this sample. The inferred associated dust masses, FIR fluxes and star formation rates are substantially higher for the two highest- sources compared to the values calculated from the upper limits for the lower- sources. Whilst our sample is small, these results nevertheless support the notion that the high redshift universe is considerably more dusty than the local universe. Our results also corroborate other separate submm observations of three different BALQSOs, all with mJy and all lying at (Hughes, Dunlop, & Rawlings, 1997; Lewis et al., 1998; Page et al., 2001).
How do the submm properties of our BALQSO sample compare to those of other AGN at high redshift? Priddey et al. (2003) obtained 850 fluxes for a sample of 57 optically bright quasars in the range , overlapping with the redshift range of our BALQSO sample. With slightly worse noise limits, their study detected nine targets at significance, a similar detection rate to this sample. The BALQSOs presented here have 850 properties very similar to the Priddey et al. (2003) bright quasar sample, although only a slight trend with redshift is found in their sample, and is consistent with negative K-correction effects.
At higher redshifts, however, the dependence of FIR luminosity on redshift becomes more evident in samples of quasars (e.g. McMahon et al., 1999; Isaak et al., 2002) and even more so for radio galaxies (e.g. Archibald, et al., 2001). In the Archibald, et al. (2001) study of 47 radio galaxies between , 20 of the sources lie in the redshift range , overlapping with our BALQSO sample, and 4 are detected at , a level similar to both our BALQSO sample and the Priddey et al. (2003) bright quasar survey. The FIR fluxes of the detected radio galaxies are broadly similar to those in both quasar samples. Archibald, et al. (2001), however, also found a dramatic increase of FIR flux with redshift , a much stronger evolution than that seen in the quasar samples. This trend is interpreted as increasingly younger stellar populations associated with the radio galaxies at earlier epochs. Finally, 850 fluxes for a sample of X-ray absorbed AGN (Page et al., 2001) reveal a very similar trend to that of our BALQSO sample, with 4 significant detections above and only upper limits at lower redshifts, with similar detected levels of 850 fluxes.
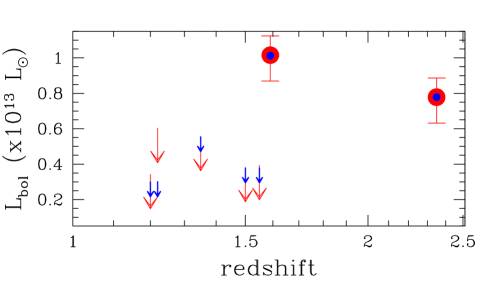
In Figure 1 bolometric luminosities (total far-infrared luminosity plus total UV/optical luminosity) are plotted against redshift for our BAL sample. Both the optical and submm luminosities have been K-corrected, assuming , with for the optical correction, and greybody emission with and for the submm correction. Infrared luminosity is integrated over the greybody from 1100m to 60m rest-frame, while optical luminosity is integrated over the powerlaw continuum from 2000Å to 5000Å. The plot also shows just the far-infrared luminosities overlaid (smaller symbols), showing that the bulk of the bolometric luminosity is generated through dust reprocessing, generating ULIRG-class luminosities for both submm detections. Note, however, that the deep SCUBA limits are insufficient to exclude the lower redshift BALQSOs from being ULIRG-class sources also. The mean submm signal from the five non-detections (calculated by weighting each measurement by its inverse variance) is 0.70.5 mJy, which translates into a far-infrared lumionsity of 8.61011L⊙. Note also that the negative K-correction in the observed 850 flux results in a quasi-linear flux-luminosity relation, varying less than over the redshift range redshifts 13 (e.g. Blain, Barnard, & Chapman, 2003). Thus, while the negative K-correction eases the detection of distant submm sources, its small variation over the redshift range of interest here implies that the detections/upper limits would have been similar if the redshifts were interchanged.
Figure 2 presents a comparison of –to–R-band flux ratios for our BALQSO sample (filled circles) against those for a subsample of the Archibald, et al. (2001) radio galaxies for which R-band magnitudes were obtained (open squares). Both the optical and submm fluxes have been K-corrected, and hence represent rest-frame quantities. The errors reflect only uncertainties in the submm flux. The strong evolution of submm luminosities exhibited by these radio galaxies may be a key signature of the star formation history of massive elliptical galaxies which are believed to arise from gas-rich mergers. Thus, they may offer clues to test the evolution hypothesis for the BAL phenomenon. The most striking aspect of the submm–to–optical flux ratios in Figure 2 is that the BALQSOs are substantially less submm luminous than the radio galaxies (relative to their R-band flux). This is most likely due to increased obscuration of the radio galaxy optical nucleus, since the Archibald, et al. (2001) radio galaxies are steep spectrum sources and thus, according to AGN unification schemes, are probably being viewed at large inclinations with respect to their radio axes. Note also that that BALQSOs appear to fall into a similar distribution as the radio galaxies, with higher redshift objects possessing more firm submm detections than the lower redshift objects, for which only upper limits could be obtained. Indeed, this trend prevails in this entire sample of radio galaxies (Archibald, et al., 2001). One final and important point is that there does not appear to be a correlation between the submm and optical fluxes of our BALQSOs (or of the radio galaxies) and the high values of relative to R-band flux is indicative of dust heating by starbursts rather than by the BALQSO nucleus. This is also found to be the case in several other large quasar samples (e.g. McMahon et al. 1999; Isaak et al. 2002 and see also discussion and references in Bertoldi & Cox 2002).
3.1. Selection effects
It is important to examine whether there are any selection biases in our BALQSO sample. The BALQSOs were drawn from quite inhomogeneous surveys; e.g. LBQS 0059-2735 was selected from objective prism plates (Hazard et al., 1987; Weymann, et al., 1991), while Hawaii 167 was found in a spectroscopic followup of K-band sources (Cowie, et al., 1994). Hence, there is no well defined selection function. One possible concern is that the highest redshift sources are intrinsically the most luminous, and thus a correlation between total luminosity and submm luminosity could be responsible for our bimodal detections between high and low redshifts. However, as Fig. 2 demonstrates, there is no evidence for a correlation between the submm and optical luminosities of our BALQSOs. Although dust obscuration may be affecting the submm–to–optical flux ratios, this lack of correlation is also readily seen in larger samples of optically bright quasars (e.g. Isaak et al. 2002 and see also references in Bertoldi & Cox 2002).
4. Discussion & Conclusions
This study suggests that the FIR luminosities, inferred dust masses and star formation rates of BALQSOs are comparable to those of ULIRG-class sources. Whilst this may at first seem consistent with evolutionary models for BALQSOs, two key aspects of these submm properties, namely the trend of submm flux with redshift and the lack of correlation between the submm and optical fluxes, are also seen in samples of non-BAL quasars and radio galaxies (McMahon et al., 1999; Archibald, et al., 2001; Isaak et al., 2002). If, as is proposed in evolutionary scenarios, BAL outflows are a rapid mass-loss phase triggered by a recent gas-rich merger or close interaction event involving vigourous star formation and associated enhanced dust emission, then it is difficult to understand why the submm properties of BALQSOs are similar to those of other AGN. While these dust properties are consistent with qualitative ideas about the role of star formation in the early universe and the evolution of the overall AGN population, they do not suggest that there is anything remarkable about the dust properties of BALQSOs that would be indicative of a connection between the BAL phenomenon and the presence of dust.
If the submm properties of our (albeit small) BALQSO sample are verified by larger samples, how do we then interpret the BAL phenomenon? It is now clear that standard orientation-based models are unable to account for all properties of BALQSOs; radio spectral index and radio axes measurements indicate that many BALQSOs simply cannot be viewed at large inclination angles (Becker et al., 2000). A possible model that can explain the radio properties of BALQSOs is one in which the BAL material resides in a poorly-collimated, weak radio jet (Kuncic, 1999). Such a model can also further explain weak, low-velocity absorption outflows in Seyferts, which are clearly low-luminosity counterparts to the BAL features in quasars. Again, such outflows are difficult to explain with evolution models in which the outflow is triggered by a merger; this is simply not the case for Seyferts with BAL-like outflows.
Owing to the small number of BALQSOs in our sample, our conclusions are tentative and clearly, larger samples are needed in order to verify our results. Ongoing intensive surveys, such as the Sloan Digital Sky Survey, are proving to be very successful in discovering quasars in a relatively unbiased fashion, with the 2dF Quasar Survey now cataloguing almost 17000 quasars (Boyle et al., 2000), providing an ideal basis for such studies.
Acknowledgements
We thank the anonymous referee for comments that improved this paper. Furthermore, we thank the staff of the JCMT for their assistance with the SCUBA observations, and the weather for being so cooperative. GFL thanks the Australian Nuclear Science & Technology Organization (ANSTO) for financial support.
References
- Archibald, et al. (2001) Archibald, E. N., Dunlop, J. S., Hughes, D. H., Rawlings, S., Eales, S. A. & Ivison, R. J. 2001, MNRAS, 323, 417
- Becker et al. (1997) Becker, R. H., Gregg, M. D., Hook, I. M., McMahon, R. G., White, R. L., & Helfand, D. J. 1997, ApJ, 479, L93
- Becker et al. (2000) Becker, R. H., White, R. L., Gregg, M. D., Brotherton, M. S., Laurent-Muehleisen, S. A., & Arav, N. 2000, ApJ, 538, 72
- Belle & Lewis (2000) Belle, K. E. & Lewis, G. F. 2000, PASP, 112, 320
- Bertoldi & Cox (2002) Bertoldi, F. & Cox, P. 2002, A&A, 384, L11
- Blain, Barnard, & Chapman (2003) Blain, A. W., Barnard, V. E., & Chapman, S. C. 2003, MNRAS, 338, 733
- Boroson & Meyers (1992) Boroson, T. A., & Meyers, K. A. 1992, ApJ397, 442
- Boyle et al. (2000) Boyle, B. J., Shanks, T., Croom, S. M., Smith, R. J., Miller, L., Loaring, N., & Heymans, C. 2000, MNRAS, 317, 1014
- Briggs, Turnshek, & Wolfe (1984) Briggs, F. H., Turnshek, D. A., & Wolfe, A. M. 1984, ApJ, 287, 549
- Brotherton et al. (1998) Brotherton, M. S., van Breugel, W., Smith, R. J., Boyle, B. J., Shanks, T., Croom, S. M., Miller, L., & Becker, R. H. 1998, ApJ, 505, L7
- Canalizo & Stockton (2001) Canalizo, G. & Stockton, A. 2001, ApJ, 555, 719
- Chae et al. (2001) Chae K., Turnshek D. A., Schulte-Ladbeck R. E., Rao S. M., Lupie O. L. 2001, ApJ, 561, 653
- Chapman et al. (2000) Chapman, S. C., Scott, D., Steidel C. C., Borys, C., Halpern, M., Morris, S., Adelberger K., Dickinson, M., Giavalisco M. & Pettini, M. 2000, MNRAS, 319, 318
- Cohen et al. (1995) Cohen, M. H., Ogle, P. M., Tran, H. D., Vermeulen, R. C., Miller, J. S., Goodrich, R. W. & Martel, A. R. 1995, ApJ, 448, L77
- Cowie, et al. (1994) Cowie, L. L., et al. 1994, ApJ, 432, L83
- Crenshaw, Kraemer & George (2002) Crenshaw, D. M., Kraemer, S. B., & George, I. M., eds. 2002, ASP Conf. Ser. 255, Mass Outflows in Active Galactic Nuclei: New Persepectives (San Francisco: ASP)
- Egami et al. (1996) Egami, E., Iwamuro, F., Maihara, T., Oya, S. & Cowie, L. L. 1996, AJ, 112, 73
- Goodrich & Miller (1995) Goodrich, R. W.& Miller, J. S. 1995, ApJ, 446, L73
- Hall, et al. (1997) Hall, P. B., Martini, P., Depoy, D. L. & Gatley, I. 1997, ApJ, 484, L17
- Hazard et al. (1987) Hazard C., McMahon R. G., Webb J. K., Morton D. C., 1987, ApJ, 323, 263
- Hewett & Foltz (2003) Hewett, P. C. & Foltz, C. B., 2003, ApJ, 448, L69
- Hines & Wills (1995) Hines, D. C. & Wills, B. J. 1995, ApJ, 125, 1784
- Hughes, Dunlop, & Rawlings (1997) Hughes, D. H., Dunlop, J. S., & Rawlings, S. 1997, MNRAS, 289, 766
- Hutsemekers, Lamy, & Remy (1998) Hutsemekers, D., Lamy, H., & Remy, M. 1998, A&A, 340, 371
- Isaak et al. (2002) Isaak, K. G., Priddey, R. S., McMahon, R. G., Omont, A., Peroux, C., Sharp, R. G., & Withington, S. 2002, MNRAS, 329, 149
- Jenness & Lightfoot (1998) Jenness, T. & Lightfoot, J. F. 1998, ASP Conf. Ser. 145: Astronomical Data Analysis Software and Systems VII, 7, 216
- Kuncic (1999) Kuncic, Z. 1999, PASP, 111, 954
- Lewis & Chapman (2000) Lewis, G. F. & Chapman, S. C. 2000, MNRAS, 318, 31
- Lewis et al. (1998) Lewis, G. F., Chapman, S. C., Ibata, R. A., Irwin, M. J. & Totten, E. J. 1998, ApJ, 505, L1
- McMahon et al. (1999) McMahon, R. G., Priddey, R. S., Omont, A., Snellen, I. & Withington, S. 1999, MNRAS, 309, L1
- Najita et al. (2000) Najita, J., Dey, A. & Brotherton, M. 2000, ApJ, 120, 2859
- Page et al. (2001) Page, M., Stevens, J.A., Mittaz, J.P.D., Carrera, F.J., 2001, Science, 294, 2516
- Priddey et al. (2003) Priddey, R. S., Isaak, K. G., McMahon, R. G., & Omont, A. 2003, MNRAS, 339, 1183
- Reichard et al. (2003) Reichard, T. A. et al. 2003, AJ, 125, 1711
- Richards et al. (2003) Richards, G. T. et al. 2003, astro-ph/0305305
- Sanders et al. (1988) Sanders, D. B., Soifer, B. T., Elias, J. H., Neugebauer, G. & Matthews, K. 1988, ApJ, 328, L35
- Sanders & Mirabel (1996) Sanders, D. B. & Mirabel, I. F. 1996, ARA&A, 34, 749
- Schmidt & Hines (1999) Schmidt, G. D. & Hines, D. C. 1999, ApJ, 512, 125
- Scott et al. (2000) Scott, D., Lagache, G., Borys, C., Chapman, S. C., Halpern, M., Sajina, A., Ciliegi, P., Clements, D. L., Dole, H., Oliver, S., Puget, J.-L., Reach, W. T. & Rowan-Robinson, M. 2000, A&A, 357, L5
- Sprayberry & Foltz (1992) Sprayberry, D. & Foltz, C. B. 1992, ApJ, 390, 39
- Voit, Weymann, & Korista (1993) Voit, G. M., Weymann, R. J., & Korista, K. T. 1993, ApJ, 413, 95
- Weymann, et al. (1991) Weymann, R. J., Morris, S. L., Foltz, C. B., & Hewett, P. C. 1991, ApJ, 373, 23
- Yamamoto & Vansevicius (1999) Yamamoto, T. M. & Vansevicius, V., 1999, PASJ, 51, 405