The 2MASS Wide-Field T Dwarf Search. II. Discovery of Three T Dwarfs in the Southern Hemisphere
Abstract
We present the discovery of three new Southern Hemisphere T dwarfs identified in the Two Micron All Sky Survey. These objects, 2MASS 03486022, 2MASS 05160445, and 2MASS 22284310, have classifications T7, T5.5, and T6.5, respectively. Using linear absolute magnitude/spectral type relations derived from T dwarfs with measured parallaxes, we estimate spectrophotometric distances for these discoveries; the closest, 2MASS 03486022, is likely within 10 pc of the Sun. Proper motions and estimated tangential velocities are consistent with membership in the Galactic disk population. We also list Southern Hemisphere T dwarf candidates that were either not found in subsequent near-infrared imaging observations and are most likely uncatalogued minor planets, or have near-infrared spectra consistent with background stars.
1 Introduction
T dwarfs are substellar objects whose near-infrared spectra exhibit characteristic signatures of H2O and CH4 (Burgasser et al., 2002; Geballe et al., 2002). They comprise the coolest class of brown dwarfs currently known, with effective temperatures Teff 1300–1500 K (Burgasser et al., 2002; Dahn et al., 2002, and references therein). Their atmospheric properties are therefore quite similar to class III and IV extra-solar giant planets (EGPS; Sudarsky, Burrows, & Pinto 2000), but are more easily studied without the obscuration of a bright host star. Indeed, EGP atmospheric models have advanced in parallel with isolated brown dwarf models, as the latter differ only in the absence of an external radiating source (Seager & Sasselov, 1998, 2000; Sudarsky, Burrows, & Pinto, 2000; Baraffe et al., 2003). The observed properties of T dwarfs have served to constrain these models. The currently known collection of nearby T dwarfs are also useful for studies of the substellar population in the Solar Neighborhood and the substellar initial mass function (Burgasser, 2001). Finally, as these objects do not significantly process their initial Hydrogen supply to heavier metals111Exhaustive Deuterium and Lithium burning occur in Solar metallicity brown dwarfs more massive than 0.013 and 0.065 M☉, respectively (Burrows et al., 2001)., they may be used as a tracer population of the chemical history of the Galaxy, as long as temperature, gravity, and metallicity diagnostics can be disentangled.
We have initiated a wide-field search for T dwarfs in the Two Micron All Sky Survey (Skrutskie et al., 1997, hereafter 2MASS), as described in Burgasser et al. (2003b, hereafter Paper I). 2MASS, which covers the entire sky, is an ideal survey for finding T dwarfs in the Solar Neighborhood, as the spectral energy distributions of these objects peak in the J, H, and Ks photometric bands sampled by the survey. The optical/near-infrared colors of T dwarfs are also extremely red (; Golimowski et al. 1998); hence, photographic plate surveys, which also cover the whole sky, cannot detect T dwarfs much farther than a few parsecs from the Sun (Scholz et al., 2003). 2MASS is particularly useful for finding T dwarfs in the Southern Hemisphere, as it is more sensitive than the Deep Near-Infrared Survey of the Southern Sky (Epchtein et al., 1997), and there is as yet no equivalent to the Sloan Digital Sky Survey (York et al., 2000, hereafter SDSS) at southern latitudes.
In this article, we present the discovery of three new T dwarfs in the Southern Hemisphere, 2MASS 03486022, 2MASS 05160445, and 2MASS 22284310222Throughout the text, we adopt shorthand notation for 2MASS and SDSS sources, 2MASS/SDSS hhmmddmm. Full designations are listed in Tables 1–3.. In 2 we review the identification of these T dwarfs through confirmation imaging and spectroscopic observations obtained using the Ohio State InfraRed Imager/Spectrometer (Depoy et al., 1993, hereafter OSIRIS), mounted on the CTIO 4m Blanco Telescope. In 3, we analyze the spectra of these and three other previously identified T dwarfs, 2MASS 02432453, 2MASS 04150935, and SDSS 04230414 (Burgasser et al., 2002; Geballe et al., 2002), also observed with OSIRIS. Including the latter sources into a suite of spectral standards, we classify the new T dwarfs and estimate their spectrophotometric distances. We also examine the kinematics of the three discoveries. Results are summarized in 4.
2 Observations of T Dwarf Candidates
2.1 Imaging Observations
Selection of T dwarf candidates from the 2MASS Working Point Source Database (WPSD) are discussed in detail in Paper I. Our color constraints – or , and no optical counterpart in the USNO A2.0 catalogue (Monet et al., 1998) or visible on Digitized Sky Survey (DSS) plates – result in some contamination by asteroids, as discussed in Burgasser et al. (2002). We specifically exclude objects associated with known minor planets in the 2MASS catalog, but uncatalogued ones are likely to be present. To eliminate these sources, we imaged a subset of our candidate pool with OSIRIS in the J-band during 20–24 September 2002 (UT). Conditions during this period ranged from clear and dry (20 and 24 September) to light cirrus and clouds (21–23 September), and seeing was poor () on 20 and 23 September but excellent () on the remaining nights. Pairs of 15 sec integrations were obtained for each object, dithered 10–20 between exposures. The sensitivity of these images was verified to be greater than that of the 2MASS survey, which has a J-band S/N = 10 completeness limit of 15.8 (Cutri et al., 2003), implying that any stationary sources should have been recovered.
As in Burgasser et al. (2002), a number of sources were not seen in the OSIRIS images; these are listed in Table 1, with updated designations and photometry from the 2MASS All Sky Data Release (Cutri et al., 2003, hereafter, 2MASS ADR). A few sources were identified as unflagged image artifacts arising from electronic feedback in the quadrant readout of the 2MASS NICMOS3 detectors (“star echo”; see sect. IV.7 in Cutri et al. 2003). Eleven sources were subsequently identified as known minor planets by searching a region around the positions of each unconfirmed source at the corresponding epoch of observation in the Small Body catalog maintained by the Jet Propulsion Laboratory Solar System Dynamics Group333Asteroid identifications were made using the Small-Body Search Tool, http://ssd.jpl.nasa.gov/cgi-bin/sb{_}search.. We note that about half of these 2MASS asteroid detections precede their discovery. It is logical, therefore, that most of the remaining unconfirmed sources are uncatalogued minor planets, given that their near-infrared colors closely match those of known asteroids (Sykes et al., 2002) and that they are generally found at low ecliptic latitudes. Curiously, a handful of these probable minor planets are found at relatively high ecliptic latitudes, . We cannot rule out the possibility of any of these sources being eruptive or otherwise variable events.
2.2 Spectroscopic Observations
For sources that reappeared in the OSIRIS images, we obtained spectra during the same run using the OSIRIS cross-dispersed gratings. Use of the single diffraction grating blazed at 6.6 with the 120 lines mm-1 grating and f/2.8 camera provides simultaneous, moderate resolution (/ 1200) spectroscopy from 1.2–2.35 in four orders: J (5rd and 6th), H (4th), and K (3th). Resolution on the 0403 pixel-1 chip ranges from 4.4 to 8.8 Å pixel-1.
Table 2 summarizes the observations, which also included three known T dwarfs: 2MASS 02432453, 2MASS 04150935, and SDSS 04230414 (Burgasser et al., 2002; Geballe et al., 2002). Targets were acquired in imaging mode and placed into a 12 30 slit. Observations were made in sets of 5 exposures dithered 4–5 along the slit, with individual integrations of 300 sec per exposure. B and A dwarf stars, chosen for their lack of metal lines at moderate resolution, were observed near the target objects for flux calibration and telluric corrections. Spectral lamps reflected off of the 4m dome spot were observed each night for pixel response calibration, and a series of dark frames with identical exposure times as the spectral flats were also obtained to remove detector bias.
Data reduction consisted of initially trimming the science images to eliminate vignetted regions; dividing by a normalized, dark-subtracted flat field (constructed from a median combination of the spectral lamp and bias exposures); and correcting for bad pixels by interpolation, using a mask created from flat-field and bias frames. Images were then pairwise subtracted to eliminate sky background and dark current. Curvature of the dispersion lines was determined by tracing the spectra of the standard stars, and this trace was used as a template for the target spectra. Both standard and object spectra were extracted by summing 8–12 columns (depending on seeing conditions) along each row after subtracting off the median background in that row. Individual spectra from each order were then scaled by a multiplicative factor and combined by averaging, rejecting 3 outliers in each spectral bin. Wavelength calibration was done with the telluric OH lines, using identifications from Olivia & Origlia (1992). A telluric correction was computed for each target/standard pair by interpolating over H2O absorption features in the standard star spectra and ratioing these spectra with the uncorrected standard spectra. A smoothed flux correction was then calculated by interpolating over Hydrogen Paschen and Brackett lines in the telluric-corrected standard spectra and multiplying by the appropriate blackbody (Tokunaga, 2000). Finally, the flux-calibrated spectral orders were combined by first scaling each order to match overlap regions (typically 1.28–1.30, 1.53–1.55, and 1.95–1.97 ), and then correcting the combined spectra to 2MASS H-band magnitudes. Note that the overlap between the H- and K-band orders falls within the 1.9 H2O band; because of this, we generally applied the same scaling corrections to both orders.
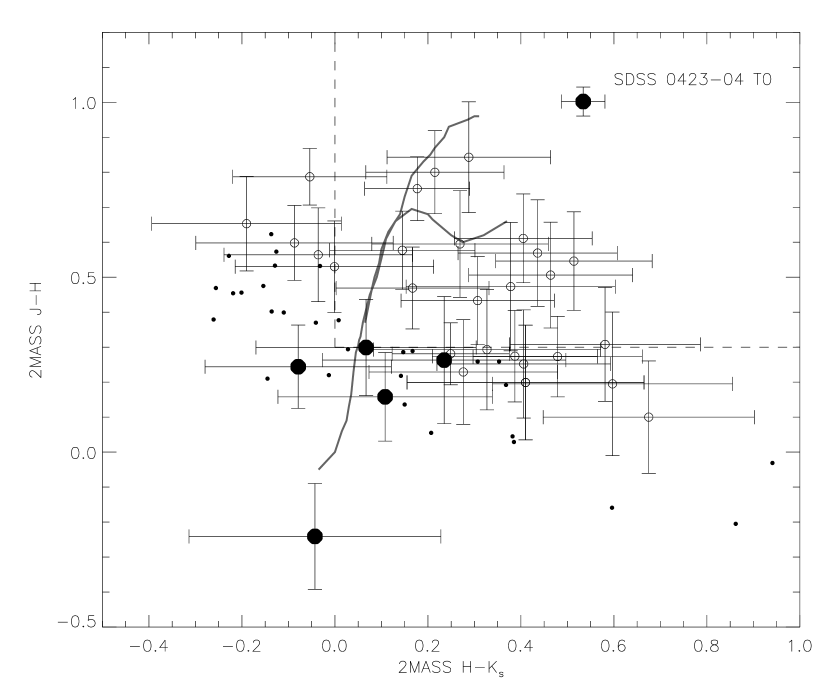
The majority of sources observed appear to be late-type (KM) background stars based on the presence of weak H2O absorption and relatively featureless H-band spectra. This is consistent with their positions on the near-infrared color-color diagram in Figure 1 (which plots revised photometry from the 2MASS ADR444The ADR colors for many of our candidates are outside of our original search constraints, which are based on 2MASS WPSD data. These differences are due to the improved photometric calibration of 2MASS J-band data in the ADR, which compensates for short (hourly) variations in telluric opacity that influence the broad J-band filter employed in this survey. See Cutri et al. (2003) for further details.), within the substantial color uncertainties; c.f., the M dwarf and giant tracks of Bessell & Brett (1988). Furthermore, their faint magnitudes (15.5 16) imply optical/near-infrared color limits ( 4–5, based on no detection in DSS photographic plates; Reid et al. 1991) consistent with late-type stars. In some cases these identifications were confirmed spectroscopically by comparison to near-infrared data of known M dwarfs obtained in prior OSIRIS campaigns (Burgasser et al., 2002). None of the brighter background objects appear to be L dwarfs based on similar comparisons. Adequate spectral comparison for many of the spectra was not possible, however, due to low signal-to-noise ratio data ( 5-10 at J-band in the worst cases), although it is clear that these faint objects are not T dwarfs. We forego detailed classification of background sources as it is beyond the scope of this paper, and identify them simply as late-type stars. We do, however, identify one candidate, 2MASS 20051056, as LHS 483, a DC9 white dwarf (McCook & Sion, 1999, and references therein) with substantial proper motion ( = 108 yr-1; Luyten 1979). This object was not initially recognized as a background proper motion star because of the small epoch difference between the available DSS plates (2.1 yrs555We note that Bakos, Sahu, & Németh (2002) derive yr-1 for LHS 483 but cite the value as highly uncertain because of the small DSS epoch difference. From our imaging observations and 2MASS data (see 3.4) we derive yr-1, roughly consistent with Luyten’s measurement.). A second source, 2MASS 05330633, appears to be a reddened, mid- to late-type M dwarf based on its somewhat stronger H2O bands, weak 1.23 FeH absorption, 1.25 K I doublet lines, and red near-infrared spectral slope. This source is also aligned with a small molecular clump just south of the Orion Nebular Cloud (Bally et al., 1987; Carpenter, 2001, ONC). Its late-type dwarf spectrum and proximity to the 1–2 Myr ONC star-forming region (Hillenbrand, 1997) suggests that it could be a young brown dwarf.
3 New T Dwarfs
3.1 Spectral Analysis
We spectroscopically confirm three objects as T dwarfs: 2MASS 03486022, 2MASS 05160445, and 2MASS 22284310. Astrometric and photometric properties are listed in Table 3, and 2MASS and DSS images of each source (55 field) are shown in Figure 2. Calibrated spectral data are shown in Figure 3, along with data for 2MASS 02432453, 2MASS 04150935, and SDSS 04230414. Note that data for 2MASS 03486022 and 2MASS 05160445 have been combined from multiple nights to improve signal-to-noise. All six T dwarfs show distinct CH4 bands at 1.1, 1.3 (blue and red slopes of the 1.27 J-band peak), 1.6, and 2.2 ; H2O bands at 1.3 and 1.7 ; and K I absorption lines at 1.2432 and 1.2522 . The spectrum of SDSS 04230414 shows some indication of CO absorption at 2.3 . The strength of the CH4 and H2O bands in the three new discoveries are consistent with late-type T dwarfs (Burgasser et al., 2002; Geballe et al., 2002).
Figure 4 displays the 1.19 to 1.33 region of the spectra in Figure 3, highlighting the 1.2432/1.2522 K I doublet lines. These lines are prominent in early- and mid-type T dwarf spectra (as well as late-type M and L dwarfs), peaking in strength around spectral type T5–T5.5, then fading in the later dwarfs (Burgasser et al., 2002). We measured pseudo-equivalent widths666The presence of overlying opacity throughout the near-infrared prevents the measurement of “true continuum” for computing equivalent widths; hence, the reported measurements are relative to the local, or “pseudo”-continuum. (pEWs) for these lines by integrating over the line profiles; see Burgasser et al. (2002). Results are listed in Table 4. Values decrease monotonically from roughly 12 to 4 Å for the 1.2432 line and 16 to 6.5 Å for the 1.2522 line over spectral types T5.5 to T7, consistent with previously observed trends. Upper pEW limits of roughly 2 Å are found for the K I lines of the latest-type T dwarf 2MASS 04150935.
3.2 Classification
We derived spectral types for the three discoveries using the classification scheme of Burgasser et al. (2002). The top of Table 5 lists spectral ratio values of observed T dwarf standards, including new measurements for SDSS 04230414, 2MASS 02432453, and 2MASS 04150935 (our T0, T6, and T8 standards, respectively), and measurements using OSIRIS data for SDSS 12540122 (Leggett et al., 2000, T2), 2MASS 05590414 (Burgasser et al., 2000b, T5), and 2MASS 0727+1710 (Burgasser et al., 2002, T7) from Burgasser et al. (2002). We make use of the H2O-B, CH4-A, and CH4-B indices only, due to the wavelength limits of the spectral data (obviating the the H2O-A index), poor signal-to-noise at K-band (obviating the CH4-C, and 2.11/2.07 indices) and possible uncertainties in the individual band calibration (obviating the H/J and K/J color indices). As can be seen in Table 5, the three remaining indices are monotonic with spectral type for the standards.
Spectral ratios of our discoveries are listed at the bottom of Table 5. For each ratio, we assigned a whole or half subtype based on the closest match to the standard values. Final subtypes were derived from the average of these individual ratio types, which for each object differ by less than 1 subclass. Furthermore, individual spectra for 2MASS 03486022 and 2MASS 05160445 obtained on separate nights yield identical types within 0.5 subclasses. Therefore, we assert that our classifications are accurate to within 0.5 subclasses despite the limited suite of spectral ratios employed. Derived spectral types are T7 for 2MASS 03486022, T5.5 for 2MASS 05160445, and T6.5 for 2MASS 22284310. These mid- to late-type classifications are consistent with their relatively blue near-infrared colors.
3.3 Distance Estimates
Distance estimates for our new discoveries can be made using their spectral types, 2MASS photometry, and the absolute magnitudes of T dwarfs with measured parallaxes. We first compared 2MASS MJ, MH, and M versus spectral type (SpT) for T dwarfs typed T5 and later using parallax data from Dahn et al. (2002); Tinney, Burgasser, & Kirkpatrick (2003); and F. Vrba (2002, private communication). Excluding the known binaries 2MASS 12252739AB and 2MASS 15342952AB (Burgasser et al., 2003c) and Gliese 229B (Nakajima et al. 1995; not detected by 2MASS), we derive the following linear relations over the range T5 to T8:
| (1) |
where SpT(T5) = 5, SpT(T8) = 8, etc. Based on these relations, we derived distance estimates for each source in each band assuming spectral type uncertainties of 0.5 subclasses. The mean distances and standard deviations are 94, 3413, and 124 pc for 2MASS 03486022, 2MASS 05160445, and 2MASS 22284310, respectively. It is not surprising that the first object, which has the latest classification and brightest apparent magnitudes, is likely to be less than 10 pc from the Sun, unless it is an unresolved multiple system. However, parallax observations are required to verify these rather uncertain estimates.
3.4 Proper Motions
Proper motions for the T dwarf discoveries were measured between the 2MASS and follow-up OSIRIS images following the technique of Burgasser et al. (2003a). First, astrometric calibrations of each OSIRIS field, of the form
| (2) |
( and are pixel coordinates on the OSIRIS images) were made by linear regression using the 2MASS coordinates of 6–8 background sources within 25 of each T dwarf. Background sources were verified to show consistent positions between the two epochs (which span 3.1–4.1 yr) to within three times the astrometric fit uncertainties, roughly 005–01. Positions for the T dwarfs on the OSIRIS images were then calculated and compared to the original 2MASS coordinates.
Results are listed in Table 3. As expected from their relative proximity, all of these sources have statistically significant proper motions. Their tangential velocities () are relatively modest, however, ranging from 17 to 55 km s-1. These values are similar to the median for disk dwarfs (39 km s-1; Reid & Hawley 2000) and comparable to or less than the median for field late-type M and L dwarfs (22 km s-1; Gizis et al. 2000). Hence, the kinematics of these three T dwarfs are consistent with, but not restricted to, membership in the Galactic disk.
4 Summary
We have identified three new southern T dwarfs using the 2MASS survey. These objects are important additions to the sample of nearby stars and brown dwarfs; indeed, one object, if it is single, is likely to be closer than 10 pc from the Sun. Spectroscopic observations yield classifications ranging from T5.5 to T7, and measured K I pEWs support the observed trend of decreasing line strength with spectral type for mid- to late-type T dwarfs. All three objects have small to moderate proper motions and tangential velocities, consistent with membership in the Galactic disk. With roughly 70% of the Southern Hemisphere portion of our 2MASS T Dwarf search sample now completed and 13 T dwarfs so far identified (Burgasser et al., 1999, 2000a, 2000b, 2002), we expect to uncover another 5–6 mid- to late-type T dwarfs over the remaining portion of this part of the sky to .
References
- Bakos, Sahu, & Németh (2002) Bakos, G. Á., Sahu, K. C., & Németh, P. 2002, ApJS, 141, 187
- Bally et al. (1987) Bally, J., Stark, A. A., Wilson, R. W., & Langer, W. D. 1987, ApJ, 312, L45
- Baraffe et al. (2003) Baraffe, I., Chabrier, G., Barman, T., Allard, F., & Hauschildt, P. H. 2003, A&A, in press (astro-ph/0302293)
- Bessell & Brett (1988) Bessell, M. S., & Brett, J. M. 1988, PASP, 100, 1134
- Burgasser (2001) Burgasser, A. J. 2001, Ph.D. Thesis, California Institute of Technology
- Burgasser et al. (2003a) Burgasser, A. J., Kirkpatrick, J. D., Burrows, A., Liebert, J., Reid, I. N., Gizis, J. E., McGovern, M. R., Prato, L., & McLean, I. S. 2003a, ApJ, 592, in press (astro-ph/0304174)
- Burgasser et al. (2003b) Burgasser, A. J., Kirkpatrick, J. D., McElwain, M. W., Cutri, R. M., Burgasser, A. J., & Skrutskie, M. F. 2003b, AJ, 125, 850 (Paper I)
- Burgasser et al. (2003c) Burgasser, A. J., Kirkpatrick, J. D., Reid, I. N., Brown, M. E., Miskey, C. L., & Gizis, J. E. 2003c, ApJ, 586, 512
- Burgasser et al. (1999) Burgasser, A. J., et al. 1999, ApJ, 522, L65
- Burgasser et al. (2000a) —. 2000a, ApJ, 531, L57
- Burgasser et al. (2000b) —. 2000b, AJ, 120, 1100
- Burgasser et al. (2002) —. 2002, ApJ, 564, 421
- Burrows et al. (2001) Burrows, A., Hubbard, W. B., Lunine, J. I., & Liebert, J. 2001, Rev. of Modern Physics, 73, 719
- Burrows et al. (1997) Burrows, A., et al. 1997, ApJ, 491, 856
- Carpenter (2001) Carpenter, J. M. 2001, AJ, 120, 3139
- Cutri et al. (2003) Cutri, R. M., et al. 2003, Explanatory Supplement to the 2MASS All Sky Data Release, http://www.ipac.caltech.edu/2mass/releases/allsky/doc/explsup.html
- Dahn et al. (2002) Dahn, C. C., et al. 2002, AJ, 124, 1170
- Depoy et al. (1993) Depoy, D. L., Atwood, B., Byard, P. L., Frogel, J., & O’Brien, T. P. 1993, in Proceedings of SPIE, Vol. 1946, ed. A. M. Fowler (Bellingham: SPIE), 667
- Epchtein et al. (1997) Epchtein, N., et al. 1997, The Messenger, 87, 27
- Geballe et al. (2002) Geballe, T. R., et al. 2002, ApJ, 564, 466
- Gizis et al. (2000) Gizis, J. E., Monet, D. G., Reid, I. N., Kirkpatrick, J. D., Liebert, J., & Williams, R. 2000, AJ, 120, 1085
- Golimowski et al. (1998) Golimowski, D. A., Burrows, C. S., Kulkarni, S. R., Oppenheimer, B. R., & Brukardt, R. A. 1998, AJ, 115, 2579
- Hillenbrand (1997) Hillenbrand, L. A. 1997, AJ, 113, 1733
- Kirkpatrick et al. (2000) Kirkpatrick, J. D., Reid, I. N., Liebert, J., Gizis, J. E., Burgasser, A. J., Monet, D. G., Dahn, C. C., Nelson, B., & Williams, R. J. 2000, AJ, 120, 447
- Leggett et al. (2001) Leggett, S. K., Allard, F., Geballe, T., Hauschildt, P. H., & Schweitzer, A. 2001, ApJ, 548, 908
- Leggett et al. (2000) Leggett, S. K., et al. 2000, ApJ, 536, L35
- Luyten (1979) Luyten, W. J. 1979, LHS Catalogue: A Catalogue of Stars with Proper Motions Exceeding 05 Annually (Minneapolis: Univ. Minn. Press)
- McCook & Sion (1999) McCook, G. P., & Sion, E. M. 1999, ApJS, 121, 1
- Monet et al. (1998) Monet, D. G., et al. 1998, USNO-A2.0 Catalog (Flagstaff: USNO)
- Nakajima et al. (1995) Nakajima, T., Oppenheimer, B. R., Kulkarni, S. R., Golimowski, D. A., Matthews, K., & Durrance, S. T. 1995, Nature, 378, 463
- Olivia & Origlia (1992) Olivia, E., & Origlia, L. 1992, A&A, 254, 466
- Pavlenko, Zapatero Osorio, & Rebolo (2000) Pavlenko, Ya., Zapatero Osorio, M. R., & Rebolo, R. 2000, A&A, 355, 245
- Reid & Hawley (2000) Reid, I. N., & Hawley, S. L. 2000, New Light on Dark Stars (Chichester: Praxis)
- Reid et al. (1991) Reid, I. N., et al. 1991, PASP, 103, 661
- Sanchez-Lavega (2001) Sanchez-Lavega, A. 2001, A&A, 377, 354
- Scholz et al. (2003) Scholz, R.-D., McCaughrean, M. J., Lodieu, N., & Kuhlbrodt, B. 2003, A&A, 398, L29
- Seager & Sasselov (1998) Seager, S., & Sasselov, D. D. 1998, ApJ, 502, L157
- Seager & Sasselov (2000) —. 2000, ApJ, 537, 916
- Skrutskie et al. (1997) Skrutskie, M. F., et al. 1997, in The Impact of Large-Scale Near-IR Sky Surveys, ed. F. Garzon (Dordrecht: Kluwer), p. 25
- Stephens et al. (2001) Stephens, D. C., Marley, M. S., Noll, K. S., & Chanover, N. 2001, ApJ, 556, L97
- Strom, Strom, & Merrill (1993) Strom, K. M., Strom, S. E., & Merrill, K. M. 1993, ApJ, 412, 233
- Sudarsky, Burrows, & Pinto (2000) Sudarsky, D., Burrows, A., & Pinto, P. 2000, ApJ, 538, 885
- Sykes et al. (2002) Sykes, M. V., Cutri, R. M., Fowler, J. W., Nelson, B., Tholen, D. J., Skrutskie, M. F., & Price, S. 2002, in Proceedings of the ACM 2002 Conference, ed. B. Warmbein, ESA-SP-500, p. 481
- Tinney, Burgasser, & Kirkpatrick (2003) Tinney, C. G., Burgasser, A. J., & Kirkpatrick, J. D. 2003, AJ, in press (astro-ph/0304339)
- Tokunaga (2000) Tokunaga, A. T. 2000, in Allen’s Astrophysical Quantities, Fourth Edition, ed. A. N. Cox (New York: Springer-Verlag), p. 151
- York et al. (2000) York, D. G., et al. 2000, AJ, 120, 1579
| 2MASS ObservationsbbPhotometry from the 2MASS ADR; note that some objects have revised photometry placing them outside of our original WPSD search constraints. | ||||||
|---|---|---|---|---|---|---|
| ObjectaaAll objects are listed with their 2MASS ADR Point Source Catalog source designations, given as “2MASS Jhhmmss[.]ssddmmss[.]s”. The suffix conforms to IAU nomenclature convention and is the sexagesimal Right Ascension and declination at J2000 equinox. | () | UT Date | IdentificationccAsteroid identifications are from the Small-Body Search Tool maintained by the Jet Propulsion Laboratory Solar System Dynamics Group: http://ssd.jpl.nasa.gov/cgi-bin/sb{_}search. | |||
| (1) | (2) | (3) | (4) | (5) | (6) | (7) |
| 2MASS J013158761259435 | 21 | 2000 Oct 23 | 15.860.07 | 0.140.16 | 0.150.24 | |
| 2MASS J013925450258486 | 12 | 1998 Sep 23 | 15.680.06 | 0.460.12 | 0.200.20 | 2001 KY8 |
| 2MASS J014325501240101 | 22 | 2000 Oct 10 | 15.790.07 | 0.400.11 | 0.140.21 | |
| 2MASS J014923651945149 | 29 | 1998 Aug 10 | 15.530.05 | 0.290.09 | 0.150.14 | |
| 2MASS J015429691258435 | 23 | 1998 Aug 20 | 15.500.05 | 0.530.08 | 0.130.16 | 2000 EY156 |
| 2MASS J02061785+0456321 | 7 | 2000 Nov 27 | 15.960.08 | 0.060.21 | 0.210.28 | 2000 SX124 |
| 2MASS J02100930+0908316 | 4 | 2000 Sep 28 | 15.760.06 | 0.370.11 | 0.040.22 | |
| 2MASS J022535365539594 | 63 | 1999 Oct 27 | 15.300.08 | 0.200.16 | 0.86 | Image artifact |
| 2MASS J025256748020549 | 72 | 2000 Oct 04 | 15.830.10 | 0.030.21 | 0.94 | Image artifact |
| 2MASS J030145296055462 | 70 | 1999 Nov 11 | 15.330.10 | 0.440.21 | 1.37 | Image artifact |
| 2MASS J031848194216275 | 57 | 1999 Sep 26 | 15.140.09 | 0.900.24 | 0.86 | Image artifact |
| 2MASS J032959505446545 | 69 | 1999 Nov 02 | 15.380.11 | 0.170.22 | 1.34 | Image artifact |
| 2MASS J03451647+1132394 | 8 | 2000 Nov 25 | 15.770.07 | 0.570.11 | 0.130.17 | 1990 QB3 |
| 2MASS J03594765+1341458 | 7 | 1998 Nov 17 | 15.510.06 | 0.470.09 | 0.150.16 | |
| 2MASS J190845333352087 | 11 | 2000 Jul 20 | 15.860.06 | 0.260.13 | 0.310.19 | |
| 2MASS J191830273427382 | 12 | 1998 Jul 25 | 15.630.05 | 0.030.14 | 0.390.20 | |
| 2MASS J192317784832099 | 26 | 2000 Oct 12 | 15.710.09 | 0.160.22 | 0.60 | Image artifact |
| 2MASS J192430274332438 | 21 | 1999 Jul 14 | 15.960.09 | 0.260.18 | 0.350.22 | 1996 TP34 |
| 2MASS J192635113435565 | 13 | 1998 Jul 26 | 15.890.09 | 0.050.21 | 0.380.29 | |
| 2MASS J193559722923351 | 8 | 1998 Jul 05 | 15.910.09 | 0.220.17 | 0.010.28 | |
| 2MASS J194924523201418 | 11 | 2000 Aug 10 | 15.660.06 | 0.530.11 | 0.030.17 | 2001 RZ |
| 2MASS J195300533512193 | 14 | 1999 Jul 15 | 15.520.06 | 0.470.09 | 0.260.15 | |
| 2MASS J201531002958197 | 10 | 1998 Aug 10 | 15.090.03 | 0.290.07 | 0.170.12 | |
| 2MASS J201808553250195 | 13 | 1999 Sep 26 | 15.800.07 | 0.210.14 | 0.150.28 | |
| 2MASS J202039533414209 | 14 | 1999 Jun 13 | 15.890.09 | 0.220.16 | 0.140.25 | |
| 2MASS J203422443748127 | 18 | 1998 Sep 08 | 15.830.06 | 0.400.11 | 0.110.21 | 1989 TR2 |
| 2MASS J203523623858012 | 20 | 1998 Sep 08 | 15.800.05 | 0.450.10 | 0.220.21 | |
| 2MASS J204646562831162 | 10 | 2000 Jul 24 | 15.380.05 | 0.290.09 | 0.030.14 | |
| 2MASS J204932834532443 | 27 | 1999 Jul 26 | 15.970.07 | 0.190.15 | 0.370.22 | |
| 2MASS J204955543525083 | 17 | 1999 Sep 09 | 15.960.09 | 0.270.15 | 0.240.21 | |
| 2MASS J205144643123264 | 13 | 1999 Jul 09 | 15.930.06 | 0.380.11 | 0.260.27 | |
| 2MASS J205337683227270 | 14 | 1998 Aug 20 | 15.600.06 | 0.620.09 | 0.140.14 | 1999 XN168 |
| 2MASS J205721073304186 | 15 | 1998 Aug 20 | 16.000.07 | 0.560.14 | 0.230.23 | |
| 2MASS J210350852237412 | 6 | 2000 Aug 06 | 15.460.05 | 0.250.10 | 0.050.16 | |
| 2MASS J210507533122506 | 14 | 1998 Aug 20 | 15.710.05 | 0.390.10 | 0.020.18 | |
| 2MASS J210545153542535 | 18 | 1998 Aug 20 | 15.670.04 | 0.580.08 | 0.010.13 | |
| 2MASS J210902013725168 | 20 | 1999 Aug 12 | 15.530.08 | 0.180.14 | 0.380.18 | |
| 2MASS J211138384133320 | 24 | 1999 Sep 10 | 15.740.06 | 0.370.11 | 0.060.19 | |
| 2MASS J211653493325598 | 17 | 1998 Aug 15 | 15.800.06 | 0.430.14 | 0.090.22 | 1999 WA1 |
| 2MASS J211708632441328 | 8 | 1998 Aug 04 | 15.380.05 | 0.490.07 | 0.020.12 | 2001 FP26 |
| 2MASS J211837942813093 | 12 | 1998 Aug 04 | 15.850.06 | 0.570.11 | 0.070.19 | |
| 2MASS J212858844249292 | 26 | 1999 Aug 20 | 15.460.06 | 0.390.08 | 0.020.14 | |
| 2MASS J214133322453233 | 10 | 1998 Aug 12 | 15.730.06 | 0.390.09 | 0.160.16 | |
| 2MASS J220501712658019 | 14 | 2000 Jul 24 | 15.410.05 | 0.270.08 | 0.190.16 | |
| 2MASS J221545872605584 | 14 | 2000 Jul 24 | 15.530.05 | 0.290.09 | 0.040.15 | |
| 2MASS J221653102656329 | 15 | 1998 Jul 31 | 15.430.06 | 0.050.13 | 0.090.20 | |
| 2MASS J223113963417156 | 23 | 2000 Jul 24 | 14.530.03 | 0.290.05 | 0.000.07 | |
| 2MASS J223850565456370 | 42 | 2000 Aug 02 | 15.980.09 | 0.130.19 | 0.210.27 | |
| 2MASS J224202193346098 | 24 | 1999 Jul 26 | 15.560.05 | 0.430.09 | 0.100.17 | 1997 YZ3 |
| 2MASS J225411374826135 | 38 | 1999 Sep 21 | 15.970.08 | 0.140.13 | 0.350.23 | |
| Object | aaPhotometry from the 2MASS ADR; note that some objects have revised photometry outside of our original WPSD search constraints. | aaPhotometry from the 2MASS ADR; note that some objects have revised photometry outside of our original WPSD search constraints. | UT Date | t (s) | Airmass | Calibrator | SpT | Identification |
|---|---|---|---|---|---|---|---|---|
| (1) | (2) | (3) | (4) | (5) | (6) | (7) | (8) | (9) |
| 2MASS J002317183346366 | 16.010.08 | 0.610.23 | 2002 Sep 23 | 1500 | 1.00 | HD 6619 | A1 V | Late-type star |
| 2MASS J020536850853442 | 15.890.06 | 0.730.17 | 2002 Sep 20 | 1500 | 1.09 | HD 13936 | A0 V | Late-type star |
| 2MASS J024313712453298 | 15.380.05 | 0.160.17 | 2002 Sep 24 | 1500 | 1.04 | HD 20293 | A5 V | T6 standard |
| 2MASS J024853564951573 | 16.140.12 | 1.130.19 | 2002 Sep 22 | 1500 | 1.14 | HD 17098 | B9 V | Reddened star |
| 2MASS J025123933842100 | 15.950.08 | 0.780.19 | 2002 Sep 22 | 1500 | 1.03 | HD 17098 | B9 V | Late-type star |
| 2MASS J025607854311108 | 15.690.06 | 0.750.17 | 2002 Sep 24 | 1500 | 1.04 | HD 20293 | A5 V | Late-type star |
| 2MASS J031640476202104 | 15.850.08 | 1.020.14 | 2002 Sep 22 | 1500 | 1.19 | HD 22252 | B8 V | Late-type star |
| 2MASS J034807726022270 | 15.320.06 | 0.280.24 | 2002 Sep 21 | 1500 | 1.19 | HD 24863 | A4 V | T dwarf |
| 2MASS J041436476916594 | 15.720.07 | 0.890.16 | 2002 Sep 24 | 1500 | 1.31 | HD 37935 | B9.5 V | Late-type star |
| 2MASS J041519540935066 | 15.700.06 | 0.270.21 | 2002 Sep 24 | 1500 | 1.08 | HD 28763 | A2/3 V | T8 standard |
| SDSSp J042348.57041403.5 | 14.470.03 | 1.540.04 | 2002 Sep 23 | 1500 | 1.29 | HD 30321 | A2 V | T0 standard |
| 2MASS J051609450445499 | 15.980.09 | 0.500.22 | 2002 Sep 21 | 1500 | 1.12 | HD 33948 | B5 V | T dwarf |
| 2002 Sep 22 | 1500 | 1.11 | HD 37303 | B1 V | ||||
| 2002 Sep 24 | 1500 | 1.11 | HD 28763 | A2/3 V | ||||
| 2MASS J053359730633098 | 15.760.06 | 0.930.10 | 2002 Sep 22 | 1500 | 1.16 | HD 37303 | B8 V | Reddened M dwarfbbCandidate young brown dwarf in the Orion A complex (Strom, Strom, & Merrill, 1993; Carpenter, 2001). |
| 2MASS J170657530428539 | 15.960.09 | 0.530.20 | 2002 Sep 23 | 1500 | 1.38 | HD 159170 | A5 V | Late-type star |
| 2MASS J18031154+1305281 | 16.030.09 | 0.850.18 | 2002 Sep 22 | 3000 | 1.52 | HD 171975 | B9 V | Late-type star |
| 2MASS J190922678234478 | 15.520.06 | 0.740.13 | 2002 Sep 22 | 1500 | 1.67 | HD 169904 | B8 V | Late-type star |
| 2MASS J192157776303224 | 15.620.05 | 0.660.14 | 2002 Sep 20 | 3000 | 1.21 | HD 186837 | B5 V | Late-type star |
| 2MASS J193008784435012 | 15.960.08 | 1.060.14 | 2002 Sep 21 | 1500 | 1.03 | HD 176425 | A0 V | Late-type star |
| 2MASS J193222826835592 | 16.000.09 | 0.970.16 | 2002 Sep 24 | 1500 | 1.28 | HD 184586 | A1 V | Late-type star |
| 2MASS J193256194851162 | 15.990.09 | 1.010.15 | 2002 Sep 23 | 1500 | 1.25 | HD 189388 | A2/3 V | Late-type star |
| 2MASS J193839092735379 | 15.970.08 | 0.620.21 | 2002 Sep 21 | 1500 | 1.02 | HD 176425 | A0 V | Late-type star |
| 2MASS J193948925531025 | 15.870.08 | 0.510.18 | 2002 Sep 20 | 1500 | 1.19 | HD 186837 | B5 V | Late-type star |
| 2MASS J194655713644491 | 15.580.07 | 0.720.14 | 2002 Sep 21 | 1500 | 1.07 | HD 176425 | A0 V | Late-type starccThis object appeared much fainter at J-band when imaged with OSIRIS than as observed by 2MASS. It is possible that the 2MASS source is a chance alignment with an uncatalogued minor planet, or that this source is intrinsically variable. |
| 2MASS J200140234111011 | 15.940.06 | 0.510.20 | 2002 Sep 20 | 1500 | 1.33 | HD 189399 | A2/3 V | Late-type star |
| 2MASS J200534821056545 | 15.280.05 | 0.530.12 | 2002 Sep 22 | 1500 | 1.20 | HD 202753 | B5 V | LHS 483, white dwarf |
| 2MASS J20364476+0335475 | 15.750.08 | 0.460.19 | 2002 Sep 23 | 1500 | 1.20 | HD 198070 | A0 Vn | Late-type star |
| 2MASS J204252017924433 | 15.670.06 | 0.640.15 | 2002 Sep 21 | 1500 | 1.77 | HD 203955 | A0 V | Late-type star |
| 2MASS J20592033+1752232 | 16.020.09 | 0.790.20 | 2002 Sep 24 | 1500 | 1.60 | HD 207563 | B2 V | Late-type star |
| 2MASS J212643580926573 | 15.910.09 | 0.860.17 | 2002 Sep 22 | 1500 | 1.24 | HD 215143 | A0 Vn | Late-type star |
| 2MASS J213014730720578 | 15.480.08 | 0.660.16 | 2002 Sep 20 | 1500 | 1.14 | HD 186837 | B5 V | Late-type star |
| 2MASS J213930090928268 | 15.880.07 | 0.530.20 | 2002 Sep 22 | 1500 | 1.31 | HD 215143 | A0 Vn | Late-type star |
| 2MASS J21443131+0327100 | 15.840.06 | 1.020.13 | 2002 Sep 23 | 1500 | 1.21 | HD 198070 | A0 Vn | Late-type star |
| 2MASS J222828894310262 | 15.660.08 | 0.370.22 | 2002 Sep 24 | 3000 | 1.10 | HD 220802 | B9 V | T dwarf |
| Object | Type | aaEstimated spectrophotometric distance based on spectral type and 2MASS photometry; see 3.3. | ||||||
|---|---|---|---|---|---|---|---|---|
| (pc) | ( yr-1) | () | (km s-1) | |||||
| (1) | (2) | (3) | (4) | (5) | (6) | (7) | (8) | (9) |
| 2MASS J034807726022270 | T7 | 15.320.06 | 0.240.16 | 0.040.28 | 94 | 0.770.04 | 2013 | 3214 |
| 2MASS J051609450445499 | T5.5 | 15.980.09 | 0.260.19 | 0.240.27 | 3413 | 0.340.03 | 2325 | 5521 |
| 2MASS J222828894310262 | T6.5 | 15.660.08 | 0.300.14 | 0.070.24 | 124 | 0.310.03 | 17515 | 176 |
| 1.2432 | 1.2522 | |||||
|---|---|---|---|---|---|---|
| Object | Type | c () | pEW (Å) | c () | pEW (Å) | |
| (1) | (2) | (3) | (4) | (5) | (6) | |
| SDSS 04230414 | T0 | 1.243 | 6.40.8 | 1.252 | 6.61.0 | |
| 2MASS 05160445aaMeasured from combined spectrum. | T5.5 | 1.242 | 11.62.3 | 1.252 | 15.92.0 | |
| 2MASS 02432453 | T6 | 1.243 | 6.81.8 | 1.252 | 10.21.1 | |
| 2MASS 22284310 | T6.5 | 1.243 | 5.01.0 | 1.251 | 9.91.6 | |
| 2MASS 03486022 | T7 | 1.242 | 4.01.1 | 1.250 | 6.41.2 | |
| 2MASS 04150935 | T8 | — | 1.7 | — | 2.2 | |
| Object | H2O-B | CH4-A | CH4-B | SpTaaAdopted spectral type for standards; derived spectral type for discoveries, with uncertainty 0.5 subclasses. |
|---|---|---|---|---|
| (1) | (2) | (3) | (4) | (5) |
| Standards | ||||
| SDSS 04230414 | 0.689 | 0.985 | 0.916 | T0 |
| SDSS 12540122bbData from Burgasser et al. (2002). | 0.559 | 0.943 | 0.826 | T2 |
| 2MASS 05591404bbData from Burgasser et al. (2002). | 0.456 | 0.789 | 0.383 | T5 |
| 2MASS 02432453 | 0.369 | 0.648 | 0.229 | T6 |
| 2MASS 07271710bbData from Burgasser et al. (2002). | 0.332 | 0.509 | 0.133 | T7 |
| 2MASS 04150935 | 0.267 | 0.429 | 0.062 | T8 |
| Discoveries | ||||
| 2MASS 03486022 | 0.371(6) | 0.541(7) | 0.104(7/8) | T7 |
| 2MASS 05160445ccMeasured from combined spectrum. | 0.378(6) | 0.812(5) | 0.207(6) | T5.5 |
| 2MASS 22284310 | 0.285(7/8) | 0.681(6) | 0.228(6) | T6.5 |