Period-magnitude relations for M giants in Baade’s Window NGC 6522
Abstract
A large and complete sample of stars with 9.75 in the NGC 6522 Baade’s Window towards the galactic bulge is examined using light curves extracted from MACHO and photometry from DENIS.
The improved statistics resulting from a sample of over 1000 variables allow all four of the sequences A, B, C and D in the , log diagram of the Large Magellanic Cloud to be seen in the Bulge. The Bulge sequences, however, show some differences from those in the Magellanic Clouds, possibly due to the effects of higher metallicity. These sequences may have value as distance indicators.
A new diagram of the frequency of late-type variables at a given amplitude is derived and compared to the old one due to Payne-Gaposchkin (1951). The catalogued semi-regular variables of the solar neighbourhood are found to be a subset of the total of semi-regulars, biased towards large amplitude.
keywords:
Stars:variables – stars: AGB – stars:pulsation – infrared:stars – surveys1 Introduction
The existence of period-luminosity relations is of great importance to astronomy. Each class of variable that shows such a relation adds to the precision with which distance comparisons can be made between nearby galaxies and ultimately assists in the determination of the distance scale of the universe. Clearly, the limits of precision and the dependence of a relation on factors other than distance must be understood if it is to be truly useful. Among the late-type variables it has been known for over twenty years that the Miras obey a good , log law in the infrared, where they emit most of their energy (e.g., Glass & Lloyd Evans, 1981, 2003). More recently, large-scale variability surveys such as MACHO (Alcock et al, 1999) and the near infrared sky surveys DENIS (Epchtein 1998) and 2MASS (Skrutskie 1998) are leading to new insights into the behaviour of the semi-regular variables (SRVs), which require long runs of data on many objects if their systematic and general properties are to be elucidated. Within the Milky Way galaxy, the Baade’s Windows towards the inner Bulge are particularly suitable for studies of this kind because most of the objects they contain are at an approximately uniform distance that is known with moderate precision.
Alard et al (2001; see also Glass & Alves, 2000) found that nearly all the stars detected during the infrared ISOGAL survey (Omont et al, 2003) at 7 and 15 m of the Baade’s Windows NGC 6522 and SgrI are, in fact, late-type variables, and that many of those with periods in excess of 80 days are losing mass. Such stars contribute significant amounts of re-cycled material to the interstellar medium. By identifying the Alard et al stars in the DENIS data, Schultheis & Glass (2001) have been able to investigate their general properties in the near-infrared colour-magnitude, colour-colour and colour-period diagrams. They have also been cross-identified with a complete sample of M giants with spectral classification by Blanco (Glass & Schultheis, 2002; GS) and the dependence of their variability properties on spectral type and magnitude has been determined. In general, it was found that significant variability occurs only amongst Blanco subtypes of M5 or later (corresponding to M-K subtypes M4 or later).
Wood and the MACHO team (1999) and Wood (2000) showed that the AGB stars in the Large Magellanic Cloud (LMC) fall into four approximately parallel sequences (one of which corresponds to the Miras) in the vs log and vs log diagrams. Although our Baade’s Window work suggested that there was some evidence that the Bulge giants might behave similarly, the numbers of stars were too few to demonstrate this at all convincingly and it was also suspected that the depth of the Bulge along the line of sight was smearing out any systematic trend. Similar results are emerging from studies of the Small Magellanic Cloud (SMC, see Cioni et al and Ita et al, in preparation)
In addition, recent evidence from the LMC (Cioni et al, 2001) suggests that there is more continuity in the amplitude distribution with period of the late-type variables than has hitherto been believed. The canonical view of this distribution rests on the work of Payne-Gaposchkin (1951), based on solar neighbourhood studies made with visual and photographic techniques and with no certainty as to the uniformity of the sample in space. From Payne-Gaposchkin’s work it appeared that a gap existed in the amplitude distribution between the Miras and the irregular variables. This could have been an artefact arising from the ease of detecting Miras in spite of their rarity and the probably similar rarity of stars with intermediate amplitudes, which are much harder to find. In addition, small-amplitude variables will have been under-represented in her data because of the limitations of photographic photometry.
These two considerations suggested that a large-scale investigation of the AGB variables in the NGC 6522 Baade’s Window as they appear in DENIS and MACHO would be worthwhile and would complement similar studies in the Magellanic Clouds. All these areas of the sky have the advantage over the solar neighbourhood that the objects they contain are at more-or-less known distances. In this paper, we take the distance modulus of the NGC6522 field to be 14.7 (Glass et al, 1995). This figure is based on Mira variables in the nearby Baade’s Window field Sgr I and takes the d.m. of the LMC to be 18.55.
2 The data
The MACHO catalogue for stars lying between RA = 18h 02m 09s and 18h 05m 02s and Declination -30∘ 16′′ 39′ and -29∘ 46′′ 43′, (2000) in MACHO field 119, corresponding roughly to the area searched photographically for large-amplitude variables by Lloyd Evans (1976), was downloaded and cross-correlated with the DENIS catalogue, limiting the choice to stars brighter than = 9.75, fainter than which the work of GS suggests that relatively few variables will be found. A total of 1661 stars were selected. The search radius was 3′′ and the mean distance between objects was 0.8′′, with rms scatter 0.4′′
There were 153 stars with 9.75 that seemed to have no MACHO counterparts. Some of these fell on the gaps between CCD chips in MACHO or off one edge of the field (due to a slight mis-match of boundaries). Of the remaining 44, seven stars fell in the region of the clusters NGC 6522 and NGC 6528 that were probably too crowded for the MACHO reduction process. The other 37 appear to have saturated the MACHO CCDs; their positions are surrounded by areas free of stars for several arcsec radius. For example, one is coincident with the Lloyd Evans (1976) Mira D9. Stars of earlier spectral type than M have smaller and are therefore more likely to saturate the MACHO detectors - see also figs 2 and 3).
The detailed data for each of the 1661 stars were downloaded from the MACHO website. The red and blue light curves as well as the frequency power spectrum of each star in each colour were plotted, in batches of 20. The range of frequencies searched was from 0 to 0.1 cycles per day (10 days to infinity in period). The three most conspicuous maxima in each spectrum were extracted automatically, but each light curve and frequency spectrum was also examined by eye. In most cases, the automatically extracted periods agreed between the two colours. There were a significant number of cases where there was no MACHO coverage due to a failed CCD. Occasionally, the data were so sparse as to be useless in one or both colours. The MACHO quality flags (Alcock et al, 1999) were usually disregarded as they were often found to exclude useful data. Instead, the Fourier transform programme was relied upon (see below) to exclude discrepant points. The limit of detectability is estimated to be two or three hundredths of a mag full amplitude.
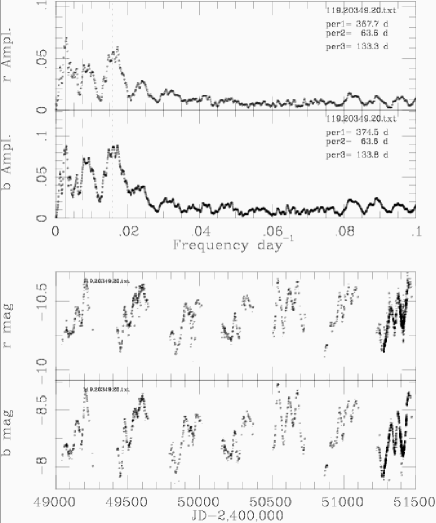
Multiple periodicity is quite prevalent and a distinction is made between doubly-periodic variables, which show a long period (usually a few hundred days) superimposed on a short period, usually some tens of days, and stars with secondary short periods, where both periods are usually tens of days (see also section 7.1). Fig 1 shows an example of a typical classification, in this case a doubly-periodic variable which also has a secondary short period, though one that is anomalously long.
Of the 1661 selected stars, 1085 were found to be variables and 385 were not variable. The remainder consisted of 58 that were clearly saturated at both MACHO and and 133 whose data were sparse or negligible in both wavelengths. The last category were usually, in fact, saturated but in a minority of cases were probably crowded.
We did not find any variables outside the categories of semi-regulars and Miras.
| TLE | Amp3 | MACHO | comments4 | TLE | Amp1 | MACHO | comments2 | ||||
| name | day | day | mag | 119. | name | day | day | mag | 119. | ||
| 395 | 115 | 116 | 2.5 | 20091.28 | 238 | 290: | 5′′ dead zone | ||||
| 440 | 117 | 116 | 3.0 | 19700.529 | D3 | 305 | 20351.6844 | sat, only | |||
| 792 | 126 | 124 | 1.0 | 20349.17 | SRV | 786 | 305 | 320 | 3.5 | 20610.46 | |
| 181 | 180 | 185 | 2.6 | 19833.209 | 207 | 330 | 317 | 19701.6529 | sat, no * | ||
| 574 | 180 | 185 | 3.3 | 20738.63 | A29 | 335 | 339 | 20743.4738 | sparse, no | ||
| 51 | 190 | 198 | 5.0 | 20224.22 | only | 403 | 335 | 340 | 3.5 | 20090.355 | |
| 721 | 190 | 195 | 4.0 | 20353.109 | see note 5 | A3 | 340 | 345 | 4.0 | 20484.176 | |
| 313 | 210 | 218 | 3.1 | 20742.1740 | 120 | 345 | 4.0 | 20613.5347 | sat, no | ||
| 652 | 230 | 237 | 3.0 | 19958.30 | 830 | 360 | 6′′ dead zone | ||||
| 320 | 240 | 240 | 4.0 | 20611.55 | D6 | 360 | 376 | 3.0 | 20611.462 | ||
| 791 | 240 | 240 | 2.5 | 20219.212 | 590 | 375 | 186 | 3.5 | 20478.54 | ||
| 200 | 250 | 5′′ dead zone | D5 | 400: | 446 | 3.5 | 20483.26 | * | |||
| 826 | 250 | 265 | 4.0 | 20743.538 | only | D9 | 400: | see note 6 | |||
| A28 | 260 | 19698.251 | SRV 2 pers, * | D11 | 420: | 525: | 20484.5561 | see note 7 | |||
| 745 | 260 | 246 | 3.4 | 20223.6720 | only | 434 | 420: | 411 | 2.0 | 19700.93 | |
| 796 | 260 | 285 | 4.0 | 19829.124 | 644 | 430 | 413 | 3.0 | 20088.3574 | ||
| D1 | 265 | 257 | 2.0 | 20094.5849 | 103 | 465 | 407 | 4.0 | 20744.1387 | blue only; sat | |
| 136 | 270 | 317 | 3.2 | 20352.38 | 426 | 465 | 453 | 2.5 | 19830.33 | ||
| 228 | 270 | 15′′ dead zone | 435 | 465 | 525 | 3.5 | 19830.34 | ||||
| 332 | 270 | 294 | 3.0 | 20741.325 | 205 | 470: | 531 | 3.0 | 19702.2787 | ||
| 340 | 270 | 282 | 3.5 | 20610.174 | |||||||
| 336 | 270 | 266 | 3.0 | 20610.39 | 144 | 1.7 | 20481.28 | ||||
| A5 | 275 | 298 | 20742.821 | only * | 349 | 2.0 | 20741.923 | ||||
| 575 | 280 | 279 | 4.0 | 20608.43 |
Notes: ‘sat’ denotes saturated. = Lloyd Evans. = MACHO. 3Average amplitudes are given. 4The radii of the dead zones are given in arcsec. 5TLE721 is also listed by MACHO as 119.20353.111 which has only got a red curve. The positions are almost identical. 6The image of D9 is overwhelmed by a nearby bright star. 7This object is sparsely covered, very faint and falls in an area with only blue MACHO coverage. It shows a period of about 525d but an amplitude of 1 mag, which may be untrustworthy. *See text for explanation.
2.1 Interpretation of the Fourier power spectra
The Fourier transform programme removes iteratively all data more than 2.58 standard deviations from the mean and searches for the three most prominent amplitudes using prewhitening between each step.
Some spectra, later disregarded, were apparently distorted by saturation and gave false frequency maxima. The light ‘curves’ in question are usually fairly flat, but with erratic excursions up or down, and the data points were usually near the top of the range in and , but not uniformly so. In some cases, only one of , are saturated and the variations can be seen in the other.
Very often the most prominent feature of the Fourier spectrum is a moderately broad peak with a spike on top. The programme picks out the highest peak - the spike. This can be due to noise, but is more likely a manifestation of a period of highly regular behaviour. The position of the spike was usually close to the maximum of the broad peak. Sometimes the blue and red spikes did not coincide, but the maximum of the broad peaks agreed within a few hundredths of a cycle per day. The position of the red spike was usually the value noted. The periods were normally recorded to three significant figures.
The breadth of the peak is largely determined by the spacing of the observations (the ‘window function’) but can also be affected by irregularity of frequency and amplitude.
Noted were the most prominent short period, the second most prominent short period and the most prominent long period (see fig 1). The long period was sometimes not visually apparent from the light curves but appeared in both the red and blue Fourier spectra. In such cases, the amplitude was very small and noted as 0.05 mag.
The full short-period amplitude was estimated by eye from the light curve whenever possible, and represents the eye-averaged amplitude at the most prominent short period or periods. The values listed were 0.05, 0.1, 0.15, 0.2, 0.3, …. mag. Very small but apparently real amplitudes were classed as 0.05 mag. In the case of doubly periodic stars, the amplitude at the longer period was estimated in the same way. The overall or long-term amplitude was often larger than the quantity just described, whether due to genuine long periods, apparently random variations in amplitude or long-term drifts. As a test of the accuracy and reliability of the amplitude classification, some were repeated independently after a long time. They were sometimes found to differ by one place in the list from the earlier estimates.
We have not attempted to sub-divide the variables by regularity, such as into the traditional regular, SRa, SRb and irregular classes. There are undoubted trends from irregularity to regularity with amplitude and period (Lebzelter, Schultheis & Melchior, 2002).
3 Particular types of variables
3.1 Mira-like variables
Amongst the 1085 variables, 34 had amplitudes above 1.5 mag. All but two of these were Miras or SRVs that had been found previously by Lloyd Evans (1976). The other two were 119.20741.923, which resembles a Mira with 349d period but has an amplitude of only 2 mag, and 119.20481.28, which has a period of 144 days and a amplitude of 1.7 mag.
There are 44 stars in Lloyd Evans’ list (see table 1), of which 10 did not appear in the DENIS-MACHO cross list of 1661. Of these, one was a non-Mira, making 9 that should have been there but were not. Six of the 10 were burnt out in the MACHO images and the remaining four, denoted by asterisks, were omitted from the cross-correlation because they appear to lack DENIS entries (two because of saturation; the other two, TLEA28, a semi-regular, and TLE207, a star with a thick dust shell, were seen in 2MASS). These four had previously been found in the MACHO data by entering positions derived from the Lloyd Evans charts and the Digitized Sky Survey. No additional Miras were discovered. It is possible that some of the Mira light curves were saturated at times in MACHO, so that some amplitudes may be truncated. Table 1 includes two stars (at the end) with amplitudes of 1.7 and 2.0 mag, which were the only other MACHO objects with amplitudes greater than 1.5 mag.
The agreement with Lloyd Evans’s periods is usually good. However, the period of his star 590 was found to be 186d and not 375d as previously determined. This was probably a result of the closeness of the period to half a year, the seasonality of the observations and the use of photographic techniques, which are inherently less photometrically precise.
3.2 Doubly-periodic variables
Wood et al (1999) found large numbers of double-period stars in the LMC and similar stars were found in the Baade’s Window NGC 6522 field by Alard et al (2001). The easiest to find of these stars have short periods of tens of days, of small amplitude, and a long period of hundreds of days, often with somewhat higher amplitude.
The proportion of these double-period stars is harder to evaluate in the NGC 6522 field than in the Magellanic Clouds because the seasonal nature of the observations makes the determination of the long periods less reliable, especially when their amplitudes are small. When all traces of periodic variation, apparent in both colours, are accepted the number of such stars is 189. If only those with amplitude 0.1 mag are counted, it becomes 113. Sources with amplitude 0.2 mag are 55 in number. The maximum secondary amplitude observed is 1.1 and usually it is less than 0.5 mag.
The mags of these variables extend to well below = 8.2, generally taken as the upper limit of the RGB (e.g., Tiede, Frogel & Terndrup, 1995; Omont et al, 1999)
4 Infrared photometry
The DENIS photometry shows good agreement at and with 2MASS and its standard errors should be less than 0.10 to 0.12 mag at each wavelength (Schultheis & Glass, 2001).
The interstellar absorption within the NGC 6522 field has been determined on a star-by-star basis using the programme of Stanek (1996), corrected as prescribed on the web site that he cites. The reddening law was taken to be
In a few cases, such as near the edges of the field or near the clusters NGC 6522 and NGC 6528, the programme (map.f) could not function and was simply taken to be 1.36 (Alcock et al, 1997).
4.1 Colour-colour diagram
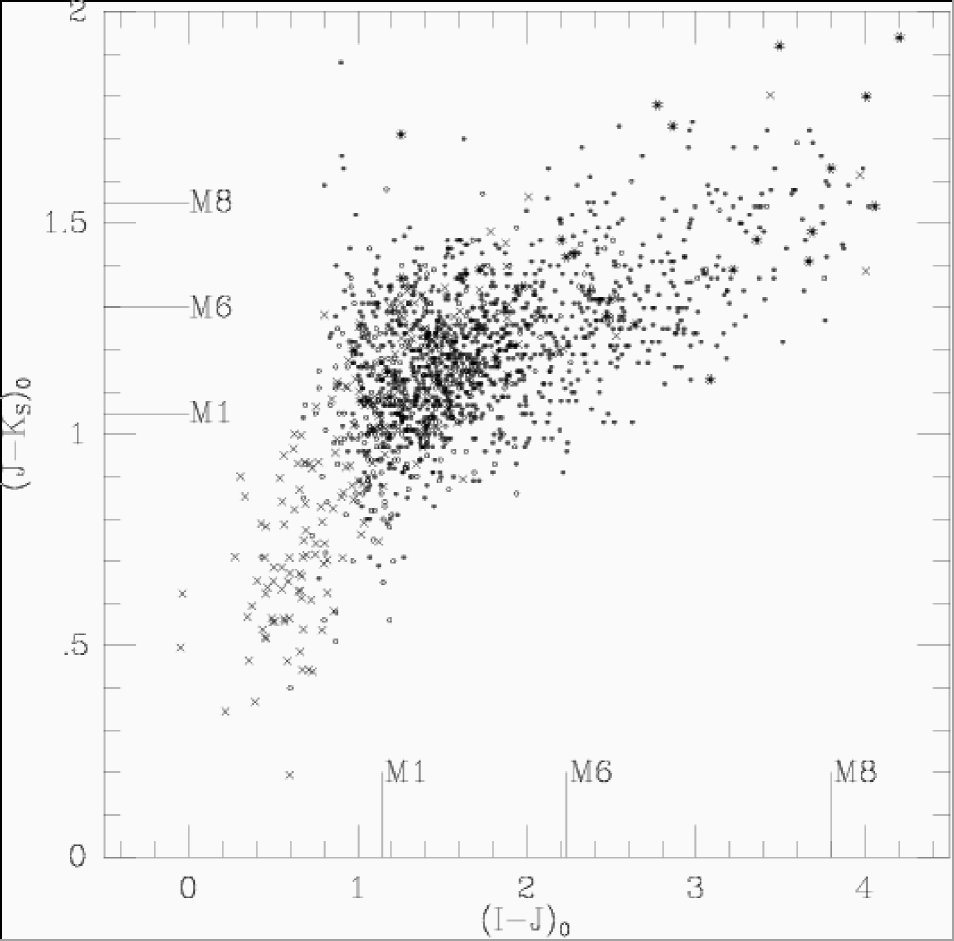
The DENIS colour-colour diagram vs (fig 2) of the survey objects confirms that they are mainly of M spectral type, similar to the stars examined by GS, to which these are a super-set. The saturated stars lie blue-ward of the others in both colours and are clearly of hotter spectral types in general. The figure indicates the colours of some Morgan-Keenan spectral types, taken from GS.
4.2 Colour - magnitude diagram
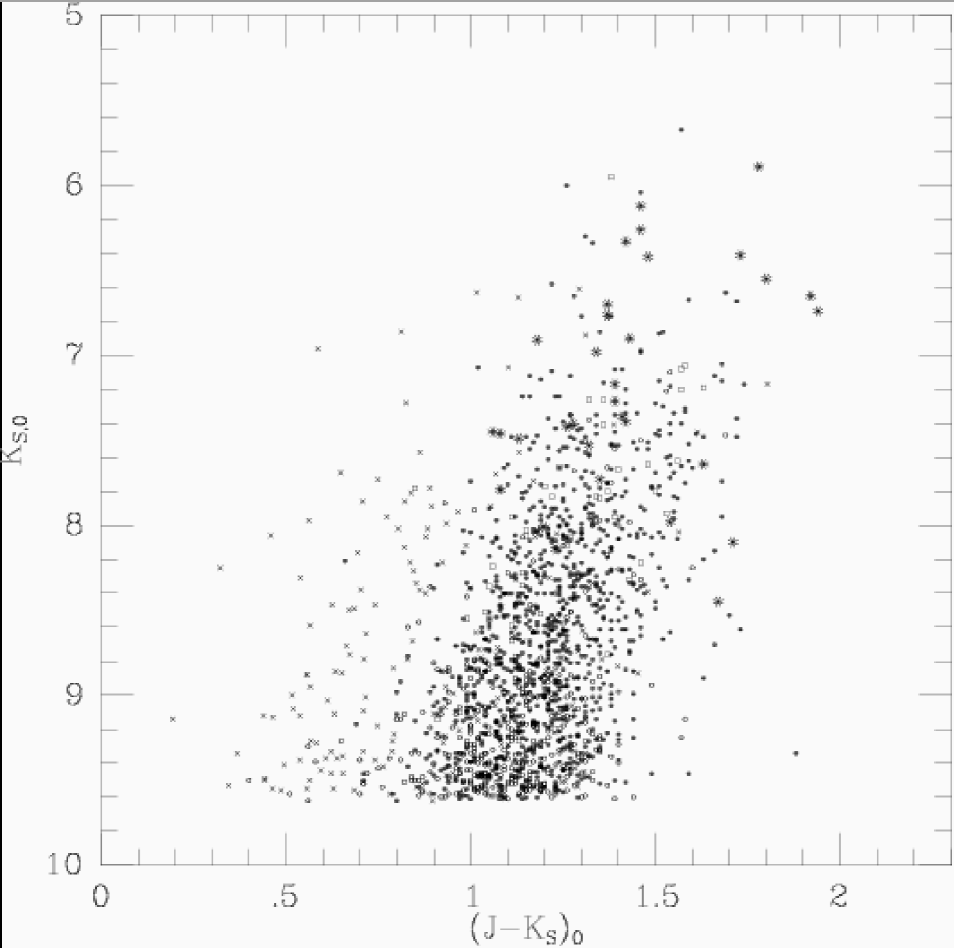
The , diagram is shown in fig 3. The general features of this diagram are similar to that presented by Schultheis & Glass (2001).
Some of the apparent scatter is caused by foreground objects along the line of sight. In addition, there are many objects whose MACHO observations, though not their infrared photometry, are saturated. These are denoted by crosses. These are mostly stars of earlier type than M and are predominantly located blueward of the variables in .
Several types of objects have been distinguished in the figure. As expected, the Miras (asterisks) are usually towards the bright end of the -distribution, although some may have dust shells which place them at fainter and redward of the main distribution. One variable of fairly large amplitude, TLE 395, having a period of only 116 days, is quite faint, at (, ) (9.6, 1.1).
The majority of ‘ordinary’ variables are indicated by small solid symbols. The non-variables are shown as small open circles. The proportion of variables can be seen to be low at faint and to increase strongly with luminosity. This is in accord with the results of GS.
The double-period stars are distinguished by hollow squares. They are evenly spread amongst the ordinary variables in colour, but are relatively more numerous at higher luminosities. However, it should be noted that we have confined the sample to the 55 doubles with long-period amplitudes in excess of 0.2 mag, in the interest of reliability, and this may have a systematic effect on their distribution in the figure.
5 Amplitude distribution


The canonical view of the frequency distribution of the mean amplitude of red variables was given by Payne-Gaposchkin (1951; see fig. 4). The dividing line between small-amplitude variables and Miras is traditionally taken at an amplitude of 2.5 mag in or . At the time, most of the information would have come from photographic photometry, which is not precise enough to identify variables with amplitudes of a few tenths of a mag or less. This is reflected in the dotted line at low amplitudes in her diagram. There appears to be a marked break in the distribution between 2 and 3 mag in amplitude.
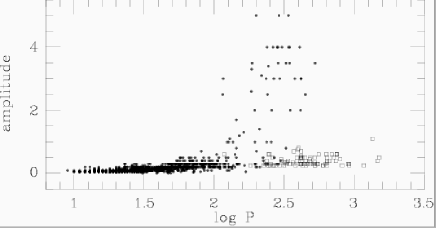
The amplitude distribution vs period is shown in fig 5. The most prominent short period is used in the abscissa. In the case of large-amplitude variables, such as Miras, the shortest period can be several hundred days. The longer periods of the double-period stars are denoted by open symbols. Above a MACHO amplitude of about 0.6 the number of variables drops very sharply. Variables with larger amplitudes than this have periods longer than 200 days. The numbers of small-amplitude variables drop off at a period of around 150 days but the long periods of double-period stars continues the small-amplitude sequence to longer periods.
In figure 6 we show the amplitude distribution of variables in the NGC 6522 field as a histogram with 0.5 mag boxes. In comparing figs 4 and 6, it should be borne in mind that the data in the former are probably of heterogeneous origin and that and amplitudes of late-type variables are somewhat greater than those at MACHO because they represent the short-wavelength tails of the stellar energy distributions and are thus likely to be more temperature-sensitive. The amplitudes of the stars in Table 1 with asterisks have been estimated from the MACHO light curves and are included in the histogram. The figure is slightly distorted by the absence of the other 5 Miras, which would probably fall into the bins around 3 mag. Nevertheless, it is clear that the short period stars outnumber the Miras in the field by about two orders of magnitude (or more if there are many variables below the amplitude limit of the present survey).
It is also clear that the frequency of moderately large-amplitude variables in the region between the Miras and the small-amplitude variables is not as low as in the Payne-Gaposchkin diagram, even though the numbers in each box are small. This reflects the ease of finding Miras in spite of their rarity, while the less-conspicuous intermediate types, although only slightly rarer, were not readily discoverable. The traditional amplitude discriminant for Miras is thus a somewhat weak one.
6 vs log
6.1 The vs log sequences
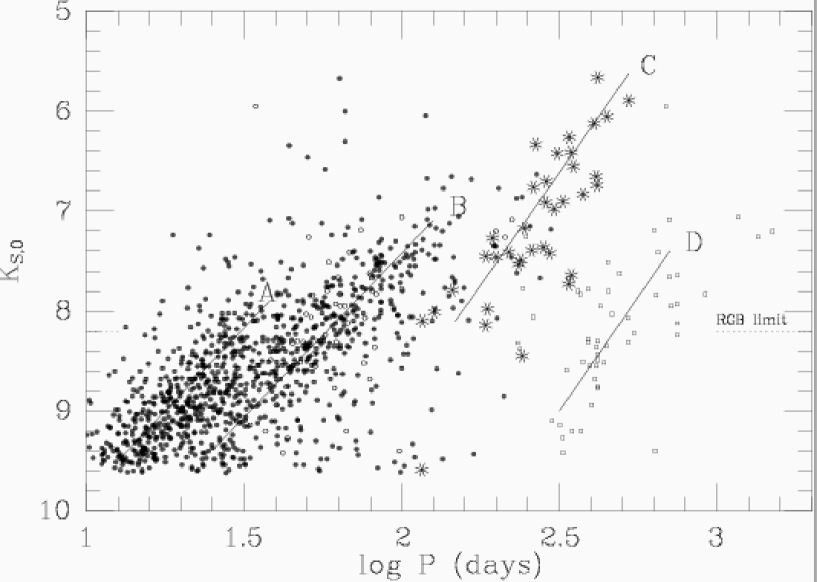
The , log diagram of the NGC6522 field, fig 7, bears a considerable resemblance to that in the LMC (Wood, 2000; Cioni et al, 2001). There are four distinct sequences visible, denoted A, B, C and D. The freehand lines on the figure satisfy the following relations, which are given for convenience only:
The rather steep slope of relation C (the Miras) compared to previous work (e.g., Glass et al, 1995) may be due to the fact that these variables have large amplitudes and that only single observations at are available. A very few extra observations could change the slope. The results of Glass et al (1995) indicate that the Miras in the nearby Baade’s Window Sgr I have the same slope as the LMC , log relation within 0.4 mag per unit of log .
-
•
Sequence A contains the shortest period stars, usually with small amplitudes, and has few members brighter than the upper limit of the Red Giant Branch (RGB) at 8.2.
-
•
In Sequence B are found, besides many normal SRVs, the shorter periods of the doubly-periodic stars, denoted by hollow symbols, whose longer periods occupy sequence D. Sequence B extends to 7, the luminosity level of the 200-day Miras.
-
•
Sequence C is that of the large-amplitude variables, having amplitude 1.5 mag. Nearly all of these are known Miras, discovered by S. Gaposchkin and others, as listed by Lloyd Evans (1976). Since the points shown here are single observations of large-amplitude variables, a close fit to a period-luminosity relation cannot be expected. The two outlying stars near log = 2.5, =7.7, viz TLE 120 and TLE A3, have been observed by Glass & Feast (1982), with similar values but TLE A3 has been seen at = 6.95 by Frogel & Whitford (1987). The star at log = 2.4, = 8.4 is TLE 791, with no previous photometry. The lowest of these points, at = 9.6, is TLE 395, a variable noted by Lloyd Evans to have semi-regular behaviour and which appears faint in the ISOGAL 7 and 15 m measurements (Glass et al, 1999).
-
•
Each star in sequence D, as mentioned, has a corresponding point in sequence B. Only those stars with sequence D amplitudes greater than 0.2 mag are shown, in the expectation that these data will be the most reliable. (The remainder are included in the ordinary variables shown with solid symbols). If the stars with lower mags are included, their secondary periods cause the space between sequences C and D to be somewhat more occupied.
Some of the points scattered around the diagram will correspond to stars that lie in front of the Bulge.
An approximate value for the scatter about the lines A and B in fig 7 was determined by accepting only those stars in parallelograms about 0.4 mag in above and below the freehand lines shown, and limited in to the ranges covered by the lines. It was also assumed that the error is entirely in . The standard deviations of individual stars from the fits were 0.21 and 0.22 mag, which is smaller than that found for the Mira sequence in the nearby Sgr I Baade’s Window by Glass et al (1995), viz 0.35. Although Miras have moderately large amplitudes in the infrared, each of the points in Glass et al is the mean of several observations. The probably slightly greater variation of absorption in the Sgr I Baade’s Window may, however, have a modest effect on the dispersion in the Mira mags. The estimates made here for the semi-regular variables are bound to be optimistic, however, because stars deviating more than 2 were rejected as being outside the parallelograms.
It is clear from visual inspection that the scatter about the sequences is less pronounced in the LMC (cf fig 1 of Wood, 2000) than in the NGC 6522 Window. The finite depth of the Bulge is almost certainly the cause of the higher values observed.
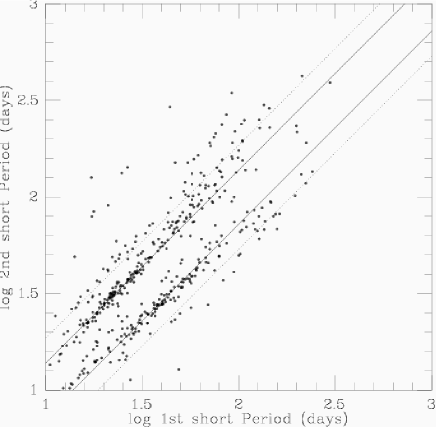
6.2 Secondary short periods
Many of the Fourier spectra show more than one short-period peak, as found earlier in the LMC by Wood et al (1999), and ambiguity may arise when these peaks are nearly equal in height. To illustrate this, we plot in fig 8 the log of the second most important short period against the log of the most important short period for all 443 stars classified as having two or more short periods. Many points fall along (solid) lines that indicate the difference in log period is 0.14, or a factor of about 1.4, at least for periods up to about 50 days, beyond which it seems to increase. The density of points suggests that the second most important peaks are somewhat more often at longer periods than shorter. Thus, stars with almost equal peaks might be misclassified as to period by a factor of 1.4 too high or too low, and this might explain some of the inter-sequence stars in fig 7.
A smaller number of objects fall along lines having differences in log period of 0.27, or a factor of 1.86. These are potential sources of confusion because this is approximately the separation of sequences A and B at a given . As a test, stars falling within the parallelogram boxes centered on sequences A and B (described above) were plotted together with their second short periods on the , log diagram, distinguishing the second periods by special symbols. It is thought that because only about 40% of these stars have secondary short periods and because ambiguity in deciding between primary and secondary short periods is not very common, the effect on fig 7 should not be very noticeable.
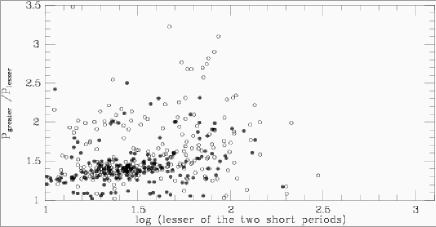
Wood et al (1999) discuss multi-periodic stars in the LMC similar to those mentioned here with more than one short-period. Their fig 4 shows that the factor of 1.4 can be predicted as the ratio of first to second overtone periods in the radially pulsating models of Wood & Sebo (1996), though the other period ratios cannot be fitted quite so satisfactorily. The fact that distinct A and B loci exist in figure 7 in spite of co-existing modes must mean that the ratio between periods is fairly stable. In fig 9 we show the short-period ratios plotted in the same manner as in Wood et al. Although the diagrams agree in that there is a concentration towards a ratio of = 1.4, there are many points towards the left of our figure with higher ratios that are absent in that of Wood et al.
6.3 Solar neighbourhood SRVs
The named semiregular variables, i.e. those in the Combined General Catalogue of Variable Stars (CGCVS) (Kholopov et al, 1998), were mainly discovered by visual or photographic means and are therefore of moderately large amplitude, at least when compared to the majority of variables found here. Knapp et al (2003, in press) show histograms of the period distribution of late-type variables in the Catalogue (their fig 1). The SRb, SRa and Mira distributions peak at periods around 100, 150 and 270d respectively. It is clear that the absence of the small-amplitude variables distorts the appearances of these distributions.
In the solar neighbourhood, the sample with known parallaxes (and therefore absolute magnitudes) is small and confined to stars from the CGCVS and therefore having relatively large amplitude. Since the , log diagrams of the LMC and the NGC 6522 fields show many of the same features, we would expect a complete , log diagram of the solar neighbourhood SRVs to be similar.
In fact, Bedding & Zijlstra (1998) have examined a set of solar neighbourhood SRVs with Hipparcos parallaxes. The variability criterion that they used was that the Hipparcos amplitude, , had to exceed 0.06 mag. This amounts to a peak-to-peak variation (the quantity used in this paper) of 0.12 mag (in fact, most of the Hipparcos light curves of their stars show considerably higher amplitudes than this). The Hipparcos photometric band is very broad and has little sensitivity in the red to near-infrared regions (our variability amplitude was estimated where possible for the band of MACHO, and is usually about 75% of that in the MACHO band). If we restrict fig 7 to stars with amplitude greater than 0.3 mag, it is found that most of sequence B below = 8.5 disappears. This has been done in figure 10.

The Bedding & Zijlstra stars and the remaining NGC 6522 large-amplitude SR variables are seen to occupy rather similar regions of the , log diagram. This suggests that the dotted line that they draw on their fig 1, if it has physical significance as an evolutionary track, only applies to the highest amplitude, most luminous and longest period of the B-sequence SR variables in the solar neighbourhood, and is not a property of all SR variables. It remains possible that the whole of the , log diagram (fig 7, excluding the region of sequence D) represents stars along evolutionary tracks parallel to those of Bedding & Zijlstra. Tracks with the same slope were predicted by Vassiliadis & Wood (1993).
6.4 Comparison with LMC

Fig 11 compares the estimated positions of the , log sequences in the LMC, SMC and NGC6522 fields, after adjusting for distance moduli. The data shown have been extracted by different investigators and, because there is a subjective element in their interpretation, there may be some systematic errors. The comparison should, therefore, be regarded as preliminary. Nevertheless, the sequences agree quite well between the various sets of data, in spite of the known differences in metallicity between fields.
The most apparent differences that can be seen relate to the period ranges that each sequence covers:
-
•
The A sequence seems to reach to higher luminosities in the SMC and LMC than in NGC 6522, though they are few in number above the estimated tip of the RGB ( 8.2)
-
•
The B sequence seems to extend to higher luminosities in the Magellanic Clouds than in the NGC 6522 field, corresponding to 6.4, which is comparable to the 400-day Miras. However, the extension consists mainly of carbon stars, which do not occur in the NGC 6522 field.
-
•
In the LMC data the low-luminosity end of sequence B is populated as densely as that of sequence A. However, in NGC 6522 it appears to be much more sparse.
-
•
In the LMC, sequence C (the Miras) consists mainly of C stars at higher luminosities. This range is occupied by M stars in the NGC 6522 field.
-
•
The scatter in sequence D is high in the present sample, mainly because of the seasonal interruptions. The data are probably compatible with those from the Magellanic Clouds.
There are other noticeable ways in which the galactic and Magellanic Cloud M giants differ. For example, in comparing the infrared colours of Miras in various period groups, Glass et al (1995) have found that those in the Sgr I field and solar neighbourhood tend to be redder than similar objects in the LMC, especially at longer periods.
Lebzelter et al (2002) show that there are also differences in the distribution of colour with period between the Bulge SRVs and those in the LMC, in that the Bulge stars show a much larger colour range. This is almost certainly a result of higher metallicity in the Bulge.
Two other manifestations of the metallicity difference are the high prevalence of S and C stars in the LMC and the fact that the spectral types of the Mira variables are much earlier on average than in the Galaxy (see, e.g., Glass & Lloyd Evans, 2003, to be published). This is because of their lower metallicity, consequent lower opacity and hence higher effective temperature. Nevertheless, the most extreme AGB stars do become as cold as those in the Bulge, with dust-enshrouded AGB stars in both the LMC (van Loon et al. 1998) and SMC (Groenewegen & Blommaert 1998) reaching spectral types as late as M9 and M10.
7 Conclusions
In our survey of the NGC 6522 clear window of Baade for stars with brighter than 9.75. Some 1661 objects were found with MACHO counterparts and, of these, 1085 were found to be variable.
It has been shown that the , log sequences visible among the late-type giants in the Magellanic Clouds are also to be seen in galactic stars and that they are not significantly displaced in position on an absolute magnitude basis. Thus, in a galaxy where a sufficient number of objects can be monitored, these objects may have value as distance indicators.
Double period stars that appear in the B and D sequences constitute 10% to 20% of the variables. Their long periods rarely have amplitudes above 0.5 mag. They are similar to other variables in the B sequence in colour but are found predominantly amongst the longer period stars, bright in . They differ from their Magellanic Cloud counterparts with lower metallicity in that they have a cut-off at about the limit of the LMC oxygen-rich stars and thus do not overlap the region of the carbon stars.
The Mira sequence (C) however, extends to luminosities similar to its counterpart in the LMC, but the higher-luminosity stars are O-rich rather than C-rich.
Because our method for finding variables is less biased than the traditional ones, we have been able to show that the distribution of amplitudes of red variables does not have a conspicuous gap between the large-amplitude variables (Miras) and the semi-regular variables.
8 Acknowledgments
We thank Dr Chris Koen, South African Astronomical Observatory, for help and advice concerning the Fourier transformation programs. Dr T. Lloyd Evans made helpful comments on a draft of the paper. Mr Y. Ita and collaborators gave permission to quote their work.
ISG thanks the Institut d’Astrophysique de Paris for their hospitality during part of this work. This visit was supported by the CNRS/NRF agreement.
MS is supported by the APART programme of the Austrian Academy of Science.
This paper utilizes public domain data originally obtained by the MACHO Project, whose work was performed under the joint auspices of the U.S. Department of Energy, National Nuclear Security Administration by the University of California, Lawrence Livermore National Laboratory under contract No. W-7405-Eng-48, the National Science Foundation through the Center for Particle Astrophysics of the University of California under cooperative agreement AST-8809616, and the Mount Stromlo and Siding Spring Observatory, part of the Australian National University.
We acknowledge use of the Digitized Sky Survey produced at the Space Telescope Science Institute under US Government grant NAG W-2166, based on material taken at the UK Schmidt Telescope, operated by the Royal Observatory Edinburgh with funding from the UK Science and Engineering Research Council and later by the Anglo-Australian Observatory.
References
- [] Alard C. et al, 2001, ApJ, 552, 289
- [] Alcock C. et al, 1997, ApJ, 494, 396
- [] Alcock C. et al, 1999, PASP, 111, 1538
- [] Bedding T.R, Zijlstra A.A., 1998, ApJ, 506, L47
- [] Cioni M.R., Marquette J.-B., Loup C., Azzopardi M., Habing H.J., Laserre T., Lesquoy E., 2001, A&A, 377, 945
- [] Epchtein N., 1998, in Epchtein N., ed., The Impact of Large Scale Near-IR Sky Surveys, Kluwer, Dordrecht, p. 3
- [] Frogel J.A., Whitford A.E., 1987, ApJ, 320, 199
- [] Glass I.S., Alves D., the ISOGAL and MACHO teams, 2000, in Lemke D., Stickel M., Wilke K., eds, Lecture Notes in Physics Ser. 548, ISO Surveys of a Dusty Universe. Berlin, Springer, p. 363
- [] Glass I.S. et al, 1999, A&A, 308, 127
- [] Glass I.S., Feast M.W., 1982, MNRAS, 198, 199
- [] Glass I.S., Lloyd Evans, 1981, Nature, 291, 303
- [] Glass I.S., Lloyd Evans, 2003, MNRAS in press
- [] Glass I.S., Schultheis M., 2002, MNRAS, 337, 519 (GS)
- [] Glass I.S., Whitelock, P.A., Catchpole R.M., Feast M.W., 1995, MNRAS, 273, 383
- [] Groenewegen M.A.T., Blommaert J.A.D.L., 1998, A&A, 332, 25
- [] Ita Y., Tanabé T., Matsunaga N., Nakajima Y., Nagashima C., Nagayama T., Kato D., Nagata T., Nakada Y., 2003, MNRAS, submitted
- [] Kholopov P.N., Samus N., Frolov M.S. et al (eds), 1998, Combined General Catalogue of Variable Stars.
- [] Knapp G.R., Pourbaix D., Platais I., Jorissen A., 2003, A&A, in press
- [] Lebzelter T., Schultheis M., Melchior A.L., 2002, A&A, 393, 573, 2002
- [] Lloyd Evans T., 1976, MNRAS, 174, 169
- [] Omont A., et al 1999, A&A, 348, 755
- [] Omont A., et al 2003, A&A, in press
- [] Payne-Gaposchkin C., 1951, in Astrophysics, ed Hynek J.A., McGraw-Hill, p.522
- [] Schultheis M., Glass I.S., 2001, MNRAS, 327, 1193
- [] Skrutskie M.F., 1998, in Epchtein N., ed., The Impact of Large Scale Near-IR Sky Surveys, Kluwer, Dordrecht, p. 11
- [] Stanek K.Z., 1996, ApJ, 460, L37
- [] Tiede G.P., Frogel J.A., Terndrup D.M., 1995, AJ, 110, 2788
- [] van Loon J. Th. et al, 1998, A&A, 329, 169
- [] Vassiliadis E., Wood P.R., 1993, ApJ, 413, 641
- [] Whitelock P.A., 1986, MNRAS, 219, 525
- [] Wood P.R., 2000, Publ. Astr. Soc. Australia, 18, 18
- [] Wood P.R. and the MACHO team, 1999, in Asymptotic Giant Branch Stars, IAU Symp. 191, eds. Le Bertre T., Lèbre A., Waelkens C., p. 151
- [] Wood P.R., Sebo K.M., 1996, MNRAS, 282, 958